


1. Background
In lung cancer patients, initial oncologic staging is usually performed using morphologic imaging such as computed tomography (CT), which is often complemented by functional imaging modalities, such as 18Fluorine-fluorodeoxyglucose-positron emission tomography/computer tomography (18F-FDG-PET/CT) (1, 2), or in some cases also magnetic resonance imaging (MRI) (3). For therapeutic planning, loco-regional tumor growth, mediastinal lymph node (LN) infiltration and the absence or presence of distant metastases is of vital importance to predict oncological outcome. Regarding nodal staging, the involvement of contralateral or multiregional mediastinal LNs often excludes patients from primary surgery (4, 5). False positive findings can occur in FDG-PET/CT due to inflammation in the lung and the associated mediastinal LNs (6). Therefore, histological confirmation of suspicious PET findings as part of invasive staging procedures is recommended by different guidelines (7), thus increasing the risk for potential side effects of invasive staging.
To extract further information from non-invasive 18F-FDG-PET/CT and MRI, metric and functional PET and MRI measures were evaluated, including diffusion and perfusion analyses as part of native and dynamic contrast-enhanced (DCE) MRI studies. In particular, the use of dynamic MR imaging with dedicated, contrast-enhanced MR protocols of the lung within a strategy adapted to the pulmonary circulation, has recently shown to be a simple and robust technique for the evaluation of lung lesions of different dignities (3). Moreover, in the setting of integrated PET/MRI, the combination of metabolic PET, as well as morphological and functional MR imaging using dedicated protocols for the evaluation of moving thoracic lung lesions and LNs, can potentially further improve nodal staging in patients with lung cancer. This is of interest, since recent studies evaluating the use of combined 18F-FDG-PET/MRI in most cases could not find significant advantages of the simultaneous use of PET and MRI in the staging of lung cancer patients (8-11).
2. Objectives
The hypothesis of this investigation was that possible malignant mediastinal LN involvement could be further characterized using diffusion-weighted imaging (DWI) and DCE MRI-sequences as part of a dedicated MR protocol for lung imaging.
3. Patients and Methods
3.1. Study Design and Patients
The study was conducted as a retrospective single-center analysis. From 2013 to 2016 a total number of 50 patients suffering from NSCLC was investigated with an MRI of the chest in our department, including diffusion- and DCE MR-imaging. All patients had additional 18F-FDG-PET/CT of the lung according to the clinical schedule. Imaging was performed within two weeks prior to surgery/histopathological sampling. The study was approved by the institutional review board and conducted according to the guidelines of the institutional review board (IRB) and within the bounds of good clinical practice according to the ethical principles that have their origin in the Declaration of Helsinki. Written informed consent was obtained from all patients.
3.2. 18F-FDG-PET/CT
18F-FDG-PET/CT was performed as part of the clinical routine for reasons of preoperative staging reasons and therapeutic planning within two weeks prior to surgery including mediastinal LN-dissection. Patients with neoadjuvant radiation and/or chemotherapy were ruled out from the analysis. Patients were examined with a biograph 6 PET/CT scanner (Siemens Medical Solution, Knoxville, Tennessee, USA).
As recently described in the body of the literature (12, 13), after fasting for at least 8 hours, 18F-FDG-PET/CT was performed at a blood glucose level below 150 mg/dL, administering 4 Mega Becquerel / kilogram (MBq/kg) body weight of 18F-FDG intravenously. Quantitative PET evaluation was based on maximum standard uptake value (SUVmax) calculations 60 minutes after tracer injection. For reconstruction of CT images, the following reconstruction parameters were used: Slice thickness/reconstruction increment of 5.0/2.5 mm, standard soft-tissue reconstruction kernel B30.
3.3. MRI Technique
All MRI-studies in this research were performed with a dedicated protocol that is aligned with lung imaging as described in a recent publication by Koenigkam-Santos et al. (3). All MRI-measurements were performed using a 1.5-T MR scanner (Siemens Aera, Erlangen, Germany). Prior to the application of contrast agent (CA), morphological sequences were acquired as described in detail in the above mentioned study (3) using an identical protocol including T2-weighted pulse sequence images, half-fourier acquisition single turbo spin-echo (HASTE in coronal and transversal plane); T2-weighted BLADE sequences with fat suppression (FS) in the transversal plane; volumetric interpolated breath-hold examination (VIBE) images with and without FS in the transversal plane; dynamic free-breathing balanced steady-state free precession in the coronal plane, gradient echo images using overlapping slices (“cine effect”); and free breathing two-dimensional (2D) echo-planar diffusion-weighted imaging (DWI) with different b-values (0 - 800) in the transversal plane. For DCE-MRI, VIBE sequences with FS and constant sequence parameters were used. All sequences were acquired during consecutive breath holds with a slice thickness of 4 mm. After the application of CA, six acquisitions were acquired, including five in the axial view, and one in the coronal view (3rd minutes). Via the cubital vein, a single dose of a rapid bolus of 0.1 mmol Gadobutrol (Gadovist 1.0, Bayer Healthcare Pharmaceuticals, Leverkusen, Germany)/kg body weight was injected by intravenous administration. Therefore, an automatic power injector was used (2.5 mL/s). Initial flush was followed by 20 mL of 0.9% saline (same injection rate). A bolus detection technique (CARE bolus, 1 s time resolution) was used to adapt diagnostic acquisitions to the individual circulation time. Bolus detection was performed in the pulmonary trunk. Including the whole protocol, all examinations were performed within 20 - 25 minutes. During the whole study, no adverse events were observed.
3.4. Image Analysis
LN evaluations and post-processing including PET- and MRI-analysis were performed by an experienced radiologist (5 years) blinded to clinical information and to histological diagnosis. Findings in PET and MRI for each LN level were correlated with the histological gold standard as stated in the histopathological report taking the histological tumor subtype into account [adenocarcinoma (ADC), adenosquamous cell carcinoma (ADC-SQCC), neuroendocrine tumors (carcinoid), squamous cell carcinoma (SQCC), non-small cell lung cancer not otherwise specified (NSCLC NOS)]. Histopathological analyses were based on surgical resection including mediastinal LN-dissection within two weeks after PET- and MR-imaging.
MRI-analyses were performed as described in detail by Koenigkam-Santos et al. (3) quantifying the following parameters: relative signal intensity (SI%), time point of arrival of CA after injection (tCA), type of SI-time curves for each LN, time of early peak of contrast enhancement (EP), slope of contrast enhancement (SE), maximum of contrast enhancement in all acquisitions (MaxE), relation of EP to MaxE, washout ratio (WOR), relative enhancement 4 minutes after CA injection (4 minutes) (3). As proposed in many studies before, shapes of curves were classified into four different types (3, 14) as follows: curve type A (fast, intense early increase of SI, subsequent fast and significant decrease [washout]); curve type B (fast, intense early increase of SI, lacking washout); curve type C (mild / moderate progressive increase of SI in all acquisitions); curve type D (no significant increase of SI over non-enhanced level). Detailed definition of the parameters EP, SE and WOR were described previously (3).
3.5. Statistical Analysis
For statistical analysis, SigmaPlot (Systat Software GmbH, Erkrath) and R version (The R Foundation for Statistical Computing, Vienna, Austria) were used. Median and quantile values for signal intensity in MRI, Bq/mL and SUVmax in PET with 95% confidence interval were calculated and illustrated in Box-and-Whisker plots or as multiple lines with error-bars in a scatter chart. In order to take possible correlations between lesions on the same patient into account, applied statistical tests were undertaken using likelihood ratio tests in a linear mixed model, with “patient id” as a random factor. All graphical displays refer to individual lesions. Differences were considered significant at P < 0.05 in a likelihood ratio (LR) test.
4. Results
4.1. Histological Findings and Patient Population
Due to the strict selection criteria, a total number of 28 LNs could clearly be correlated in DWI-MRI, DCE-MRI, 18F-FDG-PET/CT and histopathology [12 patients (9 male, median age: 63 years)]. The other patients had to be excluded for reasons of outdated or external 18F-FDG-PET/CT with missing cross-calibration, due to missing histopathological proof out of one of the examined mediastinal LNs due to systemic tumor spread or biopsies out of a distant metastasis, or due to unclear or missing assignment between histopathological findings, and the corresponding findings in MRI and/or 18F-FDG-PET/CT. Among the 28 LNs, tissue samplings were performed via mediastinal LN dissections as part of surgical resections in all patients with histopathology as diagnostic gold standard (Figures 1 and 2). Out of the 28 LNs, 20 LNs in 11 patients were of benign histology; 8 LNs in 4 patients were malignant and out of them 3 had also histologically proven benign LNs. Out of the 12 patients who were analyzed, tumor entities were as follows: ADC (n = 4), ADC-SQCC (n = 2), carcinoid, (n = 3), SQCC (n = 1), NSCLC NOS (n = 2). The 8 malignant LNs included the following tumor entities: ADC (n = 5), ADC-SQCC (n = 1), carcinoid, (n = 2).
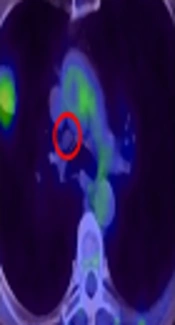
 and maximum intensity projection (MIP) of <sup>18</sup>Fluorine-fluorodeoxyglucose-positron emission tomography (<sup>18</sup>F-FDG-PET) below. Middle series with magnified native CT (upper line), PET (below), and fused <sup>18</sup>F-FDG-PET/CT-image (lower line). Right series demonstrates histopathological gold standard of benign lymph node (LN) (Haematoxylin and Eosin (H & E) staining, upper line 40-times magnified). The observed LN is indicated by a red circle, red line in the MIP of FDG-PET/CT indicated section plane for axial slices.")
Histologically-proven benign lymph node. Left series demonstrates axial view of native CT (upper line) and maximum intensity projection (MIP) of 18Fluorine-fluorodeoxyglucose-positron emission tomography (18F-FDG-PET) below. Middle series with magnified native CT (upper line), PET (below), and fused 18F-FDG-PET/CT-image (lower line). Right series demonstrates histopathological gold standard of benign lymph node (LN) (Haematoxylin and Eosin (H & E) staining, upper line 40-times magnified). The observed LN is indicated by a red circle, red line in the MIP of FDG-PET/CT indicated section plane for axial slices.
 and maximum intensity projection (MIP) of <sup>18</sup>Fluorine-fluorodeoxyglucose-positron emission tomography (<sup>18</sup>F-FDG-PET) below. Middle series with magnified native CT (upper line), PET (below), and fused <sup>18</sup>F-FDG-PET/CT-image (lower line). Right series demonstrates histopathological gold standard of malignant lymph node (LN) (Haematoxylin and Eosin (H & E) staining, upper line 40-times magnified). The observed LN is indicated by a red circle, red line in the MIP of FDG-PET/CT indicated section plane for axial slices.")
Histologically-proven malignant lymph node. Left series demonstrates axial view of native CT (upper line) and maximum intensity projection (MIP) of 18Fluorine-fluorodeoxyglucose-positron emission tomography (18F-FDG-PET) below. Middle series with magnified native CT (upper line), PET (below), and fused 18F-FDG-PET/CT-image (lower line). Right series demonstrates histopathological gold standard of malignant lymph node (LN) (Haematoxylin and Eosin (H & E) staining, upper line 40-times magnified). The observed LN is indicated by a red circle, red line in the MIP of FDG-PET/CT indicated section plane for axial slices.
4.2. PET Imaging
Regarding PET-acquisition 60 minutes after FDG-administration, malignant LNs presented with significantly higher SUVmax-values (mean 4.71 ± 2.89) compared to benign LNs (mean 1.85 ± 0.57, P = 0.02, Figures 1 - 3) and mediastinal blood pool (mean 2.02 ± 0.42, P < 0.01, Figures 1 - 3).
-analysis. Box plots of maximum standard uptake value (SUVmax) calculated by static PET images 60 minutes after fluorodeoxyglucose (FDG) injection. Significantly higher SUVmax in malignant lymph nodes (LNs) compared to benign LNs (P = 0.02), BP, blood pool.")
Positron emission tomography (PET)-analysis. Box plots of maximum standard uptake value (SUVmax) calculated by static PET images 60 minutes after fluorodeoxyglucose (FDG) injection. Significantly higher SUVmax in malignant lymph nodes (LNs) compared to benign LNs (P = 0.02), BP, blood pool.
4.3. MR-Imaging with DCE-Analysis and DWI
SI-time curves could be created for all of the 28 LNs, and derived perfusion parameters were calculated. Regarding benign LNs, 19 out of 20 LNs presented with curve type A (Figure 4A and B) (Table 1), one out of 20 LNs presented with curve type B. Regarding malignant LNs, five out of eight LNs presented with curve type B, three out of eight LNs presented with curve type C (Figure 4A and B) (Table 1). None of the examined LNs presented with curve type D.
| Diagnosis | P value | ||
|---|---|---|---|
| Benign | Malignant | ||
| N lesions | 20 | 8 | |
| MRI size, mm | 0.93 (0.7 - 1.1) | 0.81 (0.7 - 1.0) | 0.12 |
| Curve type, N | |||
| A | 19 | 0 | |
| B | 1 | 5 | |
| C | 0 | 3 | |
| D | 0 | 0 | |
| EP, SI% | 4.1 (0 - 16.3) | 1.7 (1.1 - 1.6) | 0.03 |
| SE, SI%/s | 1.37 (0.13 - 2.50) | 0.37 (0.18 - 0.84) | < 0.01 |
| MaxE, SI% | 49.1 (3 - 98) | 124 (72 - 296) | < 0.01 |
| EP/MaxE, % | 1.0 (1.0 - 1.0) | 0.72 (0.58 - 0.84) | < 0.01 |
| WOR, % | 81.4 (38 - 98) | n.m | n.m |
| 4 min, % | 7.85 (< 0 - 55) | 124 (72 - 296) | < 0.01 |
Abbreviations: EP, early peak of contrast enhancement; DCE, dynamic contrast enhanced; MaxE, maximum of contrast enhancement in all acquisitions; n.m, not measurable; SE, slope of contrast enhancement; WOR, washout ratio; SI, signal intensity.
aDerived parameters from DCE-MRI of benign and malignant lymph nodes (LNs). All values are mean values with minimum and maximum values in parentheses, with corresponding P values above.
-MRI. A, DCE-MRI of lymph nodes (LNs), axial view of dynamic contrast-enhanced LNs, 30, 60, 180 and 240 seconds after injection of contrast agent (CA). Upper line demonstrates above mentioned malignant LN, lower line demonstrates above mentioned benign LN. Right series with correlating perfusion curve of LN. B, Signal intensity over time in DCE-MRI, plot of signal intensity during DCE measurement in benign LNs (black line) and malignant LNs (red line). Green line indicates signal intensity in aorta.")
Dynamic contrast enhanced (DCE)-MRI. A, DCE-MRI of lymph nodes (LNs), axial view of dynamic contrast-enhanced LNs, 30, 60, 180 and 240 seconds after injection of contrast agent (CA). Upper line demonstrates above mentioned malignant LN, lower line demonstrates above mentioned benign LN. Right series with correlating perfusion curve of LN. B, Signal intensity over time in DCE-MRI, plot of signal intensity during DCE measurement in benign LNs (black line) and malignant LNs (red line). Green line indicates signal intensity in aorta.
In comparison to benign LNs, malignant LNs demonstrated lower values for EP (P = 0.03) and SE (P < 0.01, Table 1). In contrast, malignant LNs presented with higher values with respect to the parameter MaxE (P < 0.01) and 4 minutes (P < 0.01) (Table 1).
Following the above mentioned results, the curve type A is associated with benign LN findings, and the curve types B and C seem to represent malignant LN infiltration.
Regarding ADC analysis, malignant lesions presented with significantly lower values (mean 1318.6 mm2/s ± 125.7) compared to benign LNs (mean 1645.5 mm2/s ± 304.7) (Figure 5) (P < 0.01). A possible cut-off value for the exclusion of malignancy in suspicious LNs was found for a signal intensity of 1528 mm2/s, since 100% of all LNs above the 1528 mm2/s cut-off were benign, while 53% of all lesions below the 1528 mm2/s limit were malignant (sensitivity: 1.0, specificity: 0.65; positive predictive value: 0.53; negative predictive value: 1.0, overall accuracy: 0.75) (Figure 5). This might potentially help to exclude malignancy from suspicious LNs above the proposed signal intensity.
: Apparent diffusion coefficient (ADC) of malignant and benign lymph nodes (LNs). Left series demonstrates exemplarily chosen malignant LN (upper line) and exemplarily chosen lower LN (lower line). Right series shows Box Plot of ADC measurements with the derived threshold of 1528 in order to exclude malignancy (red line).")
MRI with diffusion weighted imaging (DWI): Apparent diffusion coefficient (ADC) of malignant and benign lymph nodes (LNs). Left series demonstrates exemplarily chosen malignant LN (upper line) and exemplarily chosen lower LN (lower line). Right series shows Box Plot of ADC measurements with the derived threshold of 1528 in order to exclude malignancy (red line).
Respective receiver operating characteristic (ROC)-curves and area under the curve (AUC)-values for the PET-parameter SUVmax, as well as for the MRI-parameters ADC, EP, SE, MaxE, EP/MaxE and 4 minutes are mentioned in Figure 6.
 for the positron emission tomography (PET)-parameter maximum standard uptake value (SUVmax) (black line), and the measured MRI parameters including apparent diffusion coefficient (ADC) (red line), early peak of contrast enhancement (EP) (green line), slope of contrast enhancement (SE) (yellow line), maximum of contrast enhancement in all acquisitions (MaxE) (dark blue line), EP/MaxE (purple line) and 4 minutes (light blue line).")
Sensitivities and specificities for all applied parameters. Area under the curve (AUC) for the positron emission tomography (PET)-parameter maximum standard uptake value (SUVmax) (black line), and the measured MRI parameters including apparent diffusion coefficient (ADC) (red line), early peak of contrast enhancement (EP) (green line), slope of contrast enhancement (SE) (yellow line), maximum of contrast enhancement in all acquisitions (MaxE) (dark blue line), EP/MaxE (purple line) and 4 minutes (light blue line).
5. Discussion
In order to differentiate between benign and malignant mediastinal LNs, we found significant differences in the aspects of FDG uptake in 18F-FDG-PET/CT, as well as in DWI- and DCE-MRI analysis within the identical patient population, thus confirming the hypothesis of this study. Nevertheless, some of the findings need critical discussion, since prior studies focusing on DCE-MRI, DWI-MRI and DCE-CT of mediastinal LNs detected a huge variability of findings that are contradictory in some aspects. Regarding ADC analysis in this study, it was possible to suggest an ADC-based cut-off value of 1528 mm2/s in order to exclude malignancy from LNs that are above the threshold of 1528 mm2/s. This might be of interest, especially in a pre-operative setting, in cases of FDG-equivocal findings, since dedicated DWI sequences can easily be introduced into routine MR protocols and also in the setting of integrated PET/MRI.
Regarding the use of FDG-PET/CT examinations, we found a significantly higher FDG uptake in malignant LNs in the static scan 60 minutes after glucose injection, which is already well known as part of the daily clinical routine (6, 12, 13). As recently described by Sauter et al. there were some inverse correlations between the vascular aspect of tumor supply measured by CT perfusion and the glucose dependent tumor metabolism measured by PET studies when evaluating mediastinal LNs in NSCLC patients. In contrast to findings in mediastinal LNs, Sauter et al. discovered that perfusion and glucose metabolism were uncoupled when examining the primary tumor (15). This is of interest, since the present study found conflicting results in some aspects when comparing the derived perfusion parameters from the present LN analysis with prior results derived from the analyses of the primary tumors or solitary pulmonary nodules. In this context, data derived from DCE-MRI of the observed LNs demonstrated significantly higher values for MaxE and the 4- minutes value for malignant LNs, while malignant lesions presented with significantly lower values for the parameters SE, EP and EP/MaxE. These findings correlate with the presence of type B and type C curves in malignant LNs, while benign LNs demonstrated an overabundance of type A curves. These findings are contrary to previous findings from Koenigkam-Santos et al. (3) and Schaefer et al. (14), where curve types A and B were associated with malignancy, while the curve types C and D were in most cases common in benign findings when examining solitary pulmonary nodules instead of mediastinal LNs. In particular, findings concerning the parameters SE, EP and EP/MaxE are opposing findings that were derived by Koenigkam-Santos, who examined the perfusion of primary tumors using the same MR protocol (3), and to findings published by Ohno et al. who introduced initial experiments with DCE MRI of solitary pulmonary nodules (16). As stated in a previous study (3), different findings of measured perfusion parameters can be partly explained by the different techniques that were used for DCE measurements in the different perfusion studies used in the past (14, 16-22). Nevertheless, the robustness of the applied MR protocol in the present study for the evaluation of small lesions ≥ 8 mm has already been noted by Koenigkam-Santos et al. which is a necessary condition for the evaluation of suspicious LNs (3). Moreover, the protocol is adjusted to patients suffering from lung diseases since only five breath holds are necessary during the 4 min of DCE imaging. In addition, a study published by Spira et al. focusing on CT perfusion analysis of LNs in patients with lung cancer found no significant differences in perfusion characteristics between benign and malignant LNs (23). Taking all the above-mentioned data from prior studies into account, the technique of DCE measurement in LN-staging for patients with lung cancer is not yet reliably applicable in a daily clinical setting.
Regarding ADC-based analysis of the DWI studies, significantly lower signal intensity was found in malignant LNs compared to benign LNs. These findings correlate with prior results from Schaarschmidt et al. and Ye et al. who were both examining ADC signal in LN-metastases of patients with lung cancer (24, 25). Lower ADC signal in metastatic LNs are also found in a study published by Liang et al., who examined ADC signal intensity in LNs of patients suffering from head and neck cancer (26), substantiating the general nature of lower ADC signal in LN-metastases with an increased cellularity as compared to benign LNs. Moreover, an ADC cut-off of 1528 mm2/s could be proposed to exclude malignancy from LNs that are above the aforementioned threshold, which can potentially be valuable in clinical routine, not only when applied simultaneously in an integrated PET/MRI setting, but also as an additive sequential MR study to further classify LNs with equivocal findings in integrated 18F-FDG-PET/CT.
The present study has limitations, especially due to the relatively low number of histologically-proven LNs with consecutive PET and MRI findings within a period of two weeks prior to surgery. In order to increase the number of lesions and patients participating in the study, a prospective multicenter setting could potentially be of interest for future trials.
Furthermore, it is mandatory to check robustness of introduced findings against changes of MRI- and PET/CT-scanners, and findings should be re-evaluated in more heterogeneous patient populations, best performed in prospective multi-center-trials. The use of the dedicated MR protocol applied in the present study with sequential use of PET and MRI needs further validation within integrated PET/MRI examinations; moreover, its impact on preoperative tumor/node/metastasis (TNM) staging should be further evaluated, which could potentially improve the relatively poor results that have been published in previous PET/MRI studies regarding the aspect of clinical impact of integrated PET/MRI on TNM-staging in lung cancer patients (8-11, 27).
In conclusion, DWI MRI of mediastinal LNs in the context of sequential PET- and MRI-examinations or in the setting of integrated PET/MRI seems to be promising for non-invasive N-staging in lung cancer patients, especially when using the proposed threshold of 1528 mm2/s. This is clinically relevant in cases of equivocal PET findings, and can potentially help to guide later invasive LN sampling to high yield targets. Dynamic contrast-enhanced MRI needs further scientific evaluation before its integration into clinical routine.
