


1. Background
Magnetic resonance imaging (MRI) has been used as an optimal technique for evaluating articular cartilage (1, 2). It can provide information about cartilage damage and correlates closely with arthroscopic findings (3). MRI has greater sensitivity to cartilage and helps clarify cartilage damage (4). Thus, MRI has become a practical method for the diagnosis of osteochondral lesions of the talus (OLT) (5-7). It is common for OLT to be associated with ankle injury, residual ankle stiffness and pain after osteochondral injuries, and OLTs are most common in the dome of the talus. Before choosing the appropriate therapy based on diagnosis, it is necessary to determine if the OLT is a stabile lesion or not. Stabile fragments that are not cystic in early stage lesions always merit conservative therapy. Both cartilaginous defects with fluid around the attached cartilage fragment and unattached fragments that are detected by MR usually require arthroscopy (8). In the classification of cartilage injury, radiologists depend on the integrity of the articular cartilage and the condition of the subchondral bone in several different situations. There is hope that imaging could resolve the cartilage and local edema of subchondral bone clearly enough to make the correct diagnosis and prescribe the appropriate treatment. However, diagnosis of articular cartilage lesions of the talus can be challenging. It is very hard to distinguish certain small structural characteristics of OLTs, especially with some alternative coil (knee joint coil, flexibility coil) imaging techniques.
Small field-of-view (FOV) surface coil imaging can provide a good view of articular cartilage and can help in evaluating its stability and classification. However, the use of BLADE is recommended in some joint imaging since it can improve image quality and reduce artifacts (9).
2. Objectives
In this study, our goal is to use the BLADE sequence with a small FOV surface coil for imaging. The objective of this study is to more accurately classify injured cartilage through improved imaging techniques.
3. Patients and Methods
3.1. Patient Enrollment
Approval for this study was obtained from the review board and ethics committee of our institution, and all enrolled patients provided written informed consent. A prospective study was conducted to probe the diagnostic accuracy of the two MR scanning methods. Inclusion criteria: (1) All patients had ankle pain for more than 6 weeks and normal X-ray and were ready for diagnosis by arthroscopy and treatment following MR examination (10); (2) All the MRI examinations were performed 180 days or less, prior to ankle arthroscopic treatment; (3) All consecutive patients who received a 1.5T MRI exam of the ankle and underwent subsequent ankle arthroscopic treatment, by a single surgeon, were included in this study. Exclusion criteria: MR imaging localization of patients was not standard with obvious deviation or the image blur caused by motion would make it difficult to analyze the osteochondral structure. From January 2017 to February 2018, a total of 101 patients (53 males, 48 females; mean age, 45 years; range, 18 - 69 years) were enrolled in this study. All of 101 patients, the mean interval time between the MRI and arthroscopy was 2.6 (range, 0.2 to 5.7) months.
3.2. MRI Examination
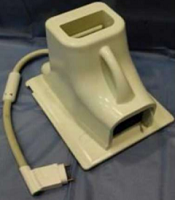
All MR examinations were performed on a 1.5-T whole-body MRI scanner (Magnetom Avanto, Siemens Medical Solutions, Germany). The two MR scanning methods were: (a) Proton-density fat-saturation with conventional Cartesian PDFS sequences using a routine FOV boot coil (“boot coil”, Suzhou Medcoil Healthcare, China, Figure 1A). The following parameters were applied: repetition time (TR)/echo time (TE) = 3500/45 ms; FOV: 220 × 220 mm; slice thickness, 3 mm; inter-slice gap, 0.3 mm. The actual spatial resolution was approximately 0.6 mm2. (b) Proton-density fat-saturation with BLADE (PDFS BLADE) sequences using a commercially available 4-cm circular polarized receiver surface coil (“finger coil”, Siemens Medical Solutions, Germany, Figure 1B). The small FOV coil was taped over the lateral or medial aspect of the ankle overlying the site of the OLT. Parameters applied for small FOV imaging were as follows: TR/TE = 3500/45 ms; FOV: 100 × 100 mm; slice thickness, 2 to 3 mm; inter-slice gap, 0.2 to 0.3 mm. The actual spatial resolution was approximately 0.3 mm2. A coronal MR imaging was necessary and the sagittal plane could be used as supplementary imaging. Small FOV coil imaging with a BLADE sequence was performed after boot coil imaging in all patients.
 surface coil. It is commercially available from Siemens Medical Solutions, Germany.")
A, A boot-shaped coil. It is commercially available from Suzhou Medcoil Healthcare China. B, A 4-cm small field of view (FOV) surface coil. It is commercially available from Siemens Medical Solutions, Germany.
3.3. Study Design and Articular Cartilage Analysis
All MRI exams were evaluated side-by-side by the two radiologists (reader 1 with 14 years and reader 2 with 11 years of experience in musculoskeletal radiology) and a consensus reached in all cases (when they encountered controversial cases, the two radiologists reached a consensus through consultation) that eliminated any potential inter-observer variability. Both radiologists were blinded to the results of the arthroscopic findings. These OLTs were evaluated and classified based on MRI by applying the Berndt and Harty classification: I, subchondral compression fracture with intact overlying articular cartilage; IIA, subchondral cyst; IIB, partially detached osteochondral fragment; III, the osteochondral fragment is completely detached but is not displaced; IV, the osteochondral fragment is detached and displaced. One of these two radiologists (reader 1) repeated this grading assessment two weeks later to determine intra-observer variation.
All arthroscopic examinations were performed by a single orthopedic surgeon. The arthroscopic results were graded using the following criteria: A, smooth and intact but soft and ballotable cartilage; B, rough surfaces; C, fibrillations or fissures; D, flap present or bone exposed; E, loose, undisplaced fragment; F, displaced fragment (11).
Arthroscopic results were regarded as the gold standard for assessing OLTs in this study. Classification results from two MR methods were compared with the conclusions of arthroscopic examinations. The corresponding relationship between MR and arthroscopic results was described with the following criteria: (1) arthroscopic grade A = MR grade I; (2) arthroscopic grade B and C = MR grade IIA; (3) arthroscopic grade D = MR grade IIB; (4) arthroscopic grade E = MR grade III (5) arthroscopic grade F = MR grade IV.
The entire process is as shown in the flowchart (Figure 2).

Flowchart of patients’ enrollment
3.4. Statistical Analysis
All data were analyzed using IBM SPSS Statistics for Windows, version 24.0 Released 2016 (SPSS Inc., Chicago, Ill., USA). A level of P < 0.05 was considered statistically significant. Weighted kappa coefficient was computed to compare the degree of agreement of each MRI method with gold standard. Values from 0.0 to 0.19 indicate slight agreement, 0.20 to 0.39 indicate fair agreement, 0.40 to 0.59 indicate moderate agreement, 0.60 to 0.79 indicate substantial agreement, and 0.80 to 1.0 indicate almost perfect or perfect agreement. For the overall samples and classified samples, Mc Nemar’s was performed to test the differences between the two methods in the diagnostic accuracy rate, sensitivity and specificity.
The arthroscopic grading represents the increasing severity of OLTs from normal, grade A to grade F, so we handled this matter by dichotomization of the grades in both arthroscopy and MRI in five different situations. The first step towards performing the case study was to combine grade B and C arthroscopy. These dichotomizations for arthroscopy will be normal vs. grades A - F, normal and grade A vs. grades B - F, normal and grades A - C vs. grades D - F, normal and grades A - D vs. grades E - F and normal and grades A - E vs. grade F. Their corresponding MRI dichotomizations will be normal vs. grades I - IV, normal and grade I vs. grades IIA - IV, normal and grades I - IIA vs. grades IIB - IV, normal and grades I - IIB vs. grades III - IV and normal and grades I - III vs. grade IV. In each dichotomization, we constructed the 2 × 2 cross tables and calculated all diagnostic indices with 95% confidence intervals.
4. Results
The results of arthroscopy (101 patients): 57 patients with cartilaginous injury and 44 patients without cartilaginous injury, there were eight cases of arthroscopic grade A, 14 of grade B = 8 and C = 6, 20 of grade D, 10 of grade E, and 5 of grade F. For small FOV surface coil PDFS BLADE, among the 57 patients with OLTs, 48 patients had the same grade for both MRI and arthroscopy, 43 patients were correctly diagnosed without OLTs (total 44 patients without OLTs). For routine FOV boot coil PDFS, among the 57 cases, 37 lesions had the same grade for both MRI and arthroscopy, 39 patients were correctly diagnosed without OLTs (total 44 patients without OLTs). The results of weighted Kappa were 0.803 (95% confidence interval [CI] = 0 - 0.35) between small FOV and arthroscopy, 0.515 (95% CI = 0 - 0.36) between routine FOV and arthroscopy.
First, the overall sample was estimated. The diagnosis accuracy of small FOV BLADE (90.10%, 91/101, 95% CI = 0.842 - 0.960) was higher than routine FOV (75.25%, 76/101, 95% CI = 0.667 - 0.838). Mc Nemar’s test revealed a statistically significant difference (P < 0.001, 95% CI = 3.93 - 14.69) in the diagnosis accuracy between two methods. Sensitivity and specificity of small FOV with BLADE were higher than routine FOV. According to arthroscopic findings, sensitivity and specificity of small FOV BLADE was 84.21% (95% CI = 0.72 - 0.92), and 97.73% (95% CI = 0.86 - 0.99) and routine FOV was 64.91% (95% CI = 0.51 - 0.77), and 88.64% (95% CI = 0.75 - 0.96), respectively. The results of the Mc Nemar’s test showed significant differences in the sensitivity (P < 0.001, 95% CI = 1.98 - 8.52) and specificity (P < 0.001, 95% CI = 5.36 - 283.87) between the two methods.
Second, arthroscopic results were gold standard in this study. The corresponding relationship between MR and ankle arthroscopy showed the summarized results. The results of the 49 positive cases from small FOV method: there were six cases of MR grade I, 10 of grade IIA, 18 of grade IIB, 10 of grade III, four of grade IV and one false positive. The 42 positive cases from routine FOV method: there were three cases of MR grade I, nine of grade IIA, 13 of grade IIB, eight of grade III, four of grade IV and five false positive. These calculated diagnostic indices of small FOV BLADE and routine FOV with gold standard were chosen based on the diagnostic indices regarding sensitivity (Sen), specificity (Spec), positive predictive value (PPV), negative predictive value (NPV), positive likelihood ratio (PLR), negative likelihood ratio (NLR), and accuracy. For 57 patients with cartilaginous injury, the results for classifications of arthroscopy and MRI in five different dichotomizations have been described in Table 1.
| i (SF) | i (RF) | ii (SF) | ii (RF) | iii (SF) | iii (RF) | iv (SF) | iv (RF) | v (SF) | v (RF) | |
|---|---|---|---|---|---|---|---|---|---|---|
| Sen (95% CI) | 0.98 (0.86 - 0.99) | 0.89 (0.75 - 0.96) | 0.94 (0.83 - 0.98) | 0.81 (0.67 - 0.90) | 0.89 (0.79 - 0.95) | 0.77 (0.65 - 0.86) | 0.90 (0.81 - 0.95) | 0.74 (0.64 - 0.83) | 0.91 (0.83 - 0.95) | 0.75 (0.65 - 0.83) |
| Spec (95% CI) | 0.84 (0.72 - 0.92) | 0.65 (0.51 - 0.77) | 0.98 (0.88 - 0.99) | 0.92 (0.80 - 0.97) | 0.91 (0.76 - 0.98) | 0.91 (0.76 - 0.98) | 0.60 (0.33 - 0.83) | 0.80 (0.51 - 0.95) | 0.80 (0.30 - 0.99) | 0.80 (0.30 - 0.99) |
| PPV (95%CI) | 0.83 (0.69 - 0.91) | 0.66 (0.53 - 0.78) | 0.98 (0.88 - 0.99) | 0.91 (0.78 - 0.97) | 0.95 (0.86 - 0.99) | 0.94 (0.84 - 0.99) | 0.93 (0.84 - 0.97) | 0.96 (0.87 - 0.99) | 0.99 (0.93 - 0.99) | 0.99 (0.92 - 0.99) |
| NPV(95% CI) | 0.98 (0.88 - 0.99) | 0.88 (0.74 - 0.96) | 0.94 (0.83 - 0.98) | 0.82 (0.69 - 0.90) | 0.82 (0.66 - 0.92) | 0.68 (0.53 - 0.80) | 0.50 (0.27 - 0.73) | 0.35 (0.20 - 0.54) | 0.31 (0.10 - 0.61) | 0.14 (0.05 - 0.34) |
| PLR (95%CI) | 6.19 (3.39 - 11.29) | 2.53 (1.75 - 3.65) | 46. 2 (6.63 - 321.64) | 9.89 (3.83 - 25.54) | 10.43 (3.52 - 30.87) | 9.02 (3.03 - 26.81) | 2.24 (1.20 - 4.18) | 3.72 (1.34 - 10.32) | 4.53 (0.78 - 26.19) | 3.75 (0.65 - 21.73) |
| NLR (95% CI) | 0.03 (0.004 - 0.19) | 0.18 (0.08 - 0.41) | 0.06 (0.02 - 0.18) | 0.21 (0.12 - 0.37) | 0.12 (0.06 - 0.23) | 0.25 (0.16 - 0.39) | 0.17 (0.09 - 0.35) | 0.32 (0.22 - 0.47) | 0.12 (0.06 - 0.24) | 0.31 (0.20 - 0.49) |
| Accuracy (95% CI) | 0.90 (0.84 - 0.96) | 0.75 (0.67 - 0.84) | 0.96 (0.92 - 0.99) | 0.86 (0.79 - 0.93) | 0.90 (0.84 - 0.96) | 0.82 (0.75 - 0.90) | 0.85 (0.78 - 0.92) | 0.75 (0.67 - 0.84) | 0.90 (0.84 - 0.96) | 0.75 (0.67 - 0.84) |
Diagnostic Indices of Small FOV and Routine FOVa
5. Discussion
The thickness of articular cartilage on the dome of talus has been demonstrated to be only 0.4 to 2.1 mm (12). In the absence of sufficient joint fluid, the cartilage closely approximates the distal tibial articular cartilage (13), making it very difficult to make a precise evaluation using MRI (11, 14). Subchondral trabecular compression on the talar dome is difficult to detect when the compression amplitude is slight. Marrow edema and subchondral cysts show an equal or high signal intensity beneath lesions on proton density (PD)-weighted images. This makes MRI evaluation more challenging, especially in distinguishing between MR grade I and grade IIA (Figure 3). Small FOV imaging helps optimize resolution of the talar dome articular cartilage, providing a better signal-to-noise ratio even at 1.5T MRI than standard MRI at 3T (15, 16).
. B, Routine FOV PDFS image shows the osteochondral lesion of the talus (OLT) with several small areas of cystic edema in less detail, and the cartilage of talar dome is blurry. It is classified as MR grade IIA.")
A, The extent of edema and the morphology of cartilage in the talar dome can be visualized on the small FOV PDFS BLADE image (MR grade I). B, Routine FOV PDFS image shows the osteochondral lesion of the talus (OLT) with several small areas of cystic edema in less detail, and the cartilage of talar dome is blurry. It is classified as MR grade IIA.
This study may be the first to date to apply the BLADE sequence with a small FOV coil in ankles with talar dome osteochondral lesions. The results of this study indicate that the small FOV surface coil BLADE sequence showed the cartilage better than a routine FOV boot coil sequence (Figure 4). There are several reasons for the differences between the two techniques, and the first is due to the effects of different coils. A small FOV coil was closely fixed to the location of cartilage injury with tape. This allows for more effective imaging due to reduced distance and signal loss. The design of the boot coil was in accordance with the anatomical structure of the ankle. However, considering individual differences, there must be a certain distance between the joint surface and the coil, resulting in reduced signal strength. The second reason is the difference in FOV. The difference in spatial resolution is easily visible. The actual spatial resolution was higher (0.3 mm2) in small FOV sequences than in routine FOV sequences (0.6 mm2). In addition to the approximately two-fold improvement in spatial resolution, Antonio et al. (16) reported that use of a small FOV coil significantly enhanced the MR signal to approximately double within the focus region compared to that for extremity coil imaging. The third factor is the application of the BLADE technique. The conventional k-space trajectory is a Cartesian pattern; the collected data is filled into the k-space line-by-line. BLADE is the product name of the Siemens Medical System (Erlangen, Germany) turbo-spin echo (TSE) sequence that uses the periodically‐rotated overlapping parallel lines with enhanced reconstruction (PROPELLER) k-space trajectory. The BLADE method acquires many blades that are rotated around the center of the k-space. Each blade is composed of many of the lowest-phase encoding lines of a conventional rectangular k-space trajectory that are acquired after a single radio frequency excitation (17). The central region of k-space is repeatedly filled with the rotating rectangular data matrix. In theory, the main role of the central region of k-space is to determine the image contrast, so we have reason to believe that image contrast is clearly improved because of the multiple data fillings in the central region of k-space. Based on our results, it was found that BLADE sequences improved image contrast in all cases, although the general role of the BLADE sequence was to eliminate motion artifacts. Compared with the conventional sequence, the visualization of joint fluid with the BLADE sequence showed higher signal intensity. Therefore, we had better contrast between joint fluid and cartilage, so implementation of the BLADE sequence improved diagnostic accuracy in our study (Figure 5).
. B, Routine FOV PDFS image shows equal or high signal edema, but the cartilage surface is unclear (MR grade I).")
A, On the small FOV PDFS BLADE image, the partial cartilage rupture of the talar dome is seen with the marrow edema and slight pitting of the subchondral bone (MR grade IIB). B, Routine FOV PDFS image shows equal or high signal edema, but the cartilage surface is unclear (MR grade I).
 (A), which is not clearly shown (MR grade IIA) on the routine FOV PDFS image (B). Improved contrast between cartilage and joint fluid with the bright signal makes it easy to assess the osteochondral lesion of the talus (OLT) situation on the small FOV BLADE image.")
The small FOV PDFS BLADE image clearly shows a partially isolated cartilage of talar dome (MR grade IIB) (A), which is not clearly shown (MR grade IIA) on the routine FOV PDFS image (B). Improved contrast between cartilage and joint fluid with the bright signal makes it easy to assess the osteochondral lesion of the talus (OLT) situation on the small FOV BLADE image.
Comparing the results with similar studies, our test results indicated that there were obvious improvements in all the accuracies, sensitivities and most of the specificities by using the small FOV BLADE sequence. In a study conducted by Lee et al., they could increase the joint space width with traction in small FOV coil. Although this method can improve the cartilage surface visibility of talar dome, the risk is still potential (15). The results of some published studies show that MRI has the ability to display osteochondral lesions of the talus with accuracies ranging from 65.9% to 83.0% (18-20). In this study, we came to the following conclusions: the total rate of correct classification was relatively high (90.1%) in the small FOV BLADE sequence group and relatively low (75.25%) in the routine FOV sequence group. Study results show that the small FOV has good performance on the sensitivity and specificity. The small FOV for an overall sensitivity and specificity were higher than the findings (sensitivity 84.21%, specificity 97.73%) by Gatlin et al. The difference could be due to the fact that the lesions were only grades III and IV in their report (21). Bauer and colleagues also investigated the use of MRI in the detection of cartilage lesions of the ankle. Their results show that sensitivity (71%) and specificity (> 95%) were different from our study. The major reasons for the differences may be because the lesions were artificially manufactured in a cadaver model (22).
The main limitation of the current study is that first, the difference in accuracy is caused by spatial resolution, different coils and BLADE sequence together. However, we did not analyze the influence degree of each single factor to the final outcome, we just discovered the differences between two methods of imaging. Second, the corresponding relationship between MR classification (the Berndt and Harty) and the arthroscopic results are not absolutely matched, only a relatively reasonable choice that has been used in a professional paper (18). Third, patients with mild cartilage injuries rarely undergo arthroscopy. For MR grade I osteochondral lesions, the small FOV BLADE sequence was great for improving the accuracy rate, but only a small number of patients were included in our study, and no significant differences could be detected between the two methods.
In conclusion, small FOV BLADE sequence grading of osteochondral lesions in the talus was useful and had a promising accuracy rate with respect to arthroscopic classification.
