


1. Background
Thyroid nodules occur frequently in the general population. The incidence of thyroid cancer has increased steeply in recent years. Papillary thyroid carcinoma (PTC) is the most common type of thyroid cancer in the general population, and develops in approximately 80% to 85 % of all thyroid cancers (1). A papillary thyroid microcarcinoma (PTMC) is a PTC with a maximum diameter of 1 cm. Most patients with PTMC may be observed safely. Nevertheless, some PTMC cases have aggressive behavior, such as cervical lymph node metastasis and extrathyroid invasion (2). In recent years, the incidence of PTC has increased primarily due to an increase in the PTMC cases (3).
The American Thyroid Association (ATA) guidelines recommend against performing US-guided fine needle aspiration or core-needle biopsy for PTMC, as long as the nodules are confined to the thyroid (3, 4). Conventional ultrasonography (US) is the most sensitive test to detect thyroid nodules, reveal lymph-node metastases and select the lesions for fine-needle aspiration (FNA) biopsy (5). Sonography showed that malignany lesions have solid composition, hypoechogenicity, microcalcification, irregular margins, taller than wide shape, and increased blood flow (centrally) on a transverse view. However, PTMC may have the characteristics of different types of lesions, usually leading to preoperative ultrasound diagnosis (6). Therefore, new diagnostic methods need to be developed.
In predicting malignant thyroid nodules, a combination of several suspicious ultrasound features is more accurate than any single feature. The Korean Thyroid Imaging Reporting and Data System (TI-RADS) is a feature of two-dimensional ultrasound based on thyroid nodules. It was first used by Kwak et al. (7), and it described five US features of thyroid nodules including solid nodules, hypoechoic, irregular boundaries, microcalcification, and aspect ratio > 1. Due to the simple operation of TI-RADS, several recent studies reported that it improves the accuracy of differential diagnosis of benign and malignant thyroid nodules (8, 9).
Recently, the value of contrast-enhanced ultrasound (CEUS) in the diagnosis of tumors is attracting more and more attention (10). In particular, the introduction of CEUS as a promising tool can clearly define the microvascular flow pattern in small carcinoma nodules, and it was reported to improve the identification of malignant nodules (11).
2. Objectives
In this study, we aimed to evaluate whether the TI-RADS classification criteria, either alone or in combination with CEUS, could be of any value in predicting PTCM.
3. Patients and Methods
3.1. Patients
Between February 2015 and September 2017, 143 patients (32 male, and 111 female) who had a total of 150 micro space-occupying lesions of the thyroid and were treated at our hospital were included in this retrospective study. The histologic types of the thyroid nodules were confirmed by fine-needle aspiration or surgery (4). The mean ± standard deviation [SD] age of the 143 patients was 45.4 ± 10.8 years (range, 21 - 64 years). The study was conducted according with the protocols proposed by the Ethics Committee of our hospital.
The inclusion criteria were lesions with a maximum diameter of 10 mm. The exclusion criteria were (1) dominantly cystic nodules, (2) clinically apparent multicentricity, (3) allergy to sulfur hexafluoride microbubbles (SonoVue) or coagulation disorder, and (4) pregnancy.
3.2. Conventional US /CEUS Examination and Image Analysis
A conventional US scan using a 4 - 15 MHz liner transducer GE Logiq E9 (GE Healthcare, Chalfont St. Giles, United Kingdom) was performed by one of four radiologists. Interpretation of the US features of all thyroid lesions was recorded. According to a previous study (7), we assessed the following US features of thyroid nodules: composition (solid or mixed), margin (clear, unclear), echogenicity (hypoechogenic, isoechogenic, or hyperechogenic), aspect ratio (wider-than-tall or taller-than-wide), calcification (no calcification, microcalcification, and coarse calcification) and blood flow (absent or low flow, high flow). Microcalcification was defined as hyperechoic spots less than 2 mm, and coarse calcification was defined as hyperechoic spots larger than 2 mm. Thyroid nodules with no, 1, 2, 3, 4, or 5 suspicious US features were classified as TI-RADS category 3, 4a, 4b, 4c, or 5, respectively (Table 1) (12). FNA for nodules benign at first cytology scored as TI-RADS 4 and 5 due to the risk of malignancy in this group. However, some patients with TI-RADS 3 urged for invasive assessments because of excessive worry.
| Scoring system and category | US characteristics | Malignancy risk, % | Recommendations |
|---|---|---|---|
| 3 | No suspicious US features | 2.0 ~ 2.8 | Follow-up |
| 4a | One suspicious US features | 3.6 ~ 12.7 | FNA |
| 4b | Two suspicious US features | 6.8 ~ 37.8 | FNA |
| 4c | Three or four suspicious US features | 21.0 ~ 91.9 | FNA |
| 5 | Five suspicious US features including solid, irregular margin, markedly hypoechoic, microcalcifications and aspect ratio > 1 | 88.7 ~ 97.9 | FNA |
Korean Version of TI-RADS Categories (7)
Following conventional US evaluation, CEUS examination was performed with a 3 - 9 MHz liner transducer (depending on the depth of exploration and the location of the scan) by a radiologist with 10 years of experience in CEUS. A sulfur hexafluoride microbubble contrast medium SonoVue (2.4 mL, BR1; Bracco SpA, Milan, Italy) bolus was quickly pushed into the peripheral vein with a probe, followed by injection of normal saline (5 mL), and the body position was unchanged. The timer on the US machine was started at the time of contrast medium injection. Each dynamic contrast imaging acquisition lasted at least 3 minutes. When CEUS was initiated, the imaging section was maintained unchanged for each patient (13). Dynamic contrast images underwent successive or frame-by-frame playback and the CEUS diagnostic criteria were divided into peak enhancement (hypo-enhancement, iso-enhancement and hyper-enhancement), homogeneity of enhancement (interior solid portion of target nodules, classified as homogeneous or heterogeneous) and rim-like enhancement (14). For obtaining degrees of echo and enhancement of nodules, CEUS findings were compared with adjacent muscles or normal thyroid parenchyma. It was defined as hypo-enhancement when the nodule echogenicity was lower than that of the adjacent muscles or normal thyroid parenchyma. It was defined as hyper-enhancement when the nodule echogenicity was higher than that of adjacent muscles or normal thyroid parenchyma.
The malignant thyroid nodules were diagnosed based on inhomogeneous low enhancement in nodule tissues. The diagnostic criteria for benign thyroid nodules were the opposite of malignancy, including high enhancement or equal enhancement, and presence of rim-like enhancement in nodule tissues (14).
The diagnostic criteria of CEUS + TI-RADS: if CEUS showed high enhancement or rim-like enhancement, 1 point was subtracted from TI-RADS score. If CEUS showed low enhancement, 1 point was added from TI-RADS score and score 5 was kept unchanged. If CEUS showed equal enhancement, the TI-RADS score remained unchanged.
3.3. Statistical Analysis
Statistical analyses were performed with SPSS for Windows version 16.0 software (SPSS Inc. Released 2007. SPSS for Windows, Version 16.0. Chicago, SPSS Inc.). All values are expressed as mean ± standard error. The comparison of US indicators for benign nodule and PTMC was assessed using the chi-square test. The diagnostic value of the benign nodule and PTMC diagnoses by TI-RADS, CEUS and combined method were compared by McNemar test. The receiver operating characteristic (ROC) curve analysis was used to compare the diagnostic differences between TI-RADS, CEUS, and the combination of CEUS and TI-RADS in predicting PTMC. A logistic regression modeling was performed to assess the diagnostic performance of the diagnostic performance of the thyroid malignant nodules. The statistical significance threshold was set at 5%.
4. Results
4.1. Demographic and Clinicopathologic Characteristics
As shown in Table 2, among the 150 micro space occupying lesions of thyroid, 67 were PTMC and 83 were benign nodules. We initially evaluated the role of gender, age, size of the lesion, and ultrasound features in predicting malignancy. A significant difference was detected in the margin (P < 0.001), echogenicity (P < 0.001), aspect ratio (P = 0.008), calcification (P < 0.001), blood flow (P < 0.001), enhancement intensity (P < 0.001) and rim-like enhancement (P < 0.001) between the two groups (P < 0.05) (Table 2).
| Features | Benign (n = 83) | PTMC (n = 67) | P value |
|---|---|---|---|
| Sex | 0.211 | ||
| Female (n = 111) | 59 (53.15) | 52 (46.85) | |
| Male (n = 32) | 21 (65.63) | 11 (34.37) | |
| Age, y | 44.56 ± 9.67 | 46.29 ± 11.44 | 0.094 |
| Diameter, mm | 7.23 ±1.52 | 7.81 ± 1.70 | 0.141 |
| Composition | 0.835 | ||
| Solid | 68 (81.93) | 54 (80.60) | |
| Mixed | 15 (18.07) | 13 (19.40) | |
| Margin | < 0.001 | ||
| Clear | 60 (72.29) | 24 (35.82) | |
| Unclear | 23 (27.71) | 43 (64.18) | |
| Echogenicity | < 0.001 | ||
| Hypoechogenic | 39 (46.99) | 51 (76.12) | |
| Isoechogenic | 30 (36.14) | 4 (5.97) | |
| Hyperechogenic | 14 (16.87) | 12 (17.91) | |
| Aspect ratio | 0.008 | ||
| Wider-than-tall | 16 (19.28) | 26 (38.81) | |
| Taller-than-wide | 67 (80.72) | 41 (61.19) | |
| Calcification | < 0.001 | ||
| None | 74 (89.16) | 28 (41.79) | |
| Microcalcification large | 6 (7.23) | 32 (47.76) | |
| Coarse calcification | 3 (3.61) | 7 (10.45) | |
| Blood flow | < 0.001 | ||
| Absent or low | 66 (79.52) | 21 (31.34) | |
| high | 17 (20.48) | 46 (68.66) | |
| Enhancement intensity | < 0.001 | ||
| Hypo-enhancement | 6 (7.23) | 54 (80.60) | |
| Iso-enhancement | 41 (49.40) | 10 (14.93) | |
| Hyper-enhancement | 36 (43.37) | 3 (4.47) | |
| Rim-like enhancement | < 0.001 | ||
| None | 7 (8.43) | 50 (74.63) | |
| Hyper-enhancement | 70 (84.34) | 3 (4.48) | |
| Hypo-enhancement | 6 (7.23) | 14 (20.90) |
Clinical, US and CEUS Features of PTMC and Benign Nodulesa
4.2. TI-RADS Results
Based on the international accepted TI-RADS classification, 32, 30, 22, 55, and 11 recruited nodules were in levels 3, 4a, 4b, 4c and 5, respectively. The malignancy rates of TI-RADS score 3, score 4a, score 4b, score 4c, score 5 were 2.6, 9.7, 61.5, 86.8, and 87.5%, respectively. There was a positive correlation between TI-RADS score and risk of PTMC (P < 0.001) (Table 3).
| TI-RADS | Number of nodules | Pathological results | Malignancy rate, % | P value | |
|---|---|---|---|---|---|
| Benign (n = 83) | PTMC (n = 67) | ||||
| 3 | 39 | 38 | 1 | 2.6 | < 0.001 |
| 4a | 31 | 28 | 3 | 9.7 | |
| 4b | 26 | 10 | 16 | 61.5 | |
| 4c | 38 | 5 | 33 | 86.8 | |
| 5 | 16 | 2 | 14 | 87.5 | |
Malignancy Rate According to TI-RADS of 150 Micro Space Occupying Lesions of Thyroid
4.3. Accuracy of PTMC Diagnoses by CEUS + TI-RADS
The PTMC classified as 4a and below diagnoses by CEUS + TI-RADS combination was lower than TI-RADS alone, whereas the PTMC classified as 4b and above was increased (Table 4). The ROC curves demonstrated that the best cutoff of TI-RADS and CEUS were TI-RADS 4b and hypo-enhancement, respectively. The TI-RADS + CEUS combination had the highest area under the curve (AUC) (0.93), accuracy (95.10%), sensitivity (96.74%), specificity (94.83%), positive predictive value (PPV) (87.92%) and negative predictive value (NPV) (98.02%), significantly greater than that of TI-RADS alone (AUC: 0.930 vs. 0.873, P < 0.001; accuracy: 95.10% vs. 89.78%, P = 0.032; sensitivity: 96.74% vs. 86.05%, P = 0.041; PPV: 87.92% vs. 76.47%, P = 0.029) and CEUS alone (AUC: 0.930 vs. 0.857, P < 0.001; accuracy: 95.10% vs. 86.93%, P < 0.001; NPV: 98.02% vs. 90.83%, P = 0.047) (Table 5) (Figures 1 - 4).
| TI-RADS + CEUS | Number of nodules | Pathological results | Malignancy rate, % | |
|---|---|---|---|---|
| Benign (n = 83) | PTMC (n = 67) | |||
| 3 | 22 | 22 | 0 | 0 |
| 4a | 41 | 39 | 2 | 4.9 |
| 4b | 30 | 16 | 14 | 46.7 |
| 4c | 47 | 5 | 42 | 89.4 |
| 5 | 10 | 1 | 9 | 90.0 |
Malignancy Rate According to TI-RADS Combined with CEUS of 150 Micro Space Occupying Lesions of Thyroid
| Imaging method | Cut-off | AUC | Sensitivity, % | Specificity, % | PPV, % | NPV, % | Accuracy, % |
|---|---|---|---|---|---|---|---|
| TI-RADS | ≥ 4b | 0.873 | 86.05 | 87.43 | 76.47 | 93.44 | 89.78 |
| CEUS | Hypo-enhancement | 0.857 | 81.47 | 89.33 | 80.89 | 90.83 | 86.93 |
| TI-RADS+CEUS | ≥ 4b + hypo-enhancement | 0.930 | 96.74 | 94.83 | 87.92 | 98.02 | 95.10 |
Diagnostic Efficacy Indices of TI-RADS, CEUS and Their Combination for Diagnosis of PTMC
 curves for contrast-enhanced ultrasound (CEUS), thyroid imaging reporting and data system (TI-RADS) and CEUS + TI-RADS in the diagnosis of papillary thyroid microcarcinoma (PTMC)")
Receiver operating characteristic (ROC) curves for contrast-enhanced ultrasound (CEUS), thyroid imaging reporting and data system (TI-RADS) and CEUS + TI-RADS in the diagnosis of papillary thyroid microcarcinoma (PTMC)
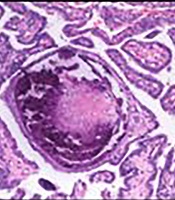
 found no malignant indicator in the lesion, and it was classified as a TI-RDAS score of 3 (TI-RADS: thyroid imaging reporting and data system). B, A contrast-enhanced ultrasound (CEUS) indicated iso-enhancement. The improved TI-RADS combined with CEUS returned a score of 3. C, The pathological image of the lesion, which was a nodular goitre.")
A 36-year-old woman with a 0.5 × 0.3 cm micro space occupying lesion in the left lobe of the thyroid. A, Ultrasonography (US) found no malignant indicator in the lesion, and it was classified as a TI-RDAS score of 3 (TI-RADS: thyroid imaging reporting and data system). B, A contrast-enhanced ultrasound (CEUS) indicated iso-enhancement. The improved TI-RADS combined with CEUS returned a score of 3. C, The pathological image of the lesion, which was a nodular goitre.
 found one malignant indicators (microcalcifications), and it was classified as a TI-RDAS score of 4a (TI-RADS: thyroid imaging reporting and data system). B, A contrast-enhanced ultrasound (CEUS) indicated low enhancement. The improved TI-RADS combined with CEUS returned a score of 4b. C, The pathological image of the lesion, which was a papillary thyroid microcarcinoma (PTMC).")
A 53-year-old woman with a 0.9 × 0.5 cm micro-space occupying lesion in the right lobe of the thyroid. A, Ultrasonography (US) found one malignant indicators (microcalcifications), and it was classified as a TI-RDAS score of 4a (TI-RADS: thyroid imaging reporting and data system). B, A contrast-enhanced ultrasound (CEUS) indicated low enhancement. The improved TI-RADS combined with CEUS returned a score of 4b. C, The pathological image of the lesion, which was a papillary thyroid microcarcinoma (PTMC).
 found two malignant indicators (irregular margin and microcalcifications), and it was classified as a TI-RDAS score of 4b (TI-RADS: thyroid imaging reporting and data system). B, A contrast-enhanced ultrasound (CEUS) indicated hyper-enhancement. The improved TI-RADS combined with CEUS returned a score of 4a. C, The pathological image of the lesion, which was a nodular goitre.")
A 39-year-old woman with a 1.0 × 0.8 cm micro space occupying lesion in the left lobe of the thyroid. A, Ultrasonography (US) found two malignant indicators (irregular margin and microcalcifications), and it was classified as a TI-RDAS score of 4b (TI-RADS: thyroid imaging reporting and data system). B, A contrast-enhanced ultrasound (CEUS) indicated hyper-enhancement. The improved TI-RADS combined with CEUS returned a score of 4a. C, The pathological image of the lesion, which was a nodular goitre.
4.4. Logistic Regression Analysis
Binary logistic regression analysis showed that obscure margin (odds ratio [OR] = 1.362; 95% confidence interval [CI]: 0.228 - 2.482; P = 0.030), calcification (OR = 1.769; 95%CI: 0.598 - 2.884; P = 0.015), hypoechogenicity (OR = 2.109; 95%CI: 1.051 - 3.169; P = 0.008), hypo-enhancement (OR = 2.578; 95%CI: 1.528 - 3.580; P = 0.005), and rim-like enhancement (OR = 2.633; 95%CI: 0.814 - 4.507; P = 0.002) were significant predictives for PTMC. Subsequently, we analyzed the above data using multivariate stepwise logistic regression, and found that calcification (OR = 1.586; 95%CI: 1.037 - 2.311; P = 0.027), hypoechogenicity (OR = 1.432; 95%CI: 0.975 - 1.925; P = 0.035), and hypo-enhancement (OR = 2.140; 95%CI: 1.237 - 2.840; P = 0.019) were optimal predictors for PTMC (Table 6).
| Variables | Univariate analysis | Multivariate analysis | ||
|---|---|---|---|---|
| OR (95% CI) | P value | OR (95% CI) | P value | |
| Obscure margin | 1.362 (0.228 - 2.482) | 0.030 | 0.221 (0.005 - 0.674) | 0.248 |
| Calcification | 1.769 (0.598 - 2.884) | 0.015 | 1.586 (1.037 - 2.311) | 0.027 |
| Hypoechoic | 2.109 (1.051 - 3.169) | 0.008 | 1.432 (0.975 - 1.925) | 0.035 |
| Hypo-enhancement | 2.578 (1.528 - 3.580) | 0.005 | 2.140 (1.237 - 2.840) | 0.019 |
| Rim-like enhancement | 2.633 (0.814 - 4.507) | 0.002 | 0.951 (0.640 - 1.314) | 0.103 |
. Independent Predictors of PTMC of Combined Use of Conventional US and CEUS Based on Logistic Regression Analysis
5. Discussion
In China, the incidence of thyroid cancer has increased primarily due to an increase in PTMC cases (15). A similar trend was observed earlier in Japan due to the use of US examinations and FNA for the detection of malignant nodules (16). In recent years, the ATA have published guidelines for US risk stratifications of thyroid nodules. Xu et al. found that TI-RADS performed best for differentiating nodules less than 20 mm, with the sensitivity and sensitivity of 85.3% and 72.6%, respectively; while 2015 ATA guideline had best value in lesions larger than 20 mm, with the sensitivity and sensitivity of 89.8% and 70.8%, respectively indicating that TI-RADS was significantly superior to ATA patterns, especially in nodules less than 20 mm (4). Under US, TI-RADS has been suggested as a helpful criterion in the diagnosis of malignant nodules. The TI-RADS classification was primarily defined and evaluated in a study with 1097 nodules (7). Sensitivity, specificity, PPV, NPV of TI-RADS for the diagnosis of malignant thyroid nodules were 88%, 80%, 79%, and 88%, respectively. In addition to the US, CEUS has been introduced to study tissue microvascular perfusion more sensitively, and it has been reported to improve the identification of malignant focal liver lesions (17). Previous studies have also demonstrated the feasibility of CEUS in differentiating between benign and malignant thyroid nodules (18, 19). However, few reports have mentioned TI-RADS and CEUS factors to assess the PTMC (2). Thus, this study was to investigate whether improvements were made by using CEUS combined with TI-RADS to the diagnostic accuracy for PTMC.
US is the most sensitive test to detect thyroid nodules, reveal lymph-node metastases and select the lesions for fine-needle aspiration biopsy. In the present study, we confirmed that the following features such as margin, echogenicity, aspect ratio, calcification and blood flow showed significant difference between benign and PTMC. According to the TI-RADS based on each suspicious US feature, we found that the sensitivity of suspicious nodules < 1 cm in size was 86.05%. Thus, 13.95% of thyroid nodules less than 1 cm were finally confirmed as benign despite the presence of suspicious US features. Similar to our study, Bo et al. (3) build prediction models to assess the diagnostic value of TI-RADS, the malignancy probability of suspicious nodules < 1 cm in size ranged from 82.8% to 87.4% on various TI-RADS. A study by Ma found that ultrasound features are important predictors of PTMC, such as taller-than-wide shape, marked hypoechogenicity and poorly defined margin of the nodule, which is similar with the results of the present study (20). Our data demonstrated that the overall diagnostic performance of TI-RADS was a good US method, indicating that conventional US is still the most important US tool in evaluating PTMC (21).
In previous studies, researchers have demonstrated that, under CEUS, ring enhancement showed an accuracy of 88.5% for benign lesions, and heterogeneous enhancement showed an accuracy of 90.4% for malignant lesions (22). Li et al. (23) concluded that low, weak, or uneven enhancements are valuable perfusion features for evaluating papillary thyroid carcinoma but that a uniform, high-enhanced perfusion mode was typical of benign nodules. In the present study, we confirmed that the following features such as enhancement intensity and rim-like enhancement showed significant difference between benign and PTMC. The sensitivity (81.47% vs. 80.59%) and specificity (89.33% vs. 88.96%) of CEUS in our study were similar to that in the study from Chen et al. (24). In several PTMC nodules, a lack of enhancement and rapid wash-out time during the CEUS process was observed after SonoVue was administered. This may be attributed to the small size of the nodules (diameter, ≤ 5 mm), which fail to form the tumor vascular beds and arteriovenous fistulas required to provide sufficient blood supply to the papillary thyroid carcinoma (25). This phenomenon may be partly ascribed to the complexity of microcirculation in tumor, unskilled operation, and lack of accepted standards or guidelines (21).
Bartolotta et al. (26) found that CEUS for thyroid is a viable technique, but overlapping findings seem to limit its potential in characterizing thyroid nodules. Jebreel et al. (27) reported that Vascular endothelial growth factor (VEGF) immunostaining was stronger in thyroid cancer, thyroiditis and Graves’ disease than in adjacent normal thyroid tissues. Therefore, the differences in the microvessel density of benign and malignant nodules may not be evident when lesions < 1 cm in diameter (23). In the present study, 13 PTMC (8.7%) exhibited iso- or hyper-enhancement in the lesions and surrounding tissues. Among the 83 benign nodules, 6 nodules exhibited low or faint/weak enhancement. Thus, in contrast to the results of Bartolotta et al. (26), our study found that thyroid nodules less than 1 cm exhibit numerous overlapping features on CEUS.
To improve accuracy and reduce misdiagnoses and missed diagnoses, we have combined CEUS with TI-RADS to differentiate benign from PTMC. When TI-RADS and CEUS were combined together, obscure margin, calcification, hypoechoic, low enhancement, rim-like enhancement were independent predictors of PTMC on binary logistic regression analysis, which increased the accuracy (95.10%), sensitivity (96.74%), specificity (94.83%), PPV (87.92%) and NPV (98.02%), indicating that the 2 methods combination had the highest diagnostic accuracy. Our findings are consistent with a previous study, which found that CEUS and US were very effective in PTMC diagnosis. Furthermore, if the combined use of TI-RADS and CEUS cannot diagnose a certain nodule, a biopsy should be performed (28).
The present study included the following limitations. First, the patients in this study were selected for fine-needle aspiration or surgery; as such, selection bias might be present. Secondly, in subsequent studies, the sample size should be enlarged to allow for more accurate calculation of results. Moreover, due to the limited study time, only pathological benign and malignant tumors were studied in groups, and no TI-RADS classification was conducted. In addition, TI-RADS in combination with CEUS may be not cost benefit compared with FNA, but it could provide essential information on the characteristics of PTMC, which is essential for optimal clinical diagnosis and treatment.
In summary, we have demonstrated that TI-RADS in combination with CEUS has superior diagnostic efficiency in the discrimination of micro-thyroid space-occupying lesions, which can improve the diagnostic accuracy of PTMC. Furthermore, if the combined use of TI-RADS and CEUS cannot diagnose a certain nodule, a biopsy should be performed to prevent unnecessary active surveillance and patient anxiety.
