
.jpg)


1. Background
Breast cancer may result in remodeling of adjacent normal appearing breast tissues that facilitate local invasion or metastasis (1, 2). Tissues outside the primary tumor may play a critical role in tumorigenesis (3, 4). This earliest stage is characterized by increased angiogenesis, immune cell infiltrates, physiologic changes in PH and oxygen pressure, increased collagen deposition, and tissue stiffness (2). For characterization of this progressive stiffening, several imaging techniques have been proposed (1, 2). Moreover, achieving tumor-free margins and reducing the risk of local relapse are critical in conservative surgery (5, 6). Currently, histopathologic evaluation on resected tissue specimens plays this role (7). Therefore, providing more information about changes of peri-tumoral tissues and surgical scope using a non-invasive preoperative technique is highly important.
These days, magnetic resonance imaging (MRI) is increasingly used in the diagnosis and follow-up of breast cancer with a high sensitivity and a moderate specificity (8). Diffusion-weighted imaging (DWI), which is based on thermal motion of water molecules in the extracellular fluid, provides microstructural information and can detect molecular and structural changes of tissues (9). DWI provides quantitative measures as the apparent diffusion coefficient (ADC), which increases the specificity of the diagnostic technique (10). ADC changes inversely with tissue cellularity and stiffness, and a decrease in the ADC value relative to normal tissues appears to be due to malignant changes (11-14). There are only few studies about the ADC characteristic of peri-tumoral tissues, and it has been mentioned that peri-tumoral ADCs are different from normal tissues and are more intense in higher grade cancers with lymphovascular invasion, higher nuclear grade, negative ER, positive HER2, positive Ki67, and lymph node metastasis (2, 5, 15-17). The presence or absence of a prepectoral edema in T2 weighted imaging (T2WI) of breast cancer is significantly associated with prognostic factors including tumoral size, higher nuclear grade, axillary lymph node positivity, and presence of lymphovascular invasion (18).
2. Objectives
The goal of this study was to evaluate the subjective presence of peri-tumoral edema in T2WI and its relationship with tumoral ADCs, peri-tumoral ADCs, peri-tumoral-normal tissue ADC ratios, and tumor characteristics.
3. Patients and Methods
3.1. Study Population
In this cross-sectional study, 78 female patients with 89 breast cancer lesions (invasive and in situ) with the mean age of 47 ± 7.7 years were investigated between 2016 and 2018 by preoperative 1.5-T breast MRI. Our institutional ethics committee approved this study, and informed consent was obtained from all participants.
All breast cancers were confirmed by histopathologic evaluations of specimens collected from lumpectomy or mastectomy. The exclusion criteria were as follows: diagnostic intervention or chemotherapy before MRI examination, small size for visibility in ADC images, incomplete fat suppression and suboptimal DWI, lack of breast parenchyma surrounding tumors (we excluded three similar cases), and artifacts due to patient motion. We asked the patients about a positive family history of breast cancer.
3.2. Breast MRI Protocol
Examinations were performed by a 1.5 T Signa system (General Electric Medical Systems, USA) using a phased-array four channel breast coil for both breasts in a standard prone position.
The parameters of the applied MRI sequences were as follows: the axial T1-weighted sequences: repetition time (TR)/echo time (TE): 400ms/10ms; bandwidth (BW): 31.25 Hz/pixel; field of view (FOV): usually 32 mm; slice thickness: 5.0 mm; matrix size: 384 × 256; number of excitations (NEX): 1; axial short tau inversion recovery (STIR): TR/TE: 4500 ms/63 ms; bandwidth: 62.50; FOV: usually 32; slice thickness: 5.0 mm; matrix size: 320 × 256; NEX: 1; dynamic MRI using a three-dimensional fat suppressed T1-weighted spoiled gradient-echo sequence: TR/TE: 9 ms/4 ms; BW: 31.25; FOV: 32; slice thickness: 4.0 mm with no intersection gap; matrix size: 352 × 288; NEX: 1; flip angle (FA): 300 (after bolus injection of 0.2 mmol/kg of Dotarem, followed by 15 mL normal saline flush); DWI echo planer image: TR/TE: 7700 ms/89 ms; FOV: 38; flip angle: 90; NEX: 4; matrix: 192 × 192 pixels; and slice thickness: 5 mm with spatial fat suppression and with two respective b factors (0 and 800 s/mm2). The ADC maps were automatically calculated using the MRI system software. DWI was the last sequence after 10 min of Dotarem injection.
3.3. Image Analysis
A radiologist blinded to the clinical and histopathological information with more than ten years of experience reviewed all MR images. The size of the breast lesion was measured on its largest diameter on the dynamic contrast-enhanced (DCE) MRI images.
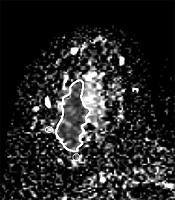
First, in the slice with the largest tumor cross section on the ADC map, one freehand region of interest (ROI) was drawn to cover the whole lesion. Cystic or necrotic, fatty regions and hematoma inside the lesion were attempted to be avoided. Then, three small ROIs about 10 mm2 were placed in the peri-tumor fibroglandular tissue adjacent to the tumor contour on the ADC map, and their mean was recorded as a peri-tumoral ADC value (Figure 1). Furthermore, we measured the ADC value of the normal breast tissue. Two large ROIs were placed on the contralateral healthy fibroglandular breast tissue, and their mean was designated as a mean ADC value of normal tissues. Afterwards, the peri-tumoral-normal tissue ADC ratio was calculated.
 map one freehand region of interest (ROI) was drawn to cover the whole lesion. Then three small ROIs about 10 mm<sup>2</sup> were just placed in the adjacent peri-tumor fibroglandular tissue.")
In the slice with the largest tumor cross section on the apparent diffusion coefficient (ADC) map one freehand region of interest (ROI) was drawn to cover the whole lesion. Then three small ROIs about 10 mm2 were just placed in the adjacent peri-tumor fibroglandular tissue.
In addition, the visual assessment of surrounding breast parenchyma of the tumor on T2WI was carried out and based on the presence of peri-tumoral edema, the lesions were categorized into two groups: (A) with peri-tumoral edema (36 lesions) (Figure 2) and (B) without peri-tumoral edema (53 lesions) (Figure 3). Finally, peri-tumoral tissue ADCs and the peri-tumoral-normal tissue ADC ratio were compared between the two groups.
; B, Post contrast image (early phase); C, Diffusion-weighted imaging (DWI), D: Apparent diffusion coefficient (ADC).")
A case of invasive ductal carcinoma in a 36-year old lady with peri-tumoral edema. A, T2 Weighted Imaging (T2WI); B, Post contrast image (early phase); C, Diffusion-weighted imaging (DWI), D: Apparent diffusion coefficient (ADC).
; B, Post contrast image (early phase); C, Diffusion-weighted imaging (DWI), D: Apparent diffusion coefficient (ADC).")
A case of invasive ductal carcinoma in a 42-year old lady without peri-tumoral edema. A, T2 Weighted Imaging (T2WI); B, Post contrast image (early phase); C, Diffusion-weighted imaging (DWI), D: Apparent diffusion coefficient (ADC).
3.4. Statistical Analysis
Statistical analysis was performed using SPSS for Windows software (SPSS Inc. Released 2009. PASW Statistics for Windows, version 18.0. Chicago: SPSS Inc). The variables including age, tumor size, tumoral ADCs, peri-tumoral ADCs, and peri-tumoral ADC/normal tissue ADC were compared in the two groups with and without peri-tumoral edema in T2WI using independent sample t-test. Moreover, the relationship was evaluated between tumoral and peri-tumoral ADCs in invasive and in situ breast cancers using analysis of variance (ANOVA). Tumor state was evaluated in the two groups with and without peri-tumoral edema using Fisher’s exact and chi-square tests. A P value of lower than 0.05 was considered statistically significant. The receiver operating characteristic (ROC) analysis was used to evaluate the potentiality of the ADC value in differentiation of the normal breast tissue and peri-tumoral ADCs. Finally, diagnostic indices of selected cut-off point of ADC (including sensitivity, specificity, positive predictive value [PPV], negative predictive value [NPV] and accuracy) were determined.
4. Results
In this study, 78 patients with 89 breast cancers (invasive and in situ) with the average age of 47 ± 7.7 years were investigated. The participants were divided into two groups of 36 (40%) patients with peri-tumoral edema (group A) and 53 (60%) patients without peri-tumoral edema (group B). About 19% of our cases had a positive family history of breast cancer. The mean age was 47.08 ± 7.84 years in group A and 47.06 ± 7.51 years in the other group. There was no significant difference between the two groups considering age (P > 0.05). The percentage of positive family history was 22.2% in group A and 30.1% in group B, but there was no significant difference between the two groups (P > 0.05). Moreover, the mean tumor size was 31.41 ± 21.50 mm and 27.71 ± 19.71 mm in groups A and B, respectively, but there was no significant difference between them (P > 0.05) (Table 1).
| No peri-tumoral edema (n = 53) | Peri-tumoral edema (n = 36) | OR (CIs) | P value | |
|---|---|---|---|---|
| Tumor state | 0.35 (0.04 - 3.27) | 0.338 | ||
| Invasive | 49 (92.45) | 35 (97.22) | ||
| In situ | 4 (7.55) | 1 (2.78) | ||
| Family history of breast cancer | 1.51 (0.57 - 4.04) | 0.406 | ||
| Positive | 16 (30.18) | 8 (22.22) | ||
| Negative | 37 (69.81) | 28 (77.77) | ||
| Age | 47.06 ± 7.51 | 47.08 ± 7.84 | 0.942 | |
| Tumor size | 27.71 ± 19.71 | 31.41 ± 21.50 | 0.326 |
Age, Tumor Size, Positive Family History and Tumor State in the Two Groups with and Without Peri-Tumoral Edema in T2WIa
Tumor ADCs were significantly lower in group A compared to group B (0.95 × 10⁻³mm2/s vs. 1.11 × 10⁻³mm2/s). However, peri-tumoral ADCs were significantly higher in group A (1.82 × 10⁻³mm2/s vs. 1.53 × 10⁻³mm2/s) compared to the other group.
In our study, the mean of ADC values was 1.76 × 10⁻³mm2/s in the normal breast tissue; whereas, the mean of the peri-tumoral tissue was 1.65 × 10⁻³mm2/s in the two groups, with the difference being significant (P = 0.01). Peri-tumoral tissue ADCs were 1.82 × 10⁻³mm2/s in group A and 1.53 × 10⁻³mm2/s in the other group.
Furthermore, the peri-tumoral-normal tissue ADC ratio was 0.87 in group B and approximately 1 in group A. However, the difference between normal tissue ADCs and peri-tumoral ADCs was significant only in group B (P value < 0.05) (Table 2). The cut-off point value for differentiating normal tissue ADCs and peri-tumoral ADCs was 1.61 × 10⁻³mm2/s with a sensitivity of 65%, specificity of 70%, accuracy of 68%, PPV of 45% and NPV of 85%.
| No peri-tumoral edema (n = 53) | Peri-tumoral edema (n = 36) | P value | |
|---|---|---|---|
| Tumor ADC | 1.11 ± 0.27 | 0.95 ± 0.2 | 0.003 |
| Peritumor ADC | 1.53 ± 0.29 | 1.182 ± 0.25 | < 0.01 |
| Peritumor ADC/normal tissue ADC | 0.87 ± 0.17 | 1.03 ± 0.14 | < 0.01 |
Tumoral and Peri-Tumoral ADCs and Peri-Tumoral ADC/Normal Tissue ADC in the Two Groups with and Without Peri-Tumoral Edema in T2WIa
Only one (2.7%) lesion in group A and four (7.5%) lesions in group B were in situ cancers, but the difference was not significant (P > 0.05) (Table 1). The in situ cancer in group A had a large non-mass enhancement pattern on dynamic MRI and also had some microinvasive foci in histopathology. The mean ADC value was significantly lower in invasive cancers than in situ tumors (1 × 10⁻³mm2/s vs. 1.49 × 10⁻³mm2/s, respectively). Furthermore, the mean of peri-tumoral tissue ADCs was 1.65 × 10⁻³mm2/s in invasive cancers (regardless of the presence of edema) and 1.74 × 10⁻³mm2/s in in situ tumors. However, the difference between normal tissue ADCs and peri-tumoral tissue ADCs was significant only in invasive cancers (P value < 0.05) (Table 3).
5. Discussion
Despite the widespread application of different modalities in the detection and characterization of breast cancer in many literatures, only few studies have investigated the role of imaging in the evaluation of changes in peri-tumoral tissues (2, 5, 15-17).
In recent years, DWI and ADC values have been extensively used in differentiation of malignant and benign breast lesions. Relatively high cellular density in malignant lesions produces a low ADC value (13, 19-21).
In the present study, ADC values were significantly lower in malignant lesions compared to normal tissues (0.95 × 10⁻³mm2/s in group A and 1.11 × 10⁻³mm2/s in group B vs. 1.76 × 10⁻³mm2/s in normal tissues).
The peri-tumoral tissue generally had lower ADC values compared to the normal breast tissue (1.65 × 10⁻³mm2/s vs. 1.76 × 10⁻³mm2/s, respectively). However, it was nearly similar (1.82 × 10⁻³mm2/s) to normal tissue in group A due to peri-tumoral edema, and the peri-tumor to normal tissue ADC ratio in this group was about 1. Furthermore, the peri-tumoral tissue ADC value in in situ cancers had no difference with the normal breast tissue (1.74 × 10⁻³mm2/s vs. 1.76 × 10⁻³mm2/s, respectively).
The findings showed that invasive cancers (and not in situ ones) could affect adjacent peripheral parenchyma and that DWI had the ability to show these changes. In addition, the presence of peri-tumoral edema in our study had a significantly important effect on the ADCs of the peri-tumoral tissue. We also found that the presence of peri-tumoral edema had association with lower tumoral ADCs. We assume that the presence of peri-tumoral edema on T2WI is related to higher grade tumors. Unfortunately, we did not evaluate the relation of peri-tumoral edema with pathologic biomarkers and lymphovascular invasion. However, it has been shown by some studies that higher grade tumors with lymphovascular invasion, higher nuclear grade, negative ER (estrogen receptor), positive HER2 (human epidermal growth factor receptor 2), positive Ki67, and lymph node metastasis have lower tumoral ADCs and higher peri-tumoral ADCs (2, 5, 15-17). The findings related to peri-tumoral ADCs in these studies might be related to the presence of peri-tumoral edema. Only one of these studies evaluated the presence of peri-tumoral edema, which found no relationship between the presence of peri-tumoral edema and the presence of lymphovascular invasion (16, 18). Uematsu et al. (18) found that prepectoral edema had low prevalence (9% among breast cancers) but it is a specific finding for breast cancer and had high association with prognostic factors such as larger tumor size, higher histological grade, high lymphovascular invasion, higher rate of axillary lymph node positivity, higher rate of inflammatory breast cancer, higher rate of neoadjuvant chemotherapy, and presence of chemoresistant breast cancer (18).
Cheon et al. (22) assessed the association of disease recurrence with clinical-pathologic features and peri-tumoral edema in 353 invasive breast cancers. They found that peri-tumoral edema was an independent factor associated with disease recurrence and higher T & N stage, higher tumor grade, and higher Ki-67 index. Furthermore, they reported that peri-tumoral edema is a well-known and important contributor to morbidity or mortality in brain and meningeal tumors (22). In their study, peri-tumoral edema was present in 22.9% of invasive breast cancers. In our study, the percentage of peri-tumoral edema was 41% among invasive cancers, while it was reported 15% - 32% in other studies (23, 24). Costantini et al. (23) reported a higher frequency of peri-tumoral edema in triple-negative breast cancers.
Our study had some limitations. First, peri-tumoral edema was evaluated subjectively. Second, we included a relatively small number of patients. Finally, we did not assess pathologic biomarkers and lymphovascular invasion.
In conclusion, our results suggest that the presence of peri-tumoral edema identified at T2WI can predict tumoral characteristics on DWI. Moreover, our findings indicate that peri-tumoral edema has correlation with lower tumoral ADCs and higher peri-tumoral ADCs and is usually not observed in in situ cancers. The presence of peri-tumoral edema may be associated with higher grade tumors and provides other prognostic factors in patients with breast cancer. Further prospective studies with larger number of patients and concurrent evaluation of prognostic factors and peri-tumoral edema are needed to confirm our results.
