


1. Context
2. Evidence Acquisition
3. Methods
3.1. Search Strategy
3.2. Inclusion Criteria
3.3. Exclusion Criteria
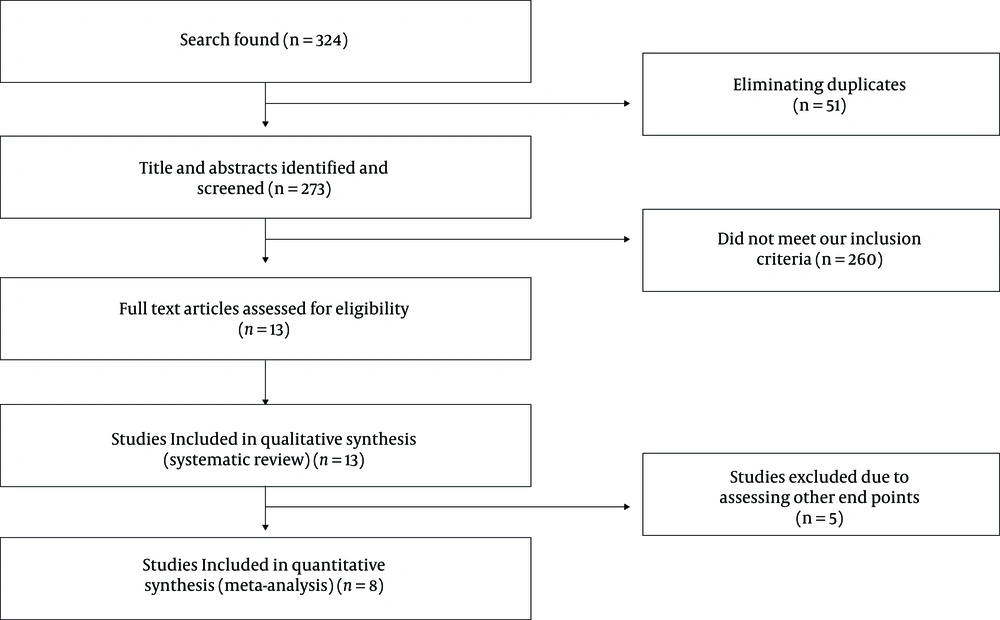
Flow diagram of how to select studies and enter to our assessment (Abbreviation: RCT, randomized clinical trial).
3.4. Data Extraction
| Author Name and Year | Place of Measure | Intervention Age Mean (y) | Control Age Mean (y) | Duration of Disease Control Mean (y) | Duration of Disease Intervention Mean (y) | Dose of Vitamin D/day | Duration | Outcome Assessment Method | Outcome |
|---|---|---|---|---|---|---|---|---|---|
| Ashtari et al. 2015 (11) | Serum | 31.5 | 34.6 | 4.1 | 4.46 | 5000 IU/5 day | 3 month | ELISA | IL-10 |
| Hashemi et al. 2018 (13) | Serum | 32.6 | 31.7 | 8.1 | 0 | 50000 IU/7 days | 8 weeks | Real time PCR | IL-10, IL-17 |
| Hashemi et al. 2018 (13) | Serum | 27.4 | 31.7 | Not clear | 0 | 50000 IU/7 days | 8 weeks | Real time PCR | IL-10, IL-17 |
| Mahon et al. 2003 (18) | PBMC | Not clear | Not clear | Not clear | Not clear | 1000 IU/day | 6 month | Real time PCR | IFN-γ |
| Mosayebi et al. 2011 (14) | PBMC | 37 | 35 | 4.15 | 6.4 | 300000 IU/ 30 day | 6 month | ELISA | IL-10, IFN-γ |
| Golan et al. 2013 (12) | Serum | 43.1 | 44.7 | 6 | 9.3 | 75000 IU/ 21day | 3 month | ELISA | IL-17 |
| Toghianifar et al. 2015 (17) | Serum | 31.5 | 34.6 | 4.1 | 4.46 | 50000 IU/5day | 12 week | ELISA | IL-17 |
| Rolf et al. 2017 (15) | PBMC | 38.5 | 37.6 | 5.7 | 7.5 | 14000 IU/day | 48 week | ELISA | IL-10 |
| Muris et al. 2016 (16) | PBMC | 37.7 | 37.2 | 7.3 | 7.3 | 14000 IU/day | 48 week | ELISA | IL-10 ,IFN-γ |
3.5. Quality Assessment
| Author Name and Year | Random Sequence Generation | Allocation Concealment | Selective Reporting | Blinding (Participants and Personnel) | Blinding (Outcome Assessment) | Incomplete Outcome Data | Other Sources of Bias |
|---|---|---|---|---|---|---|---|
| Ashtari et al. 2015 (11) | L | U | H | L | L | L | H |
| Hashemi et al. 2018 (13) | L | H | L | L | H | L | H |
| Mahon et al. 2003 (18) | L | H | L | L | U | L | H |
| Mosayebi et al. 2011 (14) | L | U | U | L | U | L | L |
| Golan et al. 2013 (12) | L | U | H | L | U | H | L |
| Toghainfar et al. 2015 (17) | L | U | L | L | U | L | L |
| Rolf et al. 2017 (15) | L | H | H | U | U | L | L |
| Muris et al. 2016 (16) | L | H | H | U | U | L | L |
3.6. Statistical Analysis
4. Results
4.1. Findings from Systematic Review
4.2. Findings from Meta-analysis
4.2.1. The Effect of Vitamin D Supplementation on IL-10 Level in MS Patients
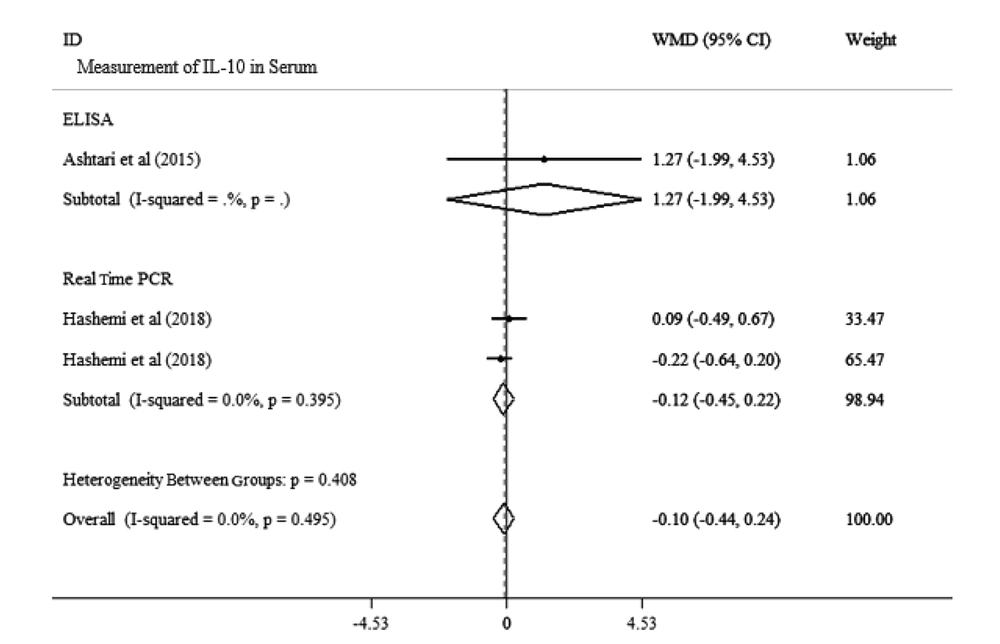
Forest plots for the effect of vitamin D supplementation on IL-10 level in serum analysis in MS patients with subgroup for the method of measurement. Data is expressed as mean differences between the control and vitamin D supplementation groups. The inverse of the variance of the weighted mean difference (WMD) is the area of each square. Horizontal lines represent 95% CIs. Diamonds show pooled mean estimates from fixed-effects analysis. Subgroup analysis was used for the method of measurement.
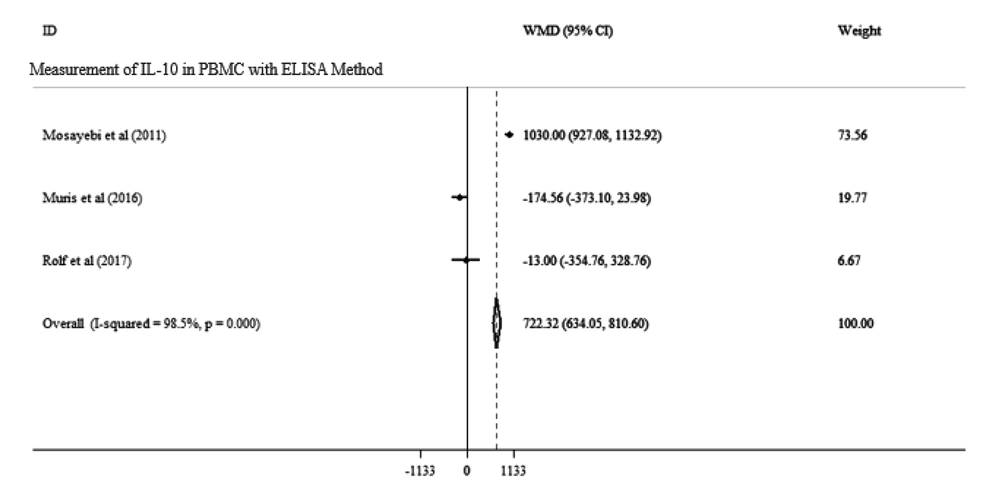
Forest plots for the effect of vitamin D supplementation on IL-10 level in PBMC in MS patients with the ELISA method. Data is expressed as mean differences between the control and vitamin D supplementation groups. The inverse of the variance of the weighted mean difference (WMD) is the area of each square. Horizontal lines represent 95% CIs. Diamonds show pooled mean estimates from fixed-effects analysis.
4.2.2. The Effect of Vitamin D Supplementation on IL-17 Level in MS Patients
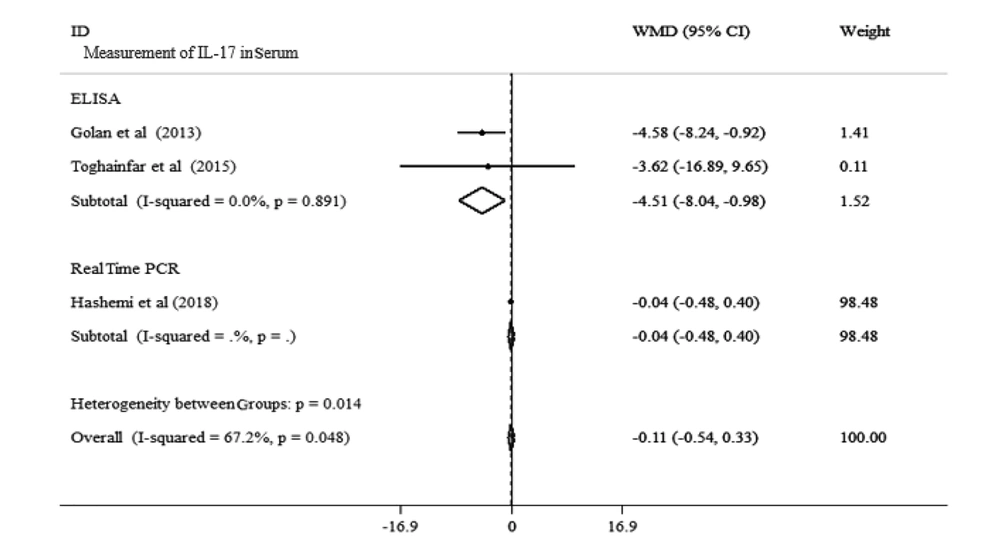
Forest plots for the effect of vitamin D supplementation on IL-17 level in serum of MS patients expressed as mean differences between the control and vitamin D supplementation groups. The inverse of the variance of the weighted mean difference (WMD) is the area of each square. Horizontal lines represent 95% CIs. Diamonds show pooled mean estimates from fixed-effects analysis.
4.2.3. The Effect of Vitamin D Supplementation on IFN-γ Level in MS Patients
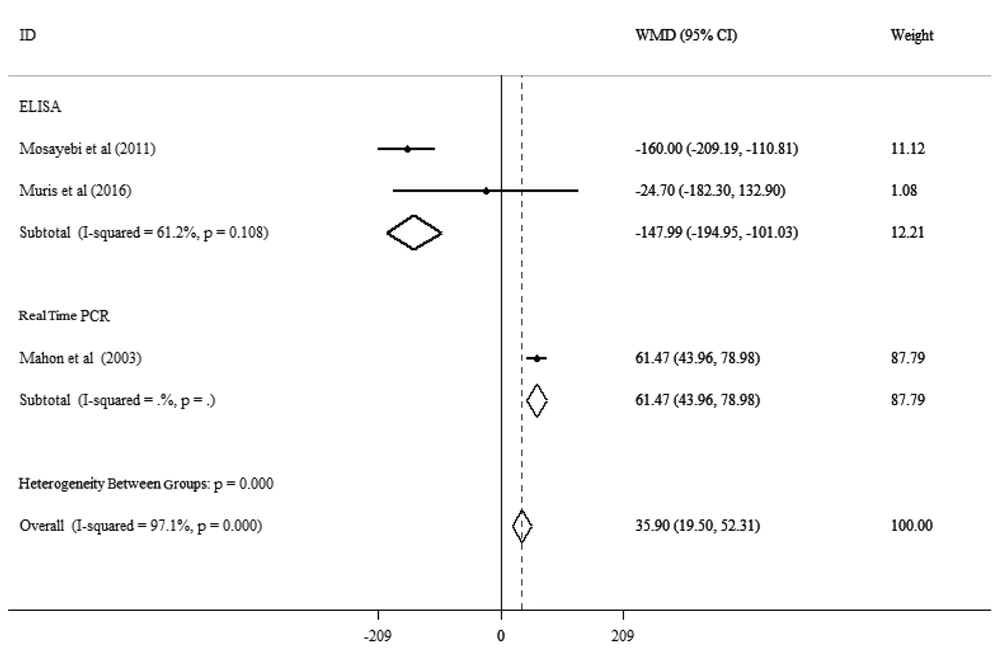
Forest plots for the effect of vitamin D supplementation on IFN-γ level in PBMC of MS patients expressed as mean differences between the intervention and control groups. The inverse of the variance of the weighted mean difference (WMD) is the area of each square. Horizontal lines represent 95% CIs. Diamonds show pooled mean estimates from fixed-effects analysis. Subgroup analysis was applied for the method of measurement.
