1. Background
Diabetes is one of the most chronic health challenges (1). In 2014, the global prevalence of diabetes was 8.5% in the adult population (2). In Iran, it is estimated that about 4.5 to 5.5 million people (about 7% of the general population) have diabetes, which has been increasing during the past decades (3).
Diabetes is one of the top ten causes of death (4). Type 2 diabetes mellitus (T2DM) accounts for more than 90% of all diabetes and is largely preventable (5). Based on the latest report, the diabetes prevalence rate in Iran was 11.4% in adults aged 25 - 70 years (6). Therefore, a large number of adults in Iran have diabetes.
Military personnel is recruited from a relatively healthy population. However, they are not immune to diseases. Diabetes should be less prevalent in these communities due to their particular lifestyle. Some studies have shown that armed conditions have increased the risk of T2DM (7, 8). In order to design prevention interventions and provide better healthcare services, it is necessary to estimate diabetes prevalence and its potential risk factors in military personnel.
There are several class methods that can be used for data with binary outcome variables. Logistic regression is a non-linear parametric predictive model widely used in diabetes studies (7, 9-11). Due to the complex interaction among predictors, there has been an increase in the use of model-free machine learning algorithms. Yu et al. (12) applied a support vector machine (SVM) model to classify subjects with diabetes and pre-diabetes. Khalilia et al. (13) compared SVM, bagging, boosting, and random forest (RF) to predict the risk of several chronic diseases, including diabetes. Casanova et al. (14) examined RF performance relative to logistic regression to classify diabetic retinopathy participants. Uemura et al. (15) investigated unknown factors associated with T2DM using an alternating decision tree.
2. Objectives
To date, very few studies have been done regarding T2DM prevalence in Iran Army Forces. This study was carried out to estimate the prevalence of T2DM in Iran Army Ground Forces and to measure the T2DM rate in the study population subgroups. We hypothesized that a military lifestyle contributes to the risk of T2DM. The next aim was to identify the T2DM risk factors in the population in order to accurately classify patients. In this study, we used three research methods consisting of classic logistic regression and two modern classification algorithms, including decision tree and RF. We discuss the issues of choosing a classification algorithm in relation to the results.
3. Methods
3.1. Study Sample
In this cross-sectional study, we employed a representative sample of data from the Iran Ground Army Forces Health Examination Center for 3661 subjects. Independent demographic and clinical variables included age, military rank (Rank), body mass index (BMI), fast plasma glucose (FPG), total cholesterol (TCL), low-density lipoprotein cholesterol (LDL), and triglyceride (TG) (Table 1).
| No. | Symbol | Definition | Unit |
|---|---|---|---|
| 1 | Age | Age | Year |
| 2 | Rank | Army rank | Individual |
| 3 | BMI | Body mass index | kg/m2 |
| 4 | FPG | Fast plasma glucose | mg/dL |
| 5 | TCL | Total cholesterol | mg/dL |
| 6 | LDL | Low-density lipoprotein | mg/dL |
| 7 | TG | Triglyceride | mg/dL |
Description of Variables
Subjects were identified as having T2DM if their FPG was greater than 125 mg/dL (16). Military rank was considered as an indicator of socioeconomic status, and was categorized into three groups of staff, conscripts (juniors and non-commissioned officers), and officers. BMI was calculated as weight (kg) divided by the square of height (m2).
3.2. Descriptive Study
The distribution of the subjects was examined by age groups, rank, BMI, and various levels of TCL, LDL, and TG. Age groups were determined based on age quantiles. Subjects were categorized in three BMI strata as normal with BMI < 25 kg/m2, overweight with BMI range between 25 and 30 kg/m2, and obese with BMI ≥ 30 kg/m2. A total cholesterol level of under 200 mg/dL was ideal. A level between 200 to 239 mg/dL was in borderline class, and more than 240 mg/dL was at high-risk. LDL level lower than 100 mg/dL was ideal, between 100 and 129 mg/dL was close to ideal, between 130 and 159 mg/dL was in borderline class, and more than 160 was elevated. The ideal level of TG was lower than 150 mg/dL, and the borderline was between 150 and 199 mg/dL. A level over 200 mg/dL was known to be high. Cholesterol classes were defined based on the U.S. National Institute of Health Guide. Mean age, BMI, TCL, LDL, and TG were calculated and compared using the t-test statistics.
3.3. Analytical Study
3.3.1. Statistical Analyses
To explore the effects of risk factors on T2DM, we considered a classic binary multiple logistic regression model as well as two modern supervised machine learning algorithms, including decision tree and RF. We defined dependent variable y = 1 for T2DM and y = 1 for control subjects. For multiple logistic regression, the below equation was used:
Where, π (x) is the probability that y = 1 for a given value of independent variables Xis, β0 is intercept, and βis are regression coefficients. To find the most parsimonious model, we used a backward stepwise variable selection. Akaike Information Criterion was applied to assess the importance of each factor on the goodness of fit.
Compared to parametric logistic regression, non-parametric tree-based methods do not require a predefined relationship between dependent and independent variables. A decision tree consists of hierarchical nodes formed by binary recursive partitioning of the data set into one independent variable at a time. Partitioning occurs based on the Gini impurity index. The results are represented graphically as a decision tree (17).
Random forest (18) is an ensemble classifier that composes of many decision trees (ntree), and each tree is constructed of a bootstrap sample of variables (mtry) and observations. Each tree generates a classification. Based on all the trees, the forest selects the classification with the most votes (19). We set $ntree$ to 1000 and run RF for different $mtry$ values to classify T2DM. RF gives variable importance according to the degree of association between a dependent variable and observations.
Data were split into training and testing partitions with a ratio of 70 to 30%. Due to the rare occurrence of T2DM, this data set is class-imbalanced. Using imbalanced data in most classifiers will produce models with high accuracy but low prediction performance for the minority class. To deal with imbalanced data, we used Synthetic Minority Over-sampling Technique (SMOTE) (20) in the training set. SMOTE created artificial data for the minority training set based on randomly chosen samples from the k nearest minority class neighbors. To overcome the overfitting problem and increase the predictive performance of models on the testing set, we performed 10-fold cross-validation with three repeats for analyzing the training set.
3.3.2. Algorithm Evaluation
In order to assess classifier performance, we compared the accuracy, sensitivity, and specificity metrics according to confusion matrix (21). The area under the receiver operating characteristic curve (AUC) was computed to evaluate the overall performance of the three classifiers. We performed all calculations and statistical analyses using the R software (22) and the packages caret (21), DMwR (23), MASS, rpart (24), rpart.plot (25), RF (26), and ggplot2 (27).
3.4. Approval Code
The Ethical committee of AJA University of Medical Sciences approved this study by the approval code 995685.
4. Results
Of the 3661 subjects, 517 were excluded due to missing values for one or more variables or measured values being outside the variable’s range. The main analysis was performed for 3144 samples.
4.1. Descriptive Results
In the study population, the mean age was 36.1 ± 7 years, the mean BMI was 25.8 ± 3.2 kg/m2, the mean FPG was 91.2 ± 19.5 mg/dL, the mean TCL was 173.6 ± 34.1 mg/dL, the man LDL was 103.8 ± 29.2 mg/dL, and the mean TG was 131.7 ± 58.5 mg/dL. Data set consisted of 1412 (44.9%) officers, 1121 (35.7%) conscripts, and 611 (19.4%) staff members. Also, 94 (3%) subjects from 3144 samples (3%) were found to have T2DM.
The results showed that T2DM patients had a significantly higher mean age, BMI, FPG, TCL, and TG (Table 2). There was no significant difference in the mean LDL levels. Prevalence of T2DM increased as subjects became older. The ratio of staff members with T2DM was more than the other ranks. T2DM is more common in obese and overweight groups. The highest prevalence of T2DM was in the subjects with high levels of TCL, LDL, and TG (Table 3).
Comparison of Mean (SD) of the Variables Between Individuals with or Without Type 2 Diabetes Mellitus (T2DM)
| Characteristic | T2DM b | Total | |
|---|---|---|---|
| Yes | No | ||
| Age (y) c | |||
| 19 - 31 | 6 (0.7) | 897 (99.3) | 903 |
| 32 - 34 | 8 (1.2) | 674 (98.8) | 682 |
| 35 - 42 | 29 (3.3) | 839 (96.7) | 868 |
| 43 - 57 | 51 (7.4) | 640 (92.6) | 691 |
| Rank | |||
| Officer | 49 (3.5) | 1363 (96.5) | 1412 |
| Conscripts | 14 (1.2) | 1107 (98.8) | 1121 |
| Staff | 31 (5.1) | 580 (94.9) | 611 |
| BMI (kg/m2) | |||
| Normal: < 25 | 22 (1.6) | 1337 (98.4) | 1359 |
| Overweight: 25 - 30 | 51 (3.4) | 1437 (96.6) | 1488 |
| Obese: ≥ 30 | 21 (7.1) | 276 (92.9) | 297 |
| TCL (mg/dL) | |||
| Ideal: < 200 | 64 (2.6) | 2391 (97.4) | 2455 |
| Borderline: 200 - 239 | 21 (3.7) | 546 (96.3) | 567 |
| High: ≥ 240 | 9 (7.4) | 113 (92.6) | 122 |
| LDL (mg/dL) | |||
| Ideal: < 100 | 41 (2.7) | 1453 (97.3) | 1494 |
| Close to ideal :100 - 129 | 32 (3.2) | 966 (96.8) | 998 |
| Borderline: 130 - 159 | 14 (2.6) | 524 (97.4) | 538 |
| High: ≥ 160 | 7 (6.1) | 107 (93.9) | 114 |
| TG (mg/dL) | |||
| Ideal: < 150 | 50 (2.4) | 2057 (97.6) | 2107 |
| Borderline: 150 - 199 | 16 (2.6) | 594 (97.4) | 610 |
| High: ≥ 200 | 28 (6.6) | 399 (93.4) | 427 |
Distribution of Individuals Based on Age Group, Military Rank (Rank), Body Mass Index (BMI), Total Cholesterol (TCL), Low-Density Lipoprotein Cholesterol (LDL) and Triglyceride (TG) a
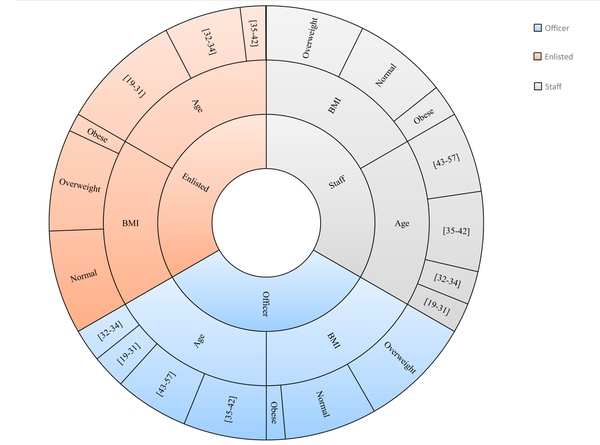
Figure 1 depicts the distribution of rank by age and BMI. For officers, conscripts, and staff members, the mean age was 38.9 ± 6.7, 31.1 ± 3.7, and 39.8 ± 7.2 years and the mean BMI was 26.1 ± 3.2, 25.7 ± 3.3, and 26.3 ± 3.9 kg/m2, respectively.
4.2. Analytical Results
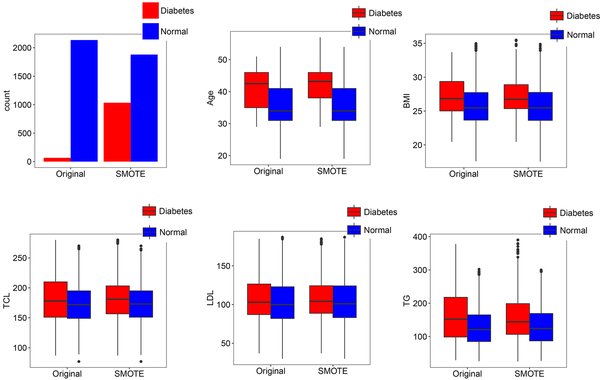
The original training set was imbalanced. All three classification algorithms were highly biased in prediction toward the majority class. We applied SMOTE to undersample the majority class as well as oversample the minority class in the training set. The features of the original training set and training set after conducting SMOTE are compared in Figure 2.
Comparison of the original training set and training set after applying Synthetic Minority Over-sampling Technique (SMOTE) for the number of individuals in each category: Age, body mass index (BMI), total cholesterol (TCL), low-density lipoprotein cholesterol (LDL), and triglyceride (TG). Subjects were identified as having type 2 diabetes mellitus if their fast plasma glucose level was greater than 125 mg/dL.
The stepwise logistic regression model selected six variables of age, rank, BMI, TCL, LDL, and TG as risk factors associated with having T2DM (Table 4). Notably, the results showed that with one year increase in age, we expect a 16% increase in the odds of having T2DM. The odds of incidence of T2DM in officers was 68% less than in staff members. One unit increase in BMI raised the odds of having T2DM by 12%. The logistic regression model had a prediction accuracy of 82.7% (95% confidence interval: 80.1%, 85.1%), a sensitivity of 64.3%, and a specificity of 83.3%. In the testing set, 2.9% had T2DM, of whom 1.9% were correctly detected. The logistic regression model had an AUC of 73.8% (95% confidence interval: 64.7%, 82.9%).
Multiple Logistic Regression Analysis for Type 2 Diabetes Mellitus
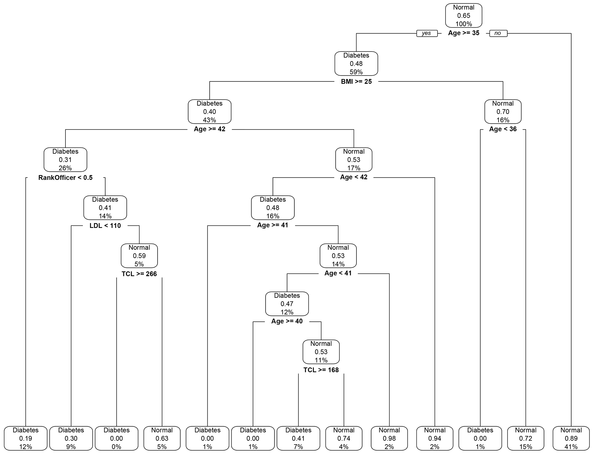
The classification decision tree revealed that age and BMI with interactions between them were the most important predictors that affect T2DM (Figure 3). The decision tree yielded cut-off points of 35 years of age and 25 kg/m2 for BMI. According to the results, the incidence of T2DM was higher in cases aged ≥ 35 and with a BMI ≥ 25. The final value for max depth was 8, which culminated in the highest accuracy through cross-validation. The accuracy of prediction was 85.8% (95% confidence interval: 83.4%, 87.9%) with a sensitivity 67.8% and a specificity 86.4%. The prevalence of T2DM in test data was 2.9%, and the detection rate in test data was 2.0%. The AUC value was 77.1% (95% confidence interval: 68.2%, 85.9%) for T2DM. In terms of the classification decision tree, we achieved slightly better results than those from the multiple logistic regression model.
The classification decision tree of demographic and biological risk factors for type 2 diabetes mellitus. Information in each class model includes: Label, the probability of a fitted class, i.e. the correct classification rate at the node, and the percentage of observations that fall in the node. Subjects were identified as having type 2 diabetes mellitus if their fast plasma glucose level was greater than 125 mg/dL. BMI, body mass index; FPG, fast plasma glucose; LDL, low-density lipoprotein cholesterol; TCL, total cholesterol
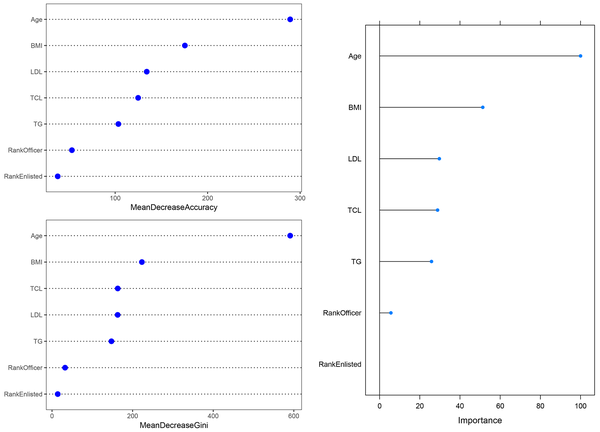
The RF identified age (100%) as the most important correlated variable with T2DM. As shown in Figure 4, the elimination of age from the model causes the largest decrease in performance of the model. Other variables ranked based on their relative importance to the age. After the age, BMI (51.3%) had the highest importance. In contrast to the former models, the results of RF showed that LDL (29.7%), TCL (28.8%), and TG (25.8%) were associated with T2DM. The RF had the highest prediction accuracy of 94.4% (95% confidence interval: 92.7%, 95.8%), the sensitivity of 100%, and specificity of 94.2%. All cases in the testing set were detected. The RF yielded the best AUC of 97.1% (95% confidence interval: 96.4%, 97.9%). These results indicated that RF outperformed decision tree and multiple logistic regression.
The variable importance in random forest. The upper left figure shows variable importance based on a mean decrease in accuracy, the lower left figure shows variable importance based on a decrease in Gini Index, and the right figure shows overall variable importance. BMI, body mass index; LDL, low-density lipoprotein cholesterol; TCL, total cholesterol; TG, triglyceride.
5. Discussion
The findings in this study showed that, as we believed, the incidence of T2DM is much lower in the study population than the prevalence of T2DM in the general population. Military personnel is chosen according to pre-employment medical tests. In addition, the military lifestyle demands particular conditions, including regular physical activity, more mobility, a healthier dietary program, and periodic medical examination.
Previous studies have demonstrated increased T2DM risk associated with physical inactivity (28-30). As the results showed, the mean age and BMI were almost similar between officers and staff members. Therefore, the higher T2DM incidence in staff may confirm physical inactivity and sedentary behaviors in this group. Some studies have reported a stressful lifestyle as a risk factor for T2DM (7, 31). We used rank as a marker for socioeconomic status. However, the lower prevalence of T2DM in conscripts is probably more related to their age and BMI circumstances than to their life status.
The risk of T2DM was categorized into modifiable and non-modifiable factors (32). Among the variables in this study, only age was non-modifiable. Obesity is a well-established risk factor for T2DM (33). The incidence of overweight or obesity in the study population was around 56.8%, and about 2.3% of T2DM individuals were overweight or obese. Kuwahara et al. (11) suggested that preventing weight gain plays an important role in the reduction of T2DM risk. Diabetic dyslipidemia is an abnormal change in lipid profile as a consequence of T2DM (34). Previous studies have illustrated how insulin resistance in T2DM patients causes high TG levels and decreased HDL cholesterol levels (34-36). T2DM individuals have elevated LDL cholesterol levels, but they may not have higher LDL levels (37). Our findings of lipid profiles in T2DM patients are consistent with the reports of the aforementioned studies.
In this study, we evaluated three classification methods, and all of them suffered from the class-imbalanced problem. The use of SMOTE sampling technique was useful to resolve the imbalanced data problem.
Among classification methods, logistic regression has been extensively used in scientific research to measure the association between dependent and independent variables. Logistic regression is a parametric model and works based on a pre-determined set of variables. Therefore, its classification performance depends on the given model. Due to the intricate relationship among underlying features, this method may not have enough power to accurately classify subjects (38).
By contrast, the decision tree is a non-parametric method mainly developed to classify the population rather to test the significance of variables on outcome (39). However, the major drawback of the decision tree is moderate-to-high variance, which is an important cause of decision tree weak performance (40).
RF is also a model-free classification technique, working based on an ensemble of decision trees. The salient feature of RF is low variance due to randomness grown of many trees (41). Consequently, RF is less prone to overfitting and is better in generalization. In addition, RF provides a measure of variable importance, which is more informative than choosing a group of variables that their combination is predictive. Khalilia et al. (13) showed that RF has superior performance compared to SVM, bagging, and boosting methods in disease prediction. Casanova et al. (14) pointed out that the accuracy of RF in classification of diabetic retinopathy participants was much higher than the accuracy of logistic regression.
Typically, the performance of statistical models is assessed using predictive accuracy. However, study of diseases requires a relatively high rate of correct classification of patients. Our results confirm that RF is more powerful in finding complex relations among risk factors. Specifically, with regard to sensitivity and specificity, the RF more correctly classified cases.


