


1. Background
The length of stay (LOS) in the emergency department (ED) refers to the amount of time a patient spends in the ED from arrival to departure, including time spent receiving medical treatment and waiting for test results, consultations with specialists, admission to the hospital, or discharge from the ED. The length of stay is an important measure of the quality of care in the ED because timely access to care is a crucial component of high-quality healthcare. Patients might be less satisfied with their care and less likely to return to the hospital in the future if they experience long waits in the ED (1).
The ability to predict a patient's LOS in the ED from registration to final disposition can aid in managing and organizing ED operations and resources (2). The efficient utilization of the department and proper allocation of resources depend on understanding the overall LOS, starting from patient admissions to the ED (3). Identifying patients who are at a higher risk of prolonged hospital stays is a valuable technique that can benefit not only the ED but also the hospital as a whole. By utilizing this approach, hospitals can plan for early discharge and allocate resources more efficiently to decrease the unnecessary costs associated with hospitalization (4).
The application of machine learning (ML) techniques in the field of healthcare has been gaining traction in recent years, particularly in predicting patient outcomes and improving resource allocation.
This study focuses on predicting the LOS for patients in the ED using ML techniques. Once the predicted LOS is obtained, we plan to use discrete event simulation (DES) to determine the optimal allocation of resources in the ED. The existing literature on this field is segregated into two primary categories, namely ML studies and simulation studies.
1.1. Machine Learning Studies
Researchers have conducted several studies highlighting the ability to predict patients’ LOS in healthcare facilities. Sariyer et al. (2) focused on the ED, classifying patients' LOS into two categories: More than 45 minutes and less than 45 minutes. The researchers utilized the 10th edition of the International Classification of Diseases (ICD-10) as the model input for their analysis. In terms of predictive performance, the study compared various ML algorithms, including Random Forest (RF), Decision Tree (DT), Logistic Regression (LR), and Multilayer Perceptron (MLP). Notably, the results revealed that LR and MLP demonstrated similar levels of effectiveness in predicting patient LOS. Rahman et al. (5) successfully developed and validated a precise prediction model using a DT technique for patients in the ED with an LOS greater than 4 hours. With an impressive accuracy rate of 85%, the model exhibited exceptional performance in predicting the LOS for individual patients, revealing numerous clinically significant patterns. Chrusciel et al. (6) compared the RF regression model on structured and unstructured data to predict the LOS of ED patients. Structured data refers to the use of ICD-10 and triage codes; nevertheless, unstructured data refers to information extracted from patients' electronic health records. The results indicated that predicting the LOS of patients through unstructured data has the same accuracy as structured data.
1.2. Simulation Studies
In 2005, the National Academy of Engineering and the Institute of Medicine released a report emphasizing the significant role of simulation as a tool for system analysis. This tool can impact care processes at various levels, including the care team, organizational level, and environmental level. Simulation has been widely employed to gain insights into the factors contributing to ED overcrowding and evaluate interventions to mitigate its impact (7).
Brenner et al. (8) developed a simulation model of patient throughput in the ED based on process and flow data analysis. They examined what-if scenarios to identify bottlenecks and determine the optimal number of human and equipment resources, including nurses, doctors, and radiology technology. The simulation results of this study showed that an additional 3 nurses are needed to ensure optimal clinical outcomes. Konrad et al. (9) used DES modeling to support process improvement in a hospital ED. This study tested 17 scenarios to estimate the potential impact of redesigning the flow-sharing process, including changes in staffing levels and patient volume. The findings of the research showed that the measures taken can reduce waiting time and the duration of patients' stays. The traditional method of assigning doctors to the outpatient area in the ED fails to adequately address the surge in patient demand, presenting a significant challenge. Tan et al. (10) intelligently adjusted the number of doctors based on current and historical information about patient arrivals. They modeled and simulated the ED process with time-varying demand and readmission patients. Experimental results showed that the approach of this study enables the ED to better cope with the increase in demand and meet the desired service level of the hospital.
The previous studies review has identified several research gaps in the field. Firstly, there is a greater focus on predicting the LOS of patients in classification rather than using regression models. However, accurately predicting the exact LOS could significantly improve resource allocation. Secondly, there is a lack of utilization of stacking ensemble models in the existing studies. These models have the potential to enhance the accuracy of LOS predictions. Lastly, previous research has not been conducted to explore the relationship between the predicted LOS and the optimal utilization of resources. Therefore, by taking these research gaps into consideration, the current study aimed to address them by predicting patients' LOS in the first part and, in the second part, analyzing how the predicted LOS can optimize resource allocation and increase the productivity of the ED's beds.
2. Objectives
The objective of this study was to utilize data mining algorithms and simulation modeling to predict the LOS of patients and compare scenarios for increasing bed productivity.
The research explores three following scenarios:
(1) The research examines the possibility of converting a portion of the fast-track department into a waiting room for patients. The question is, how many beds can be allocated to this waiting room?
(2) Another scenario focuses on determining the number of beds that can be assigned to the fast-track department.
(3) The research also investigates the correlation between predicting the LOS and enhancing the productivity of the current beds in the ED.
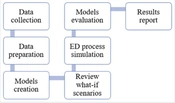
3. Methods
Overall, the process of conducting the research aligns with the depicted steps outlined in Figure 1. The upcoming research consists of two distinct phases: Data mining (DM) in the first stage and simulation in the second stage. Each phase contains its own set of steps, which has been discussed.

The research steps
The Cross Industry Standard Process for DM (CRISP-DM) is a widely used methodology for DM projects. It provides a structured approach to guide the entire DM process, from understanding the business problem to deploying the final model. Crisp-DM follows a 6-step process that includes: (1) Business understanding, (2) data understanding, (3) data preparation, (4) modeling, (5) evaluation, and (6) deployment (11).
The process of conducting DES research involves several steps. First, the problem is mathematically formulated, and goals and plans are determined. Next, data are collected and analyzed to find the most suitable probability distribution. At the same time, the simulation model is conceptualized and translated into a programming language. Then, the model is verified and validated through code evaluation and consultation with domain experts. Finally, the experimental design is executed, and the results of the simulation are reported (12).
3.1. Data Collection
Retrospective data on patients who visited the ED, including vital signs (respiratory rate [RR], pulse rate [PR], systolic blood pressure [SBP], diastolic blood pressure [DBP], and temperatures [T]), the reason for hospitalization (diagnosis), and demographic information (e.g., age and gender) were obtained from the statistics and information department of a general hospital in Tehran within November to December 2018. It was observed that there was a higher volume and diversity of patients admitted to the emergency room within November to December.
In the current assessment, we factored in the insights and viewpoints of the ED specialist, along with the method of arrival (via ambulance or private vehicle) and the Emergency Severity Index (ESI) rating assigned to the patient.
One commonly utilized method in the ED's triage unit is a five-step tool that helps to prioritize patients, both adults and children (13). Level 1 indicates that immediate intervention is required; however, level 2 denotes high-risk patients who should be treated promptly after level 1 cases. Level 3 includes patients with mental or psychiatric symptoms, weakness, fractures, or low-risk trauma who do not have life-threatening conditions. Level 4 comprises patients with acute problems and persistent pain that do not respond to conventional treatments. Level 5 consists of patients who require appointments, consultations, or prescription renewals (14).
To model the discrete event of a patient's journey from arrival to discharge in the ED, the data regarding the arrival times of patients in the ED were gathered from the hospital's information system.
3.2. Data Preparation
When patients arrive in the ED, a crucial piece of information is determining their diagnosis. To classify each diagnosis, healthcare professionals use the ICD-10, which assigns a unique code to each diagnosis (15). For instance, respiratory diseases are given the code J00-J99. We utilized a method of one-hot encoding by defining a column for each classification code found within the dataset. It was verified that the dataset did not contain any instances of missing or duplicate values. For model training, we opted to utilize 80% of the data available within the dataset. To handle the multitude of features present in the dataset, we utilized RF as a feature selection technique. In the process of data analysis, it is imperative to perform feature selection to extract a concise set of relevant features. Additionally, the RF classifier plays a pivotal role in wrapper algorithms that address pertinent problems by providing variable importance measures (16). Therefore, to explore the impact of individual variables on model construction and selection of features, we employed the RF algorithm.
The data distribution for the arrival time of patients at the ED was examined using the input tool of the simulation software's analyzer. This study began by predicting the LOS of patients. Next, we simulated and evaluated the current state of the ED. Finally, we explored different scenarios.
3.3. Modeling
Stacking an ensemble regressor with a voting regressor is a technique that combines the strengths of both stacking and voting ensemble methods for regression problems. In stacking, multiple regression models are trained on the same data, and their predictions are then used as input features for a meta-model, which learns to make the final predictions. This allows the meta-model to learn from the strengths and weaknesses of each individual model. On the other hand, voting ensemble methods combine the predictions of multiple regression models and make predictions based on the majority vote or averaging the predictions (17).
CatBoost (CB) is a high-performance boosting algorithm developed by Yandex. It is specifically designed to handle datasets with categorical features. CatBoost regressor, a variant of CB, is used for regression tasks to predict numerical target variables. Notably, CB stands out with its fast training speed, exceptional accuracy, automatic handling of categorical features, and efficient handling of missing data. Overall, CB is a powerful regression algorithm that excels in handling categorical features and provides fast and accurate predictions (18).
An RF regressor is an ML algorithm that combines multiple DTs to make predictions in regression tasks. It avoids overfitting by training each tree on different random subsets of the training data. The final prediction is obtained by averaging the predictions of all the trees. Randomness is introduced by randomly selecting a subset of features at each split, reducing the correlation between trees. Random Forest regressors are widely used for predicting house prices, stock market trends, and customer behavior analysis due to their accuracy and ability to handle complex data (19).
In this study, we utilized RF and CB regressor models to make predictions about patients' LOS. Furthermore, we employed the approach of regressor voting by combining these models.
4. Results
4.1. Participants
The current study focused analysis exclusively on patients who were admitted to the ED and occupied a bed for at least 6 hours. Patients receiving outpatient care were not included in the present study. Of the 1 200 patients in the ED, complete information was available for 400 of them. The patients included in this group were those who received clearance for discharge from the ED specialist. Of the patients included in the current study, 56% were male, while the rest were female. Notably, the most frequent age range among the patients was 55 to 65 years.
4.2. Evaluation
To evaluate the models for the regression problem, we used R-squared (R2), mean square error (MSE), root mean square error (RMSE), and mean absolute error (MAE), which can be calculated based on Equations 1
where
| Evaluation | Models | ||
|---|---|---|---|
| RF | CB | RF + CB | |
| R2 score | 0.49 | 0.78 | 0.81 |
| MSE | 746.39 | 245.21 | 199.62 |
| MAE | 12.98 | 8.09 | 7.96 |
| RMSE | 27.32 | 15.65 | 14.12 |
Abbreviations: RF, random forest; CB, CatBoost, MSE, mean square error; MAE, mean absolute error; RMSE, root mean square error
In this study, by utilizing the RF algorithm to assess the influence of variables on the target variable, it was revealed that factors, such as age, vital signs (particularly RR), and level 1 ESI have a significant impact on the target variable (Figure 2).

The significance of each characteristic
4.3. Scenarios’ Results and Simulation
Upon thorough examination and conducting interviews with the staff in the ED, we have documented the procedure for patients entering and exiting the department, including transfers to other departments. The management of the ED has reviewed and approved the outlined process, as depicted in Figure 3. In this simulation, we assessed key areas in the ED. These areas include cardiopulmonary resuscitation (CPR), intensive care unit (ICU), yellow ward, and fast-track department. The nursing station primarily serves the yellow ward, which can accommodate up to 18 beds. Additionally, the fast-track department has a capacity of 20 beds.
 process")
Emergency departments (ED) process
The findings of the present study indicate that the arrival of patients at the ED can be described as an exponential distribution with a rate parameter of 79.1 (minutes), subtracting 0.001 from the calculated value.
After setting up the waiting room, we decided to allocate beds from the fast-track department to it. Out of the 20 beds available in the fast-track department, some were not being used. In scenario 1, we determined that assigning 6 beds to the waiting room and leaving 14 beds in the fast-track department would prevent any new patients from being without beds. Additionally, this allocation would result in a total productivity rate of 17.78. In scenario 2, we decided to reduce the number of beds in the fast-track department from 14 to 8 in order to save cost. This adjustment did not affect the treatment process for the patients who are on the fast track to recovery. Scenario 3 was designed to delve into the correlation between how long patients are expected to stay and the level of productivity. The findings revealed that if we have knowledge of a patient's anticipated LOS, we have the ability to approximate the wait time for a new patient in the ED. Additionally, this knowledge can contribute to a boost in productivity, particularly in the utilization of beds (Table 2).
| Scenario | Unit Name | Number of Beds | Average Waiting Time (min) | Average Number in Queue | Average Productivity Per Bed | Is the New Patient Without a Bed? |
|---|---|---|---|---|---|---|
| Current situation | Yellow ward | 18 | 200 | 2 | 0.94 | |
| Fast-track | 20 | 0 | 0 | 10.55 | ||
| 1 | Waiting room | 4 | 180 | 0 | 13.75 | Yes |
| Fast-track | 16 | 11.56 | ||||
| Waiting room | 5 | 204 | 0 | 7.4 | Yes | |
| Fast-track | 15 | 13.13 | ||||
| Waiting room | 6 | 143 | 0 | 3 | No | |
| Fast-track | 14 | 14.78 | ||||
| 2 | Fast-track | 13 | 0 | 0 | 15.69 | No |
| 12 | 0 | 0 | 16.9 | No | ||
| 11 | 0 | 0 | 20.09 | No | ||
| 10 | 0 | 0 | 22 | No | ||
| 9 | 0 | 0 | 24 | No | ||
| 8 | 0.57 | 0 | 33.62 | No | ||
| Scenario | Unit Name | Number of Beds | Average Productivity Per Bed | Patients' Tolerance Limit (h) | ||
| 3 | Waiting room | 6 | 19.6 | 1 | ||
| 5 | 24.8 | |||||
| 6 | 38.3 | 2 | ||||
| 5 | 48.6 | |||||
| 6 | 40 | 3 | ||||
| 5 | 50.1 | |||||
5. Discussion
This study involved two stages. In the first stage, we predicted the LOS for patients in the ED. The results highlighted several factors influencing the LOS, including age, vital signs (with a focus on RR), and level 1 ESI. An innovative combination of CB and RF models was used for the first time to make these predictions. While no prior studies directly matched the research objectives, the findings aligned with the findings of studies conducted by Hijri and Olawoyin (20) and Rahman et al. (5). The present study not only introduced a new model but also collected additional patient information. In the study of Sariyer et al. (2), the LOS was predicted using RF models, neural networks, and LR without considering vital signs upon admission. However, the present study accounted for vital signs, along with ICD-10 data and other patient information.
In phase two, we adopted a management approach and utilized DES to concentrate on finding the best way to distribute resources. Effective resource allocation is crucial in the healthcare sector for enhancing community health. However, due to limited resources, high costs, and the complex and sensitive environment, it has always been a subject of debate (21). In this phase, we introduced an innovative concept by establishing a separate area known as the waiting room. This addition allowed us to accurately determine the number of unused beds in the fast-track department, in addition to efficiently allocating beds in that particular area.
One of the limitations of this study is the omission of laboratory components and their results. As a result, it is recommended that test findings from patients in the ED be incorporated in future research endeavors.
5.1. Conclusions
This study showcases the effectiveness of leveraging both data mining and simulation techniques to efficiently handle ED resources and alleviate congestion. By combining these innovative approaches, the research demonstrates how healthcare service delivery can be enhanced, ultimately leading to better patient outcomes. The findings underline the significant potential of employing advanced analytical techniques in healthcare settings, paving the way for more optimized resource allocation and improved quality of care.
