


1. Background
The expansion of advanced technologies in various fields, including healthcare, coupled with the increase in the complexity and diversity of activities, has made it imperative to comprehend these changes and gauge their impact on organizational costs. This challenge is even more pronounced in the education sector due to the higher degree of diversity and ongoing changes within it (1, 2). Understanding these activities and assessing their effects on organizational costs necessitates the development of an appropriate costing system.
Costing and cost analysis serve as managerial tools that enable managers to acquire the necessary data for making informed decisions regarding investments in actions and infrastructure (3). The primary aim of a costing system is to accurately identify the costs associated with various activities and determine the required resources. Although some accounting writers, such as Solomons and Slabos, alluded to the connection between costs and activities in the late 1960s and early 1970s, it was not until the 1980s that academic and professional communities started giving greater attention to this relationship (4). In 1988, Cooper and Kaplan, experts in both accounting and management, published a book titled “The Missing Link”, in which they argued that activities, rather than the final product or service, were the true drivers of costs. Subsequently, they introduced a new system known as activity-based costing (ABC) (5). Activity-based costing operates on the premise that activities within an organization consume resources, and products and services are the outcomes of these activities (6).
Time-driven activity-based costing (TDABC) streamlines the initial step of cost allocation and enables the tracking of resource costs for activities using a simplified and less time-consuming approach. This model allows for real-time updates to the costing system in response to changes. It offers a consistent approach and perspective on cost estimation, accompanied by significant advantages (6). In this costing system, managers or resource management teams forecast the direct resources required for each activity or task. Subsequently, they determine resource costs based on a time equation and directly and automatically allocate them to the performed activities and operations (7). The key feature of the time-driven model is its reliance on time estimates. In complex environments, specific activities might not consistently consume the same amount of resources in every situation. Therefore, the time-driven model employs time equations to estimate the necessary resources for an activity instead of defining a separate activity for each possible process combination (8).
The discrepancy between the total cost of committed resources and allocated resources is known as a process allocation error, necessitating adjustments to rectify this error. In a time-driven model, the cost of a product is determined by the quantity of resources consumed. Resources allocated and consumed are identified as product costs, although the cost of unused resources is categorized as period costs (9).
One of the advantages of TDABC is its ability to create a precise and user-friendly model. This model can be implemented on a monthly basis to collect profitability data for the most recent operations. Furthermore, it enhances the potential for process efficiency and resource utilization, allowing for resource capacity budgeting based on predicted values and the complexity of anticipated demand orders. Additionally, maintaining the model is rapid and cost-effective (10).
The TDABC model relies on the utilization of flexible time equations and designates unused resource costs as period costs, excluding them from the calculation of total product costs (9). Utilizing TDABC methods results in more accurate cost estimates that closely align with reality. This approach can serve as the foundation for managing organizations and various departments (11). When compared to traditional ABC, the TDABC model, with time as a driver, is better suited to mitigate organizational complexities. Additionally, this model breaks down the durations of each essential process required to perform an activity into distinct activities (12).
Although numerous research studies have been conducted, only a few have explored the application of TDABC to assess student costs. Mandigo et al. examined the use of TDABC to optimize healthcare resource utilization in Mirballe, Haiti (13). Ross analyzed TDABC implementation to identify improved practices in pharmacies (14). Adioti and Valverde demonstrated in their study that TDABC serves as an effective tool for identifying cost processes. This empowers information technology department managers and supervisors to make crucial decisions regarding cost control (15).
Misono et al. conducted a study examining the advantages of the TDABC method, compared to the traditional approach, in the radiology departments of medical centers in the United States. The study supported the effectiveness of the TDABC method in healthcare service centers (16). In a study titled “Recognition of Idle Resources in TDABC and Resource Consumption Accounting Models”, Tse and Gong observed that both models, despite their differences, are significantly influenced by the ABC model (9). However, the key distinction between these two models and the traditional ABC model lies in their ability to recognize unused capacity, a common feature in both costing models (9).
2. Objectives
This system can provide information that can effectively aid in the process of preparing financial plans and operational budgets. Additionally, it can categorize and standardize activities to identify unused resources and capacities within the medical education department of the medical sciences university under study. By applying this system to other activities, it can help reduce additional costs. Given the scarcity of such studies and the demand from planners and policymakers for the results of such research, this study aimed to calculate the cost of educating and training medical students using the TDABC method.
3. Methods
The current study was a quantitative and descriptive-analytical study conducted cross-sectionally and retrospectively at one of the AJA universities of medical sciences in 2022. Time-driven activity-based costing was employed in this study. Financial, administrative, educational, and support units, along with the university student brigade and medical faculty, were utilized to collect information. Work processes were identified through interviews with relevant individuals, and field observations were conducted to assess the flow of these processes. Work measurement and time measurement of activities were also carried out. The TDABC method was implemented as follows (17):
3.1. The First Step
The identification of the university and medical school structure: In the studied structure of the University of Medical Sciences, the university presidency and three vice-presidencies (educational, research, and student), along with the support headquarters, student dormitories, and educational support spaces, were designated as overhead activity centers. The costs associated with these centers were calculated and allocated to intermediate and final activity centers.
3.2. The Second Step
The identification of activity centers in the university and faculty: Activity centers were categorized into three general groups based on the tasks they perform, including overhead, intermediate, and final centers:
3.2.1. Overhead Activity Centers
These centers provide general services and support to operational (final) and intermediate activity centers. They are not directly involved in providing services to students and employees, and the costs associated with these centers are allocated to other units.
3.2.2. Intermediate Activity Centers
These centers are responsible for providing services to operational departments, students, and employees and can function as independent cost units. In this study, activity centers within the faculty, excluding educational groups, were considered intermediate activity centers.
3.2.3. Operational and Final Activity Centers
These are departments directly engaged in the process of providing services. In this study, educational groups that offer educational services to students are considered operational and final activity centers, and they receive support from overhead and intermediate centers.
3.3. The Third Step
The identification of required resources for service provision at each activity center: Based on studies conducted in the financial systems of universities and medical schools, resources and costs in these institutions are primarily divided into 2 broad categories: (1) Current expenditures resources; (2) capital expenditures resources.
3.4. The Fourth Step
The determination of the practical capacity of resources: Practical capacity is calculated as the useful time per working day multiplied by the average number of working days per month and then further multiplied by the number of employees.
3.5. The Fifth Step
The determination of the total costs associated with each activity center and the identification of the cost of each resource, including building and equipment depreciation costs, human resource expenses, materials and consumables costs, and utilities.
3.6. The Sixth Step
The calculation of capacity cost rate: The capacity cost rate is obtained by dividing the activity center costs (utilized resources) by the practical capacity of resources employed (Equation 1).
CR: Capacity cost rate of resource, C: The resource cost, TP: The practical capacity of resource
3.7. The Seventh Step
A time study was conducted using proper methods and scientific principles for machinery and human workforce operations at the desired efficiency level, which was carried out in 2 phases as follows:
(1) Estimating the time required for service completion was accomplished by conducting interviews with employees and department heads, utilizing existing process maps, and direct observation (a time study approach using a stopwatch and note-taking). Time data were collected across multiple instances of similar activities, and their averages were calculated. The selection of visit times for recording information was entirely randomized.
(2) Construction of time equations: The final goal in this step was to reach a consensus on inevitable time standards, estimate possible time, and design time equations. The calculation of the sensitivity coefficient, difficulty of work, technicality of work, and, finally, weighting was also performed.
3.8. The Eighth Step
The calculation of the cost of each activity which is equal to the result of multiplying the activity duration by the resource capacity cost rate (steps 6 and 7).
3.9. The Ninth Step
Sharing the cost of each of the overhead and intermediate activity centers with the final activity centers and ultimately calculating the cost of each student: At this step, starting from the overhead activity centers, the cost share of each of the beneficiary centers was determined and allocated. For this purpose, first, the cost of the university presidency was distributed to the university’s vice-chancellors and other independent centers (presidency board), resulting in a total of 25 centers. Then, in the vice-chancellors, the cost-sharing from the presidency with the total internal costs of each vice-chancellor was distributed to the beneficiary centers. This process continued until the final activity centers, and during this process, costs were directly and indirectly distributed to the final centers. Finally, the final cost of each medical student was calculated based on the total distributed costs.
4. Results
The total cost of training each medical student at AJA University of Medical Sciences was estimated to be IRR 6 267 568 065 , resulting in a yearly education cost of IRR 895 366 866 per student. Out of this total cost, 42%, 40%, and 18% were allocated to the educational department, scholarships, and directly to the university and faculty’s vice-chancellors and institutes for each student, respectively. After analyzing the activities and examining the organizational structure of the university and faculty, a total of 28 activity centers were identified, comprising 7 overhead activity centers, 5 intermediate activity centers, and 16 final activity centers. Table 1 shows the activity centers in the university and faculty used to calculate the cost of medical student training.
| Types of Activity Centers | Activity Centers |
|---|---|
| Overhead | University presidency |
| Educational vice president | |
| Student vice president | |
| Research vice president | |
| Support headquarters | |
| Students brigade | |
| Sports and educational spaces | |
| Intermediate | Faculty presidency |
| Educational vice president | |
| Research vice president | |
| Administrative and support vice president | |
| Laboratories and workshops | |
| Final | Internal department |
| Surgery department | |
| Basic sciences department | |
| Anesthesia department | |
| Radiology department | |
| Children department | |
| Department of psychiatry | |
| Department of psychology | |
| Emergency medicine department | |
| Social physician department | |
| Department of physical medicine | |
| Department of forensic medicine | |
| Women department | |
| Department of health management and economics | |
| Department of Islamic studies | |
| Department of traditional medicine |
As shown in Table 1, activity centers at the university level, which provide services to all other activity centers, were categorized as overhead activity centers. Faculty-related activity centers, such as the dean’s unit and vice-chancellors, which offer services to the final activity centers (i.e., educational departments), were classified as intermediate activity centers. Finally, educational departments, supported by both overhead and intermediate centers to provide services and educate students, were designated as final or operational activity centers. The table illustrates that the final centers have the largest number of activity centers, although the intermediate centers have the fewest. Table 2 shows the cost breakdown for each of the overhead, intermediate, and final activity centers.
| Activity Centers | Total Costs (IRR Billions) | Practical Capacity of Each Center (h) | Percentage of Unused Capacity |
|---|---|---|---|
| Overhead | |||
| University presidency | 13.64 | 30.702 | 0.28 |
| Educational vice president | 25.87 | 64.022 | 0.35 |
| Student vice president | 3.65 | 17.850 | 0.44 |
| Research vice president | 14.04 | 27.608 | 0.41 |
| Support headquarters | 144.77 | 385.560 | 0.27 |
| Students brigade | 31.91 | 21.896 | 0.04 |
| Intermediate | |||
| Faculty presidency | 17.01 | 7.378 | 0.29 |
| Educational vice president | 63.56 | 40.936 | 0.38 |
| Research vice president | 9.90 | 8.330 | 0.31 |
| Administrative and support vice president | 6.90 | 9.758 | 0.24 |
| Laboratories and workshops | 50.87 | 16.660 | 0.43 |
Considering that the university presidency holds the highest position in university management, all departments and other activity centers benefit from the services provided by this entity. After calculating and allocating the costs of the university presidency to lower levels, including vice-presidencies and faculty deans, the share for each of these centers amounted to IRR 593 138 563.
This study took into account various types of activities and costs for each of the activity centers, encompassing factors such as the practical capacity of each center in terms of hours, the actual time spent on activities within each unit, the portion of the cost allocated to each activity center from salaries and benefits, the allocation of other miscellaneous costs to each center, the total cost associated with each activity center, the capacity cost rate, the extent of unused capacity in each center, the percentage of unused capacity for each activity center, and the cost associated with this unused capacity, all calculated over the course of one year.
In the directorate, the total practical capacity was approximately 30 702 hours, of which 22 134 hours were effectively utilized. Consequently, around 28% of the capacity went unused, resulting in IRR 3 870 061 107 remaining unutilized out of the total cost of IRR 13 642 186 948 .
In this study, university vice-chancellors were positioned at the second level, and the costs associated with the vice-chancellor activity centers were computed and subsequently allocated to the centers and students who benefited from their services. After determining the costs of the educational vice-chancellor of the university, the cost distribution to beneficiary centers, including faculties and students, was determined based on their level of utilization of the educational vice-chancellor’s services. The average cost distribution per faculty member and student from the expenses of this deputy amounted to IRR 3 742 422 546 and IRR 6 117 675, respectively.
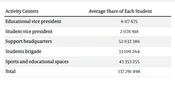
Additionally, the costs of other vice-chancellors and activity centers were calculated, and the expenses were distributed among the users of their services, which included faculties, employees, and students. Considering that all activities conducted in the student brigade are exclusively in service of the students, all associated costs were shared among the students, with the average cost per student in the study year totaling IRR 33 109 264. Finally, the costs related to educational and sports facilities were distributed among students and employees. The costs allocated to each student for the study year from the overhead education centers are detailed in Table 3.
| Activity Centers | Average Share of Each Student |
|---|---|
| Educational vice president | 6 117 675 |
| Student vice president | 2 078 918 |
| Support headquarters | 52 632 386 |
| Students brigade | 33 109 264 |
| Sports and educational spaces | 43 353 255 |
| Total | 137 291 498 |
The total costs that were directly allocated to the students from the overhead educational centers amounted to IRR 137 291 498 per student in one year. Similarly, the costs associated with the intermediate activity centers in the medical school were calculated and distributed in a manner consistent with the overhead activity centers. Table 4 shows a breakdown of the costs directly allocated to students from the intermediate activity centers, presenting the costs per student for one year from each of these activity centers.
| Activity Centers | Average Share of Each Student |
|---|---|
| The average share of students from the budget of the college | 2 277 657 |
| Educational vice president | 16 889 320 |
| Administrative and support vice president | 1 404 502 |
| Research vice president | 5 893 126 |
| Total | 26 464 605 |
Table 5 shows the total costs of each educational department, including the salaries of faculty members and the total costs shared from the overhead and intermediate activity centers to them in one year.
| Departments | Total Costs of Each Department |
|---|---|
| Internal department | 11 999 067 534 |
| Surgery department | 9 462 183 193 |
| Department of basic sciences | 83 825 646 590 |
| Department of anesthesia | 5 310 917 906 |
| Department of radiology | 4 849 666 208 |
| Department of children | 4 619 040 359 |
| Department of psychiatry | 4 157 788 660 |
| Department of psychology | 3 927 162 811 |
| Department of emergency medicine | 3 927 162 811 |
| Department of social medicine | 3 696 536 962 |
| Department of physical medicine | 3 696 536 962 |
| Department of forensic medicine | 3 235 285 263 |
| Department of women | 3 235 285 263 |
| Department of health management and economics | 3 927 162 811 |
| Department of Islamic studies | 4 856 332 593 |
| Department of traditional medicine | 8 039 738 296 |
| Total | 162 765 514 222 |
Finally, Table 6 shows the cost components and the total cost of each medical student’s education over 7 years.
| Cost Groups | Direct Costs from Vice Presidents and Other Parts of the University and Faculty to Each Student | Cost Share of Each Student from the Educational Departments | Received Scholarship of Each Student | The Total Cost of Educating Each Student in 7 Years |
|---|---|---|---|---|
| Cost per student in 7 years | 1 146 292 723 | 2 601 275 341 | 2 520 000 000 | 6 267 568 065 |
| Percentage of total costs | 18 | 42 | 40 | 1 |
5. Discussion
In this study, student expenses were categorized into 3 groups: (1) salaries or scholarships; (2) expenses incurred by educational departments; and (3) expenses directly allocated to students from overhead and intermediate activity centers (eg, educational and sports facilities). The respective cost shares for each group were 40%, 42%, and 18%. In the educational departments, the basic sciences department accounted for approximately 52% of the total departmental costs, with the internal group ranking second at 7% of the total costs.
The significant cost difference in the basic sciences department can be justified to a large extent due to the presence of numerous subgroups and laboratories in this department. Although the primary focus of educational costs in the university is typically on the educational departments, ultimately benefiting the students, the expenses incurred from this segment are not significantly different from the expenses related to student salaries and benefits.
One of the advantages of the TDABC method is the calculation of unused capacity. In this study, the average unused capacity in overhead and intermediate activity centers was 30% and 33%, respectively. The highest levels of unused capacity in the overhead and intermediate activity centers, at 44% and 43%, respectively, were observed in the student vice-chancellor’s office and the laboratories. Consequently, these departments effectively utilize only 56% and 57% of their practical capacity, highlighting the need to optimize human resources and activity center capacities, particularly in these areas. Potential improvements in productivity can be achieved through the reallocation and revision of labor force distribution within these departments.
Among all activity centers, the student brigade demonstrated the highest productivity, with only 4% unused capacity. The findings of this study revealed that approximately 40% of student expenses are associated with salaries and benefits paid to personnel. This trend is consistent across various activity centers, especially in intermediate and final centers, where expenses related to personnel salaries and faculty members constitute a significant portion of the costs. This finding aligns with the results of Daroudi and Zemandi’s study (1).
Given that educational institutions, such as faculties, heavily rely on human resources, particularly faculty members, and that students receive scholarships in the studied university, it is imperative to prioritize human resources management and enhance efficiency and productivity through targeted programs and initiatives.
To improve the implementation process of the TDABC system, it will be very helpful to provide the following conditions: The implementation of the accrual accounting system at the university (2) signifies a shift toward recording transactions and other events at the time of their occurrence, regardless of when cash is received or paid. In simpler terms, all revenues, services rendered, purchases, and sales of goods are documented in the accounting software as they occur.
Accrual accounting, with the goal of transparency, involves adopting comprehensive accounts and presenting financial reports. This encompasses the preparation of consolidated financial statements, aggregated totals, and periodic performance reports in an organization. It also contributes to transparency by calculating allocated costs and effectively managing expenses. In the TDABC model, when time spent and practical capacity are accurately calculated, it provides valuable information. Moreover, it offers insights into unused capacities, which were not accounted for in the previous ABC system.
Furthermore, this model serves as a valuable tool for enhancing operations, reducing non-value activities, and integrating similar tasks. Additionally, because the model furnishes accurate and reliable information, it is strategically utilized to assess efficiency, productivity, cost savings, and overall managerial performance. However, the precision of the system hinges on the accuracy of estimated time factors. Any errors or deviations at this stage can lead to incorrect cost allocation.
Despite its design to address the shortcomings of the ABC method, the TDABC method had its limitations. These limitations include challenges related to identifying activities for implementation, establishing practical capacity cost rates, estimating managers’ time for each activity, determining unused capacity, and reliance on time equations. Additionally, issues with accuracy and data limitations are also present. Therefore, when implementing this cost method, it is crucial to carefully consider its structural assumptions and tailor them to the specific practical conditions of the organization being studied before implementation (18).
5.1. Suggestions to Control Costs and Increase Productivity
(1) To support senior management’s need for accurate information regarding resource consumption and expenses for effective decision-making in university management, it is strongly recommended that the TDABC approach be integrated into the university’s policies and strategies. Utilizing this model to obtain precise cost information and conducting accurate cost and activity analyses can lead to the delivery of higher-quality services, increased efficiency, and reduced costs.
(2) Efforts are underway to enhance the accuracy of expense recording at the university. Currently, due to weaknesses in the expense recording system in this organization and numerous government entities, certain expenses, particularly depreciation costs, go unnoticed by managers. This issue can significantly impact managerial decision-making. Providing appropriate training to employees in financial, engineering, procurement, and logistics units can be instrumental in addressing this issue.
(3) Given the wear and tear, aging, and potentially improper use of many facilities, equipment, and vehicles at the university, which contribute to increased energy and maintenance costs, it is advisable to take steps, such as constructing new facilities with suitable materials, replacing the transportation fleet, installing modern equipment, and providing necessary training, to enhance employee productivity.
(4) Considering the substantial unused capacity at the university and medical school, particularly among faculty members, which results in significant costs, it is recommended to attract more students, especially guest students, tuition-paying students, and those from other countries, to reduce overall overhead costs.
(5) It is apparent that a review of the processes and activities conducted at the university could potentially lead to cost reduction. This can be achieved through employee training and by fostering a higher level of service motivation among staff.
(6) It is recommended to focus on services with high total costs and conduct a reevaluation of related activities and workflows. Activities that are not perceived as value-generating by managers should either be eliminated or modified.
5.2. Limitations
In the course of conducting scientific research, there are often conditions that are beyond the researcher’s control. The current study is no exception, and the issues and limitations that affected the research are as follows:
(1) One of the most significant challenges in conducting this study was the extensive and comprehensive nature of the required information. Considering that multiple cost resources are involved in the education and training of medical students, and there is no centralized repository of this information, collecting the necessary data proved to be a time-consuming task, requiring consultations with numerous individuals.
(2) Given that the university operates within a military environment, where information disclosure is restricted, obtaining information was consistently problematic. Employees often encountered difficulties in providing information and required permissions from higher authorities.
(3) Some of the information used in the study pertained to the practical functions of employees, leading to a tendency for them to provide information that may not entirely reflect reality. Accurately calculating this data proved challenging and necessitated careful analysis. Consequently, due to limitations in accessing information, practical, functional, and unused capacities within educational groups were not estimated.
(4) As the required information was gathered through interviews with university staff, obtaining their consent for interviews was, at times, difficult and occasionally unattainable.
5.3. Conclusions
This study estimated the average cost of each medical student to be approximately IRR 6 267 568 065. This study also revealed an average unused capacity of 30% and 33% in overhead and intermediate activity centers, respectively, underscoring the significant unused capacity within university and faculty activity centers. Therefore, the effective management of human resources and equipment is imperative to enhance service delivery processes, boost productivity, and reduce unused capacity.
