

1. Background
Chronic kidney disease (CKD) includes various conditions affecting the structure and function of the kidneys. In 2002, a significant paradigm shift occurred, recognizing CKD as a critical global public health issue and highlighting the necessity of early intervention by general internists. The classification and management of CKD are based on stages that reflect the severity of the condition, assessed through the glomerular filtration rate (GFR), albuminuria, and clinical diagnosis (including cause and pathology). Routine laboratory tests can identify CKD, and specific treatments exist to prevent its progression, reduce complications associated with decreased GFR and cardiovascular risks, and improve survival rates and quality of life (1). Chronic kidney disease represents a considerable health burden worldwide, affecting about 10 - 15% of the population. It stands as a leading cause of morbidity and mortality among non-communicable diseases. Early detection of CKD is essential for reducing its negative impact on patients' health. By promptly and accurately diagnosing CKD, healthcare providers can timely administer appropriate treatments, lowering the risk of complications, such as hypertension, anemia, mineral bone disorder, poor nutritional status, acid-base imbalances, and neurological complications. Early intervention is crucial for alleviating these health issues and enhancing patient outcomes (2).
Artificial intelligence (AI) equips computer programs with the capability to perform tasks and reason in ways akin to human intelligence. It excels in making precise decisions in the face of ambiguity, uncertainty, and large volumes of data. In healthcare, where an abundance of data, such as clinical symptoms and imaging features, is present, machine learning (ML) algorithms come into play to organize and classify this information effectively. Essentially, ML is a technique that utilizes pattern recognition to assist in this process (3). Healthcare organizations are adopting machine-learning methods, like artificial neural networks (ANNs), to improve the quality of care while reducing costs. Artificial neural network is widely recognized for its diagnostic applications, but its use is extending to support decision-making in healthcare management. This successful integration of ANN enables healthcare providers to make informed and efficient decisions, benefiting both patients and the overall healthcare system (4).
Debal and Sitote (2) compared the performance of random forest (RF), support vector machine (SVM), and decision tree (DT) models in predicting CKD. Their findings indicated that the RF model surpassed traditional models in accuracy and predictive power, suggesting that using the RF model could enhance CKD predictions over conventional methods. Bai et al. (5) aimed to determine whether ML could effectively predict the risk of end-stage renal disease (ESKD) in patients with CKD. They tested five ML algorithms (logistic regression, simple Bayes, RF, DT, and K-nearest neighbor) using five-fold cross-validation. The performance of each model was compared to the kidney failure risk equation (KFRE). The results showed that three ML models, specifically logistic regression, simple Bayes, and RF, had comparable predictive abilities and higher sensitivity compared to KFRE. Yashfi et al. (6) analyzed the records of 455 patients using two models, RF and ANN, to predict the risk of CKD. Their analysis found that the RF model achieved an impressive accuracy rate of 97%, while the ANN model had an accuracy of 94%.
According to the study by Islam et al. (7), the XGBoost model was found to surpass other models, like RF and CatBoost (CB), in predicting the risk of CKD, demonstrating an impressive accuracy rate of 98%. Singh et al. (8) introduced an innovative deep neural model that accurately predicts the risk of CKD, notably incorporating a range of critical characteristics, such as hemoglobin, specific gravity, serum creatinine, red blood cell count, albumin, packed cell volume, and blood pressure. Their comprehensive approach significantly enhanced the accuracy of disease predictions. Almansour et al. (9) applied ANN and SVM techniques in their research, addressing missing values by substituting them with the feature means in the dataset. They meticulously fine-tuned ANN and SVM by adjusting parameters through extensive experimentation to identify optimal configurations. Their efforts resulted in reliable models for both techniques, with experimental results showing that ANN outperformed SVM, achieving an extraordinary accuracy of 99.75%, while SVM attained 97.75% accuracy.
Mondol et al. (10) compared various optimized neural networks against conventional neural networks to identify the most effective model for a specific task. Their findings indicated that optimized models generally performed better than traditional models. Among the conventional models evaluated, the convolutional neural network (CNN) recorded the highest validation accuracy of 92.71%. However, the optimized models, including the optimized convolutional neural network (OCNN), optimized ANN (OANN), and optimized long short-term memory (OLSTM), achieved even higher accuracies of 98.75%, 96.25%, and 98.5%, respectively. Notably, the OCNN model secured the highest area under the curve (AUC) score of 0.99, showcasing superior performance. It also demonstrated the shortest data collection time for classification, at only 0.00447 seconds, marking it as the most efficient model for CKD detection.
2. Objectives
In this study, our objective was to evaluate and compare the effectiveness of various machine learning models in predicting the occurrence of CKD. Our exploration goes beyond simple prediction to assess the performance of these models thoroughly. Through this analysis, we aim to uncover the most efficient methods for identifying individuals at risk of CKD. Leveraging machine learning, our research seeks to make significant contributions to the improvement of CKD diagnosis and prevention strategies.
3. Methods
The cross-industry standard process for data mining (CRISP-DM) serves as a reliable guide for data mining and analytics projects across various sectors. It directs the entire project from understanding business objectives to applying data mining techniques, evaluating outcomes, and implementing solutions in real-world scenarios. This approach is popular and widely recognized for its ability to structure projects, foster collaboration, and efficiently derive valuable insights from data (11).
3.1. Data Collection
We compiled a dataset from a hospital in Tehran containing records of 400 patients. The dataset includes some missing values. It focuses on 24 clinical features critical to predicting the prognosis of CKD. A key element is the class feature, which indicates whether a patient is suffering from chronic renal failure. The class feature has two possible values: “Yes,” signifying the presence of chronic renal failure, and “no,” indicating its absence. Detailed information about the data characteristics can be found in Table 1.
| Features | Feature Type |
|---|---|
| Age (y) | Numeric |
| Albumin | Numeric |
| Anaemia | Binary |
| Appetite | Binary |
| Bacteria | Binary |
| Blood glucose random | Numeric |
| Blood pressure | Numeric |
| Blood urea | Numeric |
| Coronary artery disease | Binary |
| Diabetes mellitus | Binary |
| Haemoglobin | Numeric |
| Hypertension | Binary |
| Pus cell | Binary |
| Pus cell clumps | Binary |
| Packed cell volume | Numeric |
| Pedal edema | Binary |
| Potassium | Numeric |
| Red blood cells | Binary |
| Red blood cell count | Numeric |
| Serum creatinine | Numeric |
| Specific gravity | Numeric |
| Sodium | Numeric |
| Sugar | Numeric |
| White blood cell count | Numeric |
3.2. Data Preprocessing
The dataset utilized for training and validation was free of duplicate values, ensuring the uniqueness of each data point. Furthermore, any missing values within the dataset were imputed using the mode, which is the most frequently occurring value in their respective columns. This method ensured the completeness and readiness of the dataset for analysis. For most machine learning algorithms to process the data, it is necessary to convert categorical values into numerical values, a process known as encoding. In this context, binary values, “0” and “1”, are typically employed to represent categorical attributes. For example, “0” might denote the absence of a feature (e.g., “no”), and “1” could indicate its presence (e.g., “yes”). This conversion allows algorithms to process and learn from the encoded data efficiently. Outliers are data points that deviate significantly from the majority of the dataset, potentially arising from measurement errors or experimental anomalies. The presence of outliers can adversely affect the performance of machine learning algorithms, leading to extended training durations, diminished model accuracy, and suboptimal results. To mitigate this, the study applied the interquartile range (IQR) method to detect and remove outliers before introducing the data into the learning algorithm (12). This strategy aimed at improving the overall quality and dependability of the learning process. Data transformation modifies numerical values to prevent any single variable from dominating the others. Without this transformation, learning algorithms might incorrectly assume larger values to be of higher importance and smaller values to be of lesser importance, regardless of their actual significance (13). As part of the data preparation process, features were normalized to a uniform range of values between 0 and 1. This normalization technique, referred to as min-max normalization, was implemented using a specific formula outlined in Equation 1.
Where, xi is the ith characteristic, and min(xi) and max(xi) are the minimum and maximum values of Xi, respectively.
Next, we separated the data into training and testing, and we considered 80% of the data for training.
3.3. Modeling
3.3.1. Ensemble Models
Ensemble models are learning algorithms designed to enhance prediction accuracy by aggregating the predictions from multiple individual models. Rather than depending on a singular model, ensemble models draw on the collective insights of numerous models. They comprise two primary elements: Base models and a method for combination. The base models may consist of different algorithms or variations of a singular algorithm, each trained on distinct subsets of the data. These models independently produce varied predictions. The method of combination dictates the manner in which the base models' predictions are merged to form the final ensemble prediction. By harnessing the strengths of various models to offset their weaknesses, ensemble models achieve superior overall performance, offering greater robustness and more precise predictions for unseen data. Notable examples of ensemble models include RF, gradient boosting machines (GBM), AdaBoost, and bagging (14).
3.3.1.1. CB Classifier
The CB Classifier is a machine learning algorithm specifically designed to address predictive tasks involving categorical features. It enhances gradient-boosting methods with the goal of delivering high-performance predictions while efficiently managing categorical data. CatBoost employs an ordered boosting approach, amalgamating decision trees into a robust ensemble model. It adeptly handles categorical features through techniques such as feature value permutations, encoding them into numerical formats automatically. A notable strength of CB is its proficiency in processing categorical features with high cardinality without requiring extensive preprocessing. Additionally, it effectively manages missing values in categorical variables and demonstrates strong performance even with limited training data by adeptly preventing overfitting (15).
3.3.1.2. RF Classifier
The RF Classifier is a well-regarded machine learning algorithm within the ensemble learning category, utilized for both classification and regression tasks. This algorithm aggregates the predictions from numerous decision tree models to yield accurate forecasts. The term “random forest” derives from its methodology of constructing a multitude of decision trees, each independently trained on random data subsets from the training set. This injection of randomness diversifies the trees, mitigating overfitting and thereby enhancing the model's ability to generalize to new, unseen data (16).
3.3.2. Artificial Neural Network
Artificial neural networks are computational models inspired by the structure and function of biological neural networks, such as those found in the human brain. Widely applied in machine learning for classification, regression, pattern recognition, and data clustering, ANNs are composed of interconnected units known as artificial neurons or nodes arranged in layers. The most prevalent form of ANN is the feedforward neural network, characterized by unidirectional data flow from the input to the output layer, devoid of any cyclic paths (17).
3.4. Evaluation
During the evaluation phase, the performance of classification problems is typically measured using a variety of metrics. Four key metrics include accuracy, precision, recall, and the F1-score, which can be calculated using specific Equations 2-5 (18):
- A true positive (TP) occurs when the actual and predicted classes of data points are both labeled as 1.
- A true negative (TN) occurs when the actual and predicted classes of data points are both labeled as 0.
- A false positive (FP) arises when the actual class of the data point is 0, but it is incorrectly predicted as 1.
- A false negative (FN) happens when the actual class of the data point is 1, but it is incorrectly predicted as 0.
The receiver operating characteristic (ROC) curve provides a graphical representation of a binary classifier's performance as its decision threshold is varied. It is widely used in data mining and machine learning for evaluating classifier effectiveness. The area under the ROC curve (AUC) is a metric for assessing the classifier's performance, with a larger area indicating a more proficient model (19).
In the context of ANN, a loss function is a mathematical equation that evaluates the network's performance during training by quantifying the discrepancy between the network's predicted outputs and the actual outputs (ground truth). The objective of the ANN is to minimize this loss function since a lower loss signifies superior performance. Accuracy per epoch in ANN measures the network's ability to correctly classify or predict outputs on a validation or test dataset after each training epoch. It is usually presented as a percentage, denoting the proportion of accurately classified or predicted samples relative to the total samples in the dataset (20).
4. Results
Upon analyzing the records of 400 patients, the average age was found to be 43 years, with a standard deviation of 17. The analysis revealed that 62% of the patients suffered from CKD, while the remaining 38% did not have the condition.
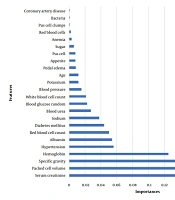
Using the RF algorithm, we investigated the impact of various factors on the target variable. The analysis yielded compelling evidence that serum creatinine, packed cell volume, specific gravity, and hemoglobin had the most significant influence compared to other variables studied. Figure 1 graphically illustrates the effects of the other variables.

The importance of variables on the target variable
For the ANN architecture, a configuration with two hidden layers was utilized. The first hidden layer contained 10 neurons, and the second hidden layer comprised 7 neurons. Given the binary classification nature of the problem, the sigmoid activation function was used in the output layer. To assess the ANN model's performance, 20% of the data was set aside for validation. Throughout the training phase, accuracy per epoch was monitored to evaluate the model's effectiveness at various intervals. Likewise, the loss function was calculated for each epoch to track the model's convergence and optimization processes (Figure 2).

Loss function and accuracy per epochs
Overall, these metrics provided insights into the development and efficiency of the ANN model. Table 2 offers a detailed comparison of the classification evaluation criteria for the models. The results conclusively showed that both the CB and RF models demonstrated exceptional and comparable performance, outperforming the ANN. Subsequently, we utilized the ROC curve for a more precise comparison of the classifiers (Figure 3). Our research marked a significant achievement by attaining high accuracy in disease prediction with a reduced set of variables. Focusing on Figure 1, we identified 10 critical predictors: Serum creatinine, packed cell volume, specific gravity, hemoglobin, hypertension, albumin, red blood cell count, diabetes mellitus, sodium, and blood urea. By analyzing these variables, we were able to predict the disease accurately, highlighting the potential for improved diagnostic processes.
| Models | Accuracy | Precision | Recall | F1-Score |
|---|---|---|---|---|
| CatBoost | 1.00 | 1.00 | 1.00 | 1.00 |
| Random forest | 1.00 | 1.00 | 1.00 | 1.00 |
| Artificial neural network | 0.87 | 0.78 | 0.84 | 0.81 |
 curve")
The receiver operating characteristic (ROC) curve
5. Discussion
Despite advancements in surgical care and treatment, CKD continues to pose a substantial health challenge. Researchers globally are dedicating efforts to developing effective strategies for diagnosing, treating, and preventing CKD. Through the analysis of medical data and identification of key features associated with the disease, healthcare professionals can better predict CKD at its early stages, thereby complementing clinical assessments and enhancing patient care. Early detection of CKD risk is paramount. Healthcare providers are increasingly concentrating on devising methods and tools for predicting the likelihood of CKD before it advances.
This study illustrated that by employing machine learning techniques, the risk of CKD can be predicted with remarkable precision. Indeed, the findings of this research unveiled an exceptional accuracy rate of 100% in identifying CKD risk. The adoption of such sophisticated computational methods holds the promise of transforming early risk detection, enabling timely interventions and preventive strategies to reduce CKD's impact. Our study's results align with those of Singh et al. (8), yet our research adopted a distinct methodology by contrasting the proposed model with individual classifiers, specifically conducting an evaluation between ANN and ensemble models. For future research, it is strongly advised to focus on predicting mortality among patients with CKD.
5.1. Conclusions
Notably, the ensemble models in this study not only showcased remarkable speed but also superior accuracy. These findings highlight the potential of ensemble models as an effective instrument for enhancing predictive performance in similar research endeavors.
