1. Background
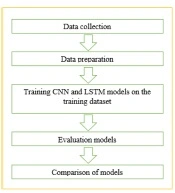
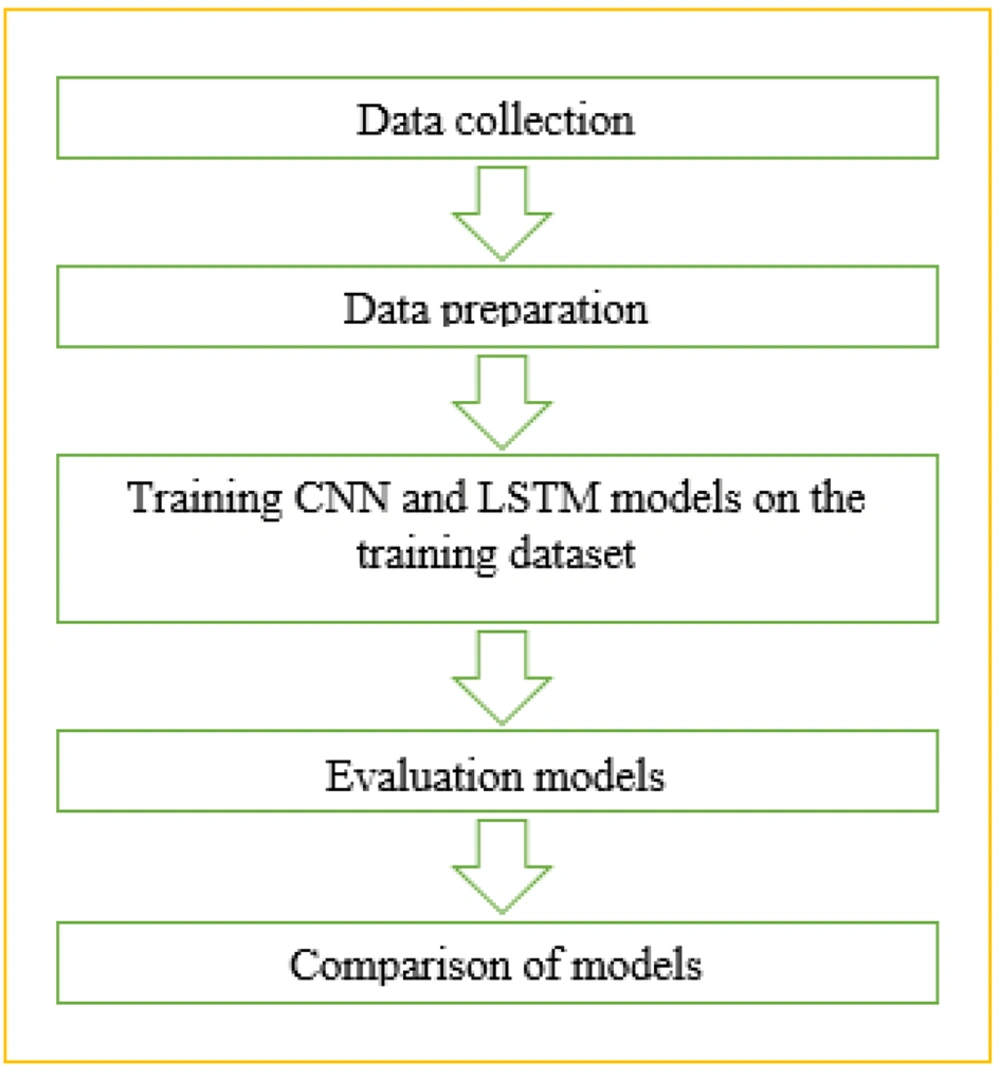
Healthcare has emerged as one of the largest industries globally, with the emergency department (ED) being a vital component of these services and experiencing high demand (1). Overcrowding in hospital emergency departments has become a significant public health issue worldwide in recent decades, with ample evidence demonstrating its adverse effects, such as delays in treating critically ill patients, patient dissatisfaction, increased mortality, and higher rates of medical errors (2). The American College of Emergency Physicians defines ED crowding as a situation where the demand for emergency services surpasses the available resources for patient care in the emergency department, hospital, or both. Therefore, congestion occurs when the demand exceeds the supply of medical services, a challenge faced by various hospital departments due to their limited resources (3). Achieving optimal resource allocation in the healthcare sector and enhancing the overall health of society are crucial goals, albeit challenging, due to limited resources, high costs, and the sensitive nature of healthcare conditions (4). Consequently, determining the optimal volume of patients entering the ED is critical for effectively allocating resources. Past research has indicated that hybrid models may not necessarily outperform component models, highlighting the importance of exploring various reliable models with high predictive accuracy for forecasting the number of newly hospitalized patients using alternative data sources (5). Past studies have utilized meteorological and calendar information to estimate the rate of patient admissions to the ED, as these factors influence patient behavior upon entering the ED (6-8). Previous research has shown that the LSTM model outperforms other models in predicting hourly data, while simpler models have often been more effective than ensemble models in predicting the daily number of ED admissions (9). Another study focused on predicting the admission rate of patients with mental disorders, employing a combination of CNN and LSTM neural networks. It was found that the stacked ensemble of CNNs and LSTMs outperformed individual LSTM and CNN models (10). Additionally, previous research compared univariate and multivariate prediction models for forecasting ED patient arrivals during the COVID-19 epidemic, concluding that HW univariate modeling is suitable for short-term forecasting (11). Figure 1 illustrates the fundamental steps forming our research framework.
2. Objectives
Based on the timing of data collection, our objective was to forecast the volume of patient admissions to the ED under both epidemic conditions like COVID-19 and non-epidemic scenarios. Furthermore, we aimed to compare the performance of the LSTM and CNN models.
3. Methods
3.1. Data Collection and Design
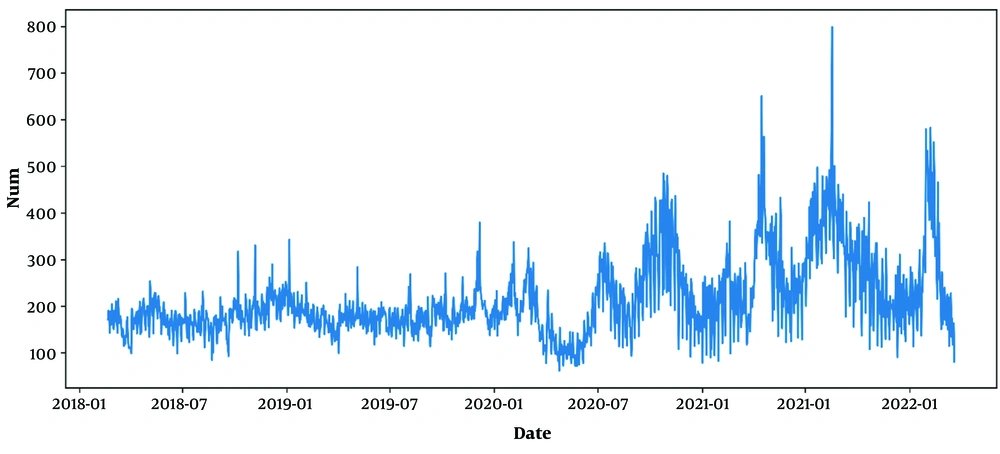
The collected data encompasses three main categories. The first category pertains to air pollutants, which were provided by the Tehran Air Quality Control Organization. The second type of data is associated with the Iran Meteorological Organization, and finally, we gathered information on the number of patients admitted to the ED of a hospital in Tehran (Table 1). In our datasheet, we also incorporated the binary representation of epidemic and non-epidemic conditions. The data collection period spans from February 2018 to March 2022. The selection of data types and predictors was informed by expert opinion and previous studies. We aggregated the averages of the predictors recorded by each air quality control station and the Iran Meteorological Organization. To facilitate a comprehensive review, we depicted the volume of ED patient admissions over four years in Figure 2.
| Provider | Features | Description |
|---|---|---|
| Meteorological organization | Temperature | Maximum temperature (tmax) |
| Minimum temperature (tmin) | ||
| Average temperature (tm) | ||
| Relative humidity | Maximum relative humidity (umax) | |
| Minimum relative humidity (umin) | ||
| Average relative humidity (um) | ||
| Wind and rain | Maximum wind speed (ffmax) | |
| Average wind speed (ffm) | ||
| Total rainfall during the last 24 hours (rr) | ||
| Air quality control organization | Air pollutants | CO, O3, NO2, SO2, PM10, PM2.5 |
| Selected hospital | Number of patients admitted to the ED | Integer number |
| Ministry of Health | Epidemy | Binary |
Description of Features
3.2. Data Preprocessing
The daily data collected over these four years exhibited no missing or duplicate values. An essential aspect to consider when analyzing time series data is whether it is stationary or non-stationary. A time series is considered stationary when its mean, covariance, and autocorrelation remain constant over time, meaning that observations do not depend on time. Predicting non-stationary time series is complex and often impossible (12). The Dickey-Fuller test, introduced by Dickey and Fuller in 1979, is used to assess the stationarity of time series data. The null hypothesis of this test assumes non-stationarity, while the alternative hypothesis suggests stationarity (13). Hence, we utilized the Dickey-Fuller test to evaluate the stationarity of our data.
To facilitate further analysis, features were normalized to fall within the range [0,1] using the min-max normalization method as defined in Equation 1 (14).
In this equation, xi represents the ith characteristic, while min (xi) and max (xi) denote the minimum and maximum values of Xi, respectively.
Subsequently, we partitioned the data into training and testing sets, allocating 80% of the data for training purposes. Finally, the feature vector comprised the current date's values of air pollutants and meteorological variables, along with the values of these variables from the previous \( N \) days. Additionally, the output values from the last N days were appended to the input feature vector.
3.3. Models
A subset of artificial intelligence (AI) methods known as machine learning learns the principles of interpretation from training data and applies them to new data within the same field to make intelligent decisions. Deep learning (DL) is a subset of machine learning that has recently garnered significant attention (15). One of the terms synonymous with DL is artificial neural networks (ANNs) (16). ANNs simulate the human brain, where neurons serve as processing units with inputs and outputs governed by activation functions (17). Analyzing multivariate weather time series data involves handling large datasets, making DL algorithms powerful tools for investigation (18). Long short-term memory (LSTM) is a robust recurrent neural system that represents an enhanced version of Recurrent Neural Networks (RNNs). Typically, when learning long-term dependencies, vanishing gradient problems may occur, which LSTM networks effectively address (19). LSTM units incorporate gates to discern which data in a sequence should be retained or discarded, including input, output, and forget gates, along with a cell with a self-reconnect connection. LSTM units are updated at each time step based on Equations 2 to 6.
Where
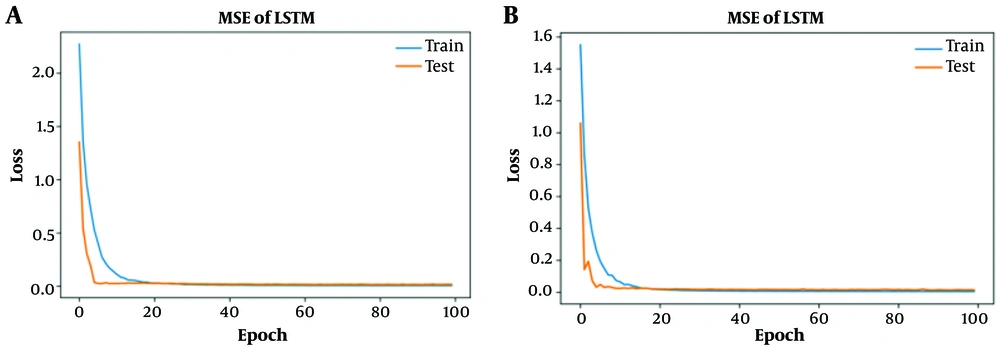
LSTM networks can overcome the limitations of traditional time series forecasting techniques by accommodating nonlinear data (20). Convolutional neural networks (CNNs) function similarly to traditional ANNs, comprising neurons optimized through self-learning (21). A noteworthy aspect of CNN networks is their utility for pattern discovery and extraction of horizontal relationships among multidimensional variables (22). The structure of CNN networks typically includes input layers, convolution layers, pooling layers for dimensionality reduction, and fully-connected layers (23). For model development, we independently designed LSTM neural networks and CNNs, considering various time windows of previous days. Figure 3 indicates the loss function for models.
3.4. Software
The Keras and TensorFlow libraries in Python software, along with the Google Colab environment, facilitated model execution. In terms of hardware, our system utilized an Intel i5 2.53 GHz CPU with 8 GB installed memory
4. Results
There were 319 880 patient arrivals to the ED between February 2018 and March 2022. Among these, 221 349 were male, and 98 531 were female. In the absence of a COVID-19 epidemic, the daily arrival of patients to the ED averaged 180 people. The highest number of arrivals during the COVID-19 epidemic conditions was 799. The root mean square error (RMSE) and mean absolute error (MAE) are widely used as standard statistical measures to evaluate model performance (24). Therefore, we utilized these two criteria to assess and compare the models. RMSE and MAE can be calculated using Equations 7 to 9.
Where Pi and Ai represent the predicted value and the actual value of the number of arrival patients to the ED for the ith test record, and for RMSE and MAE, smaller values are preferred. Another evaluation criterion is the MSE, which can be calculated using Equation 8.
Table 2 presents the evaluation of the models considering different time windows of past days. According to the table, LSTM had the lowest RMSE and MAE in the time window of the last seven days, while CNN performed even better than LSTM in the time window of the previous 13 days. To further monitor the models' performance on training and testing data based on the MSE criterion, we depicted the best performance of each model according to the time window of the previous day. Another noteworthy point is the execution time of building the model based on the training data. It took one minute and 23 seconds to construct CNN, while LSTM took two minutes and 24 seconds.
| Time Window, d | ||||||||||
|---|---|---|---|---|---|---|---|---|---|---|
| 1 | 4 | 7 | 10 | 13 | ||||||
| Models | RMSE | MAE | RMSE | MAE | RMSE | MAE | RMSE | MAE | RMSE | MAE |
| LSTM | 0.151 | 0.111 | 0.136 | 0.102 | 0.130 | 0.095 | 0.142 | 0.113 | 0.135 | 0.105 |
| CNN | 0.162 | 0.120 | 0.142 | 0.105 | 0.122 | 0.094 | 0.129 | 0.097 | 0.11 | 0.089 |
Evaluation Models by Considering Time Windows of Different Previous Days
5. Discussion
Time series analysis is crucial in various fields, including finance, medicine, and aerospace, as forecasting demand has been appealing for suppliers. Time series data comprises measurements over time that depict system behavior (25). In medicine, predicting the rate of patient admissions to the ED aids managers in resource planning, which can mitigate crowding in this department. In this study, statistical analysis revealed positive correlations between air pollutants, temperature, epidemics, and the arrival rate, with epidemics and sulfur dioxide (SO2) exhibiting the highest correlations, respectively. Conversely, wind and humidity showed negative correlations. DL offers numerous advantages in automatically extracting and understanding multivariate data features, making it suitable for vast datasets with high computational requirements. Therefore, we employed DL algorithms like CNN and LSTM to analyze time series data and predict future trends.
However, this study has several limitations. Firstly, we only examined data from one hospital in Tehran. By making slight adjustments to the prediction models and incorporating data from other hospitals, we can generalize the models to EDs in different hospital settings. Secondly, the study's results are limited to our geographic area's climatic characteristics, emphasizing the need for caution when applying these findings to hospitals in other geographic regions.
Also, we did not consider snowy weather conditions in this study. Additionally, the study did not evaluate patient grouping based on diagnosis or severity. Given the resource constraints in the ED, effective resource management is vital. Accurately predicting patient arrivals can significantly improve resource allocation and management in the ED. In future studies, we aim to employ a combined CNN and LSTM model known as a stack ensemble to predict hourly patient arrivals to the ED and identify peak arrival hours
5.1. Conclusions
This study concludes that DL algorithms are well-suited for analyzing multivariate time series data, with the CNN model exhibiting the lowest prediction error. The study indicates a positive correlation between air pollutants and ED patient arrival rates, suggesting that policy interventions should target reducing air pollutants to mitigate ED overcrowding, particularly in the absence of COVID-19.


