1. Background
Exercise and physical activity can be an effective way for maintaining health and fitness in different age groups and populations (students, soldiers, elderly, etc.) (1, 2). Benefits of exercise include increasing functional capacity (aerobic capacity, skeletal muscle strength and flexibility), cardiovascular function improvement, cardiovascular diseases risk factors reduction (via modifying lipid profile, glucose tolerance and blood pressure) and other benefits (2, 3).
Decrease in total cholesterol (TC), low-density lipoprotein cholesterol (LDL-C), triglyceride (TG) and elevations in high-density lipoprotein cholesterol (HDL-C) are favorable changes observed after exercise. Changes are associated with maintenance of health and prevention of disease (4-6). Resistance and aerobic exercises are both recommended as part of an overall strategy to modify lipid profiles (7, 8). Many studies reported that even a single session of exercise could affect blood lipid profile (9-11). However, in most previous studies, plasma lipid levels were examined before and after one session of prolonged exercise such as a marathon run (12-14). Results of studies examining acute effect of aerobic exercise on plasma lipid profile are contradictory (15). There is a little study regarding the effect of resistance exercise on lipid profile (16). Most of these investigations examined lipid profile response after exercise in male (17, 18) and there are little researches on women (19).
In the second half of the twenty century, the hypothesis of using saliva as a medium for monitoring general health, diagnosis and disease detection was made (20). This noninvasive method has several advantages over blood sampling such as easily repeatable, stress-free sampling, lower costs and painless collecting (21). Many studies demonstrated that the amounts of salivary lipids reflect values of serum lipids to some extent. The results of investigations showed a significant correlation between serum and salivary TC, TG, HDL-C, LDL-C and very low density lipoprotein cholesterol (VLDL-C); therefore, measurement of lipids by saliva sampling is a useful method to determine lipid profile level (22-27).
There is no study to assess the effectiveness of a single session of exercise on salivary lipid profile.
2. Objectives
The aim of this study was to determine the effects of a single session of aerobic and resistance exercise on salivary lipid profile in healthy non-athletic women.
3. Material and Methods
This study was performed for six months, between May 2014 and September 2014. In this randomized clinical trial study, forty-five non-athlete volunteer females (18.5 ≤ BMI ≤25 kg/m2, aged 18-35 years) were participated (Table 1). Before participation in the study, subjects signed an informed consent form and completed the general health questionnaire (GHQ-28) (28). inclusion criteria were no participation in a regular exercise program for the previous six months, regular menstrual period for the least six months (27-32 days), no medical conditions (e.g. cardiovascular, orthopedic, metabolic and respiratory diseases), no change of body weight for at least six months, no current consumption of alcohol and no consumption of medications. Subjects were excluded if they had symptoms such as dizziness, paleness and tachycardia. Besides, individuals with symptoms and signs of any active oral inflammation, periodontitis or severe gingivitis excluded from the study. Subjects randomly assigned into equal three groups of aerobic, resistance and control.
| Variables | Control Group | Aerobic Group | Resistance Group | F2,42 | P Value |
|---|---|---|---|---|---|
| Age, y | 25.20 ± 0.29 | 26.13 ± 0.55 | 25.67 ± 0.83 | 0.59 | 0.55 |
| BMI | 21.48 ± 0.60 | 21.50 ± 0.61 | 21.23 ± 0.45 | 0.07 | 0.93 |
| Waist to Hip ratio | 0.75 ± 0.01 | 0.72 ± 0.01 | 0.70 ± 0.00 | 2.57 | 0.08 |
| Saliva flow rate before intervention, mL/min | 0.21 ±0.01 | 0.22 ± 0.01 | 0.21 ± 0.06 | 0.18 | 0.83 |
| Saliva flow rate after intervention, mL/min | 0.26 ± 0.01 | 0.27 ± 0.01 | 0.24 ± 0.07 | 1.20 | 0.30 |
aAbbreviation: BMI, body mass index.
bValues presented as mean ± SEM.
3.1. Anthropometric Measurement
At a preliminary session, subjects came to the laboratory to familiarize with the equipment and procedure. Then, indexes of anthropometric (weight, height, waist and hip circumference) were measured. Their height was measured by a wall chart and weight was measured by a digital scale. Body mass index was calculated by dividing the weight (kg) by square height (m2). Waist circumference was measured at the end of expiration in the thinnest part by tape meter. Also for measuring the hip size, the level of maximal protrusion of the gluteal muscles was selected (29).
3.2. 2-RM Test
2-RM test was determined for subjects in resistance group. The 2-RM is approximately equal with 90% of maximal voluntary contraction. This method reduces the risk of musculoskeletal injury and was used in many studies (30).
3.3. First Saliva Sampling
A week after the preliminary session, the subjects came to laboratory after 12 hours of fasting (22). Subjects were informed about the saliva sampling procedure. For all subjects, unstimulated saliva samples were obtained in 8 a.m. while the subjects were in a comfortable position (22). Saliva collection was performed by spitting directly into the plastic tube for a few minutes until sufficient volume (approximately 3 mL) was collected. Then, subject had a breakfast of about 550 KCal consisting of medium sized cake and low fat milk (31). At 9 a.m., subjects in each group performed a single session of exercise based on their respective group.
3.4. Aerobic Group
At the beginning of exercise session, subjects had a five-minute warm-up (32). The warm-up protocol was consisted of four stretching movements with 1set of two repetitions, while holding each position for 15 seconds and pedaling at zero resistance, which followed by 15 minutes running on treadmill and 15 minutes pedaling a stationary bicycle. The exercise intensity was 60-75% of the maximum heart rate (MHR), using “220-age” equation. A 2.5-minute warm-up phase followed by 10 minutes training phase with 60-75% MHR and a 2.5-minute cool down phase was used for the aerobic group.
3.5. Resistance Group
A similar five-minute warm-up was performed. Subjects performed five different resistance exercises in a same order; knee extension, knee flexion, elbow extension, elbow flexion and arm crossing across chest. Two sets of 10 repetitions at intensity of 75% of 2-RM were performed. A 30-second rest was allowed between sets of exercises. The session lasted about 30 minutes.
3.6. Control Group
Saliva sampling was performed at 8 a.m. and then had a breakfast similar to the other two groups. The control group had no exercise program and did not get extra calories until the second sampling.
3.7. Second Saliva Sampling
Immediately at the end of exercise session of the both groups, unstimulated saliva samples were collected. Second sampling of the control group was performed at 9:30 a.m. Saliva samples were centrifuged for 10 minutes at 4000 rpm (22). Samples were stored at -80 ˚C. Salivary lipid levels were measured by enzymatic photometric method. Salivary LDL-C was measured using the Friedewald formula (33) (Table 2). Changes of lipid profiles were calculated as second samples (after intervention) minus first samples (before intervention).
| Variables | Control Group | Aerobic Group | Resistance Group | F2,42 | P Value |
|---|---|---|---|---|---|
| LDL, mg/dL | 0.45 ± 0.09 | 0.93 ± 0.32 | 0.30 ± 0.09 | 2.56 | 0.09 |
| HDL, mg/dL | 0.82 ±0.03 | 0.74 ± 0.04 | 0.73 ± 0.05 | 0.78 | 0.46 |
| TG, mg/dL | 3.23 ± 0.67 | 3.91 ± 0.43 | 3.31± 0.40 | 0.49 | 0.61 |
| TC, mg/dL | 1.70 ± 0.11 | 1.64 ± 0.13 | 1.62 ± 0.14 | 0.22 | 0.80 |
a Abbreviations: HDL, high-density lipoprotein; LDL, low-density lipoprotein; TC, Total cholesterol; TG, triglyceride.
b Values presented as mean ± SEM.
3.8. Statistical Analysis
All statistical analyses were performed using SPSS version 17 (IBM, Chicago, USA). Kolmogorov-Smirnov test was used to determine the homogeneity of data distribution. Between group differences were determined using one-way ANOVA followed by Tukey post hoc test. The level of significance was considered at P < 0.05.
4. Results
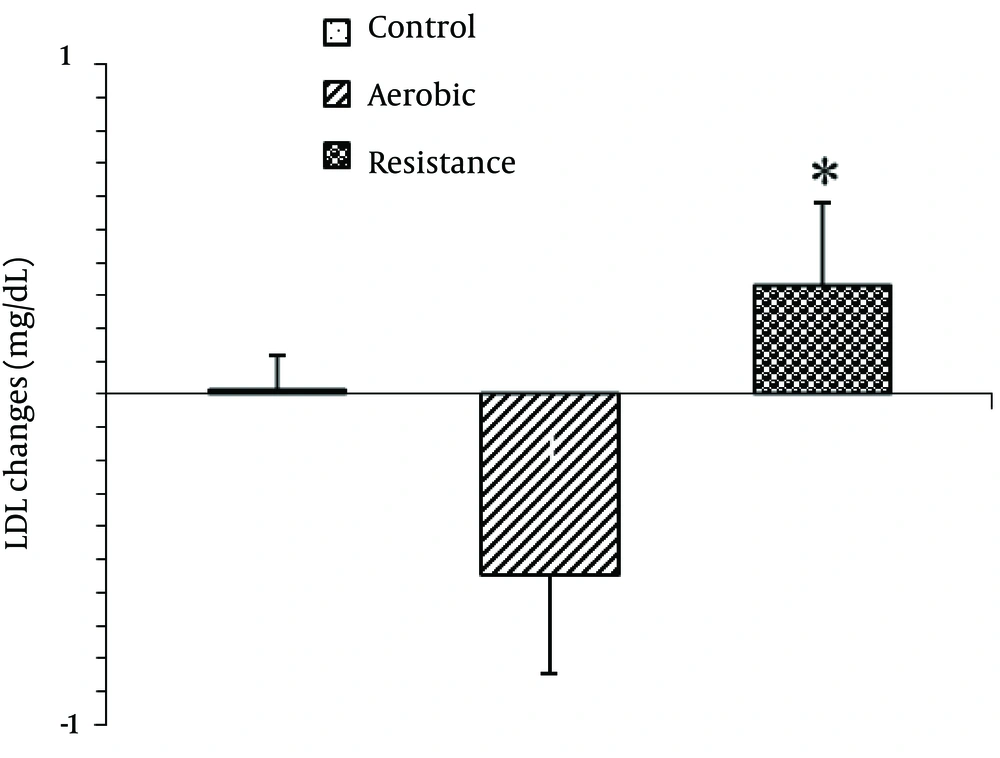
The baseline physical characteristics including BMI and waist-to-hip ratio were not statistically different between the groups (Table 1). Baseline values of salivary lipids are presented in Table 2. There were no significant differences between the groups for baseline levels of salivary LDL-C, HDL-C, TG and TC. One way ANOVA showed a significant difference regarding mean LDL-C changes between the groups [F2,42=3.54, P=0.03; Figure 1 ]
Post Hoc analyses showed that the mean salivary LDL-C significantly decreased in response to one session of exercise in aerobic group compared to the resistance group (P =0.03). However, there were no significant difference between aerobic and resistance groups with control.
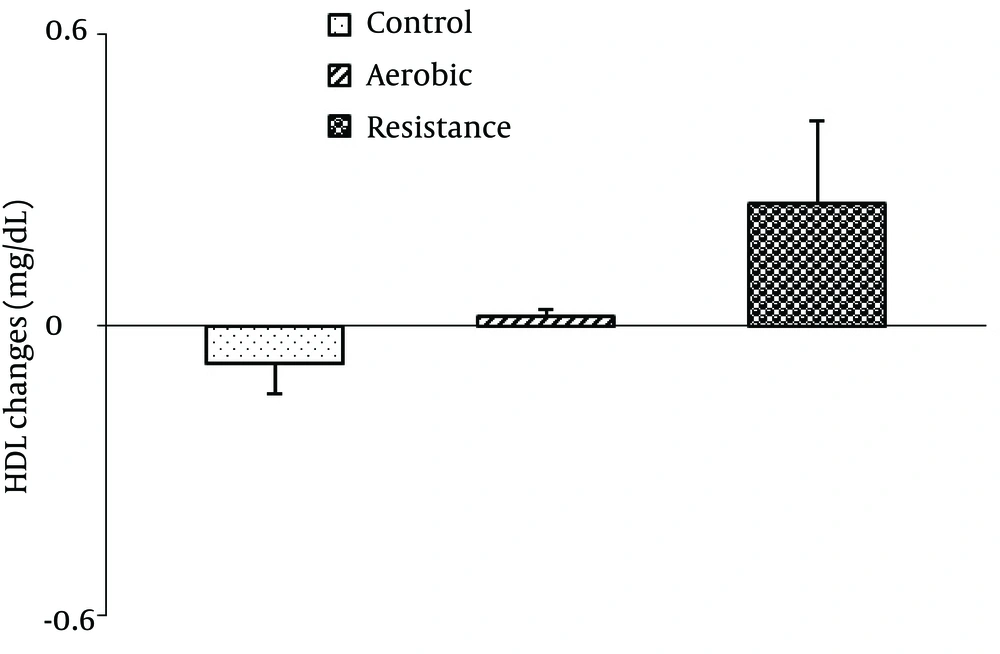
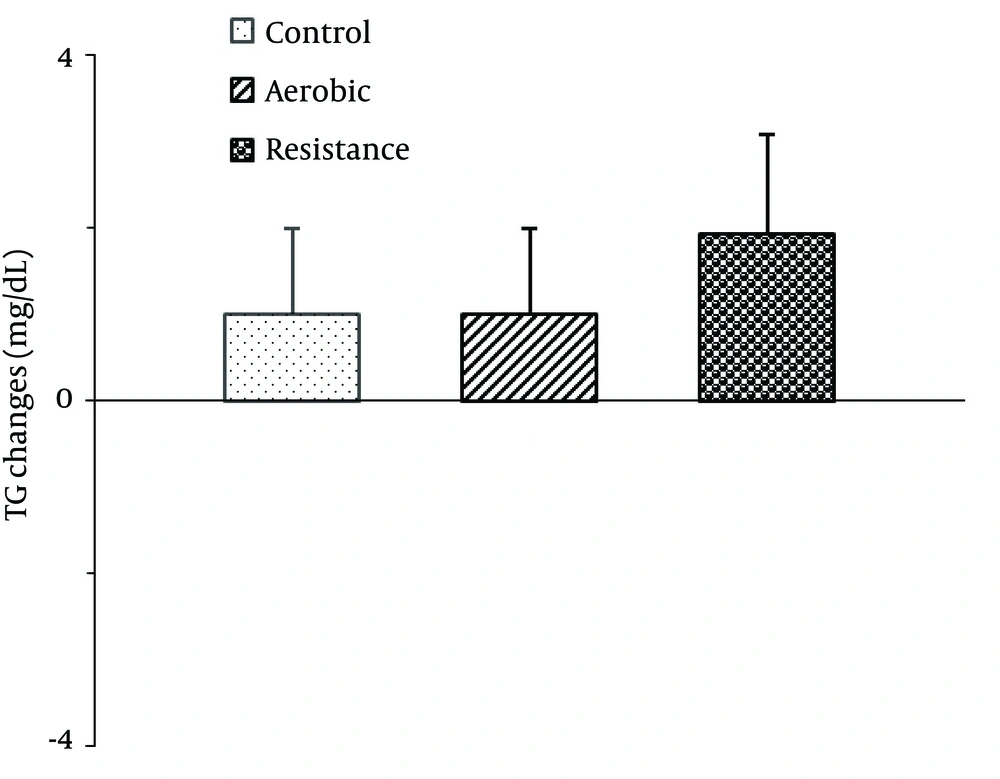
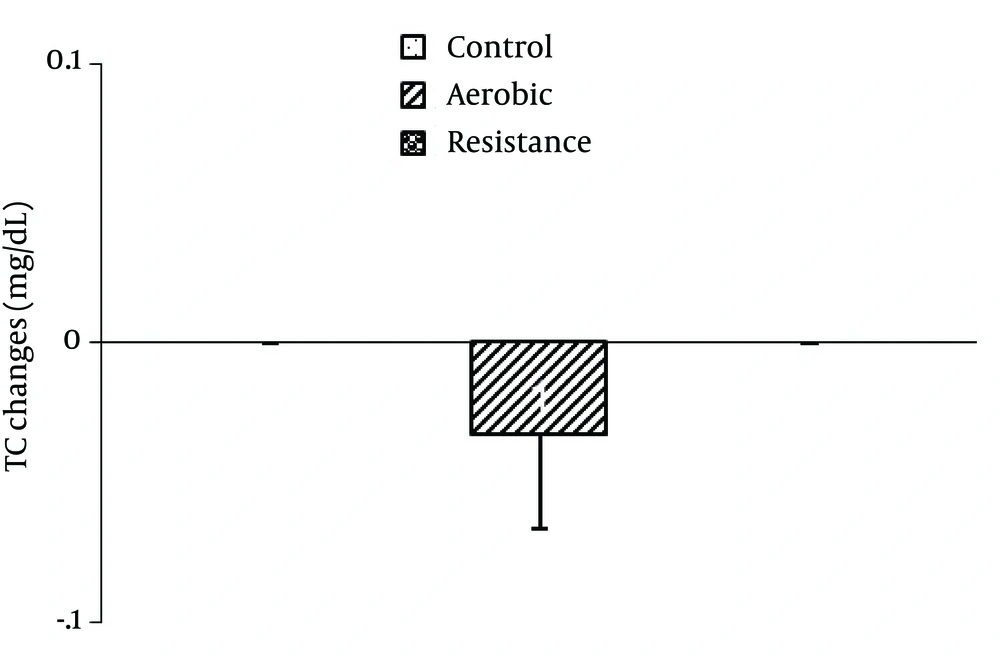
There were no significant differences between the groups in mean salivary HDL-C [F2,42=2.65, P=0.08; Figure 2 ], TG [F2,42=0.70, P=0.49 ; Figure 3 ] and TC [F2,42=0.78, P=0.46; Figure 4 ] changes.
5. Discussion
To our knowledge, this was the first study examining salivary lipid profile changeafter a single session of exercise in adult women. According to this study, no significant change of salivary lipid profile was found in response to a single session of aerobic and resistance exercise. The results of this study are somewhat consistent with other studies that examined the immediate effect of one session of exercise on serum lipid profile (9, 34, 35).
This study showed non-significant LDL-C reduction immediately after the aerobic exercise with moderate intensity. Crouse et al. demonstrated that in untrained men with hypercholesterolemia, plasma LDL-C concentration did not change immediately after a single session of moderate intensity aerobic exercise. However, they reported a decrease in LDL-C after high intensity aerobic exercise (33). Another study indicated reduction of plasma LDL-C level in untrained subjects, regardless of their initial cholesterol status, after a single bout of moderate intensity aerobic exercise (9). Ferguson et al. reported an energy expenditure of 1300 kcal (about 95 minutes running on a treadmill at 70% VO2max) or more is necessary to change plasma LDL-C level during an aerobic exercise session in trained subjects (36).
In many studies, a significant acute reduction of LDL-C was observed after prolonged exercise (12-14). Thompson et al. expressed that reduction of lipid levels following a prolonged exercise is due to acute decrease in plasma volume (15). However, regardless of plasma volume changes in both trained and untrained men, prolonged exercise can induce acute reduction of plasma LDL-C concentration (37). Intensity and duration of exercise, subject fitness status and baseline lipid levels are factors affecting the plasma LDL-C concentration (9, 15). Probably, the intensity and duration of aerobic exercise in this study are less than the threshold required for the significant changes of salivary LDL-C level. Our findings were in agreement with the results of most studies which did not observe plasma TC and TG level changes in normal individuals with hypercholesterolemia after acute aerobic exercise (18, 19, 38).
Our findings are consistent with previous studies that observed no changes in plasma HDL-C levels following one hour of exercise in untrained men (18, 37). They indicated that exercise duration affects the results. Lennon et al. reported a significant increase of HDL-C levels at 10 minutes after beginning of moderate intensity aerobic exercise (11). This increase persisted during 40 minutes of exercise, but by 15 minutes post-exercise, HDL-C decreased to the baseline level. Thompson et al. indicated that prolonged and high intensity exercise is not necessary to demonstrate an acute effect on plasma HDL-C of trained subject (14), while an increase in the plasma HDL-C concentration was observed following prolonged and low-intensity exercise (39). Based on the results of Ferguson study, energy expenditure more than 1500 kcal (about 112 minutes running on a treadmill at 70% VO2max) in a session is required for a significant change of plasma HDL-C lipid levels immediately after exercise in well-trained men (36). Consequently, Gordon showed that an exercise session of less than two hours (about 72 min) can produce a non-significant increase in HDL-C concentrations in moderately trained women (19). In the study by Torres et al., an acute increase of HDL-C was observed after continuous and intermittent exercise in athletes. They suggested that the plasma HDL-C concentration could be influenced by the level of subject aerobic fitness and was inversely correlated with it (40). Others reported no change in plasma HDL-C immediately after one session of aerobic exercise in men with hypercholesterolemia (9, 34). However, we evaluated salivary lipid change following moderate intensity and short-term exercise in normocholesterolemicn on-athlete women, which might not have been sufficient to detect immediate changes in HDL-C.
We did not found salivary lipid profile changes immediately after one session resistance exercise. Wooten et al. reported that a single session of resistance exercise did not change plasma lipids (41). However, results of different studies are varied. Hill et al. observed an increase of HDL-C immediately after a session of resistance exercise with high intensity versus low intensity and similar volume. They suggested that serum HDL-C response to a single session of resistance exercise depends on the exercise intensity (42).
Wallace et al. found no significant changes in plasma HDL-C immediately after resistance exercise sessions with low and high volume (35). Lira et al. revealed that acute resistance exercise with low and moderate intensities has a greater impact on plasma lipids than high intensity resistance exercises (16). The present study showed a non-significant and slight increase of salivary HDL-C and LDL-C levels after one session resistance exercise. Probably, an insufficient intensity or volume of resistance exercise was the reason for the lack of change in lipid profiles in this study. Significant changes were observed in this study between aerobic and resistance groups in the salivary LDL-C. In contrast, no differences were reported in LDL-C changes between aerobic and resistance groups of Smutok et al. study (43). It seems that aerobic program may be more effective than resistance exercise modifying TC and LDL-C levels, because of relatively more calories expended along with aerobic than resistance program (44).
We just examined immediate effects of exercise on salivary lipid profile and not delayed response. In many studies, delayed response occurred following a session of aerobic or resistance exercise (9, 13, 16, 31). The other limitation of the current study was its small sample size. Results of this study showed that one single session of exercise with moderate intensity and short duration had no effect on salivary lipid profile.


