1. Background
Mortality indices are among the most important health indices of every country. The mortality rates of infants and children under 5 years old are affected by different factors such as mother’s health, quality and accessibility of health services, socioeconomic status, and public health (1, 2). In most countries, including the United States, the infant mortality rate (IMR) is declining. In 1900, this rate was 100 infants in 1000 live births, while in 2000 it dropped to 6.89 (1, 2); and based on the world health organization (WHO) reports, there were 34 deaths per 1000 live births in 2013 (3). In 2010, the lowest IMR (the top 5 countries) was reported respectively in Finland, Japan, Portugal, Sweden, and Czech Republic (4). Maternal mortality has remained one of the fundamental challenges in health. In 1980, the maternal mortality rate (MMR) was 526300 throughout the world and it decreased to 342,900 in 2008. On a global level, the MMR was reported as 422, 320, 251, and 210 deaths in 100,000 live births in 1980, 1990, 2008, and 2013, respectively (5, 6). In Iran, the MMR was reported as 83, 60, 44, 31, and 23 deaths per 100,000 live births in 1990, 1995, 2000, 2005, and 2013, correspondingly (6). According to various findings from around the world, health is associated with socioeconomic status (i.e. education level, income, and occupational class) (7, 8). A thorough understanding of these associations will lead to improvement in the monitoring of social and economic inequality and is proposed as an important dimension in assessing the performance of a health system (9, 10). Inequality can be measured with different methods, one of them being the concentration index (CI), which can be shown with the concentration curve (CC) (11-14).
Gross domestic product (GDP) is defined as the value of all final goods and services produced in a country in one year. Health expenditure is defined as the amount spent by individuals, groups, nations, or private or public organizations on total health care and/or its various components. Gross national income (GNI) is defined as the sum of value added by all resident producers plus any product taxes (less subsidies) not included in the valuation of output plus net receipts of primary income (compensation of employees and property income) from abroad. The out-of-pocket index is defined as the percentage of private expenditure on health (15). In this study, these four indices were used as the economic indicators of the countries included in the analysis. Mortality has a disparate distribution in different economic levels. The variability of the economic variables in different countries renders an assessment of the association between mortality rates and economic status difficult. We, therefore, collected information for analysis from different countries, as units of this study, from the World Bank website.
2. Objectives
We sought to investigate the association between economic inequality and IMR, under-5-year-old mortality rate (U5MR), and MMR in the world based on the World Bank data.
3. Patients and Methods
In this ecological study, information on economic inequality in terms of per capita GDP, GNI, out-of-pocket index, and per capita health expenditure of all countries (196 countries) was extracted from the World Bank website in 2013 (16). The study outcomes were, accordingly, the IMR, U5MR, MMR, and crude death rate, all of which were obtained from the World Bank website (16). Then, the correlation between the study outcomes and inequality in terms of the economic factors was examined, and the CI, CC, and the upper and down limits for the CI were determined. The range of the CI is between -1 and +1. A range between -1 and 0 means that our study outcome is more in the lower economic level of society (pro-poor) or, in other words, inequality is detrimental to the poor. A range between 0 and +1 means that our study outcome is more in the upper economic level of society (pro-rich) or, in other words, inequality is detrimental to the rich. All the analyses were performed using STATA, version 12.
4. Results
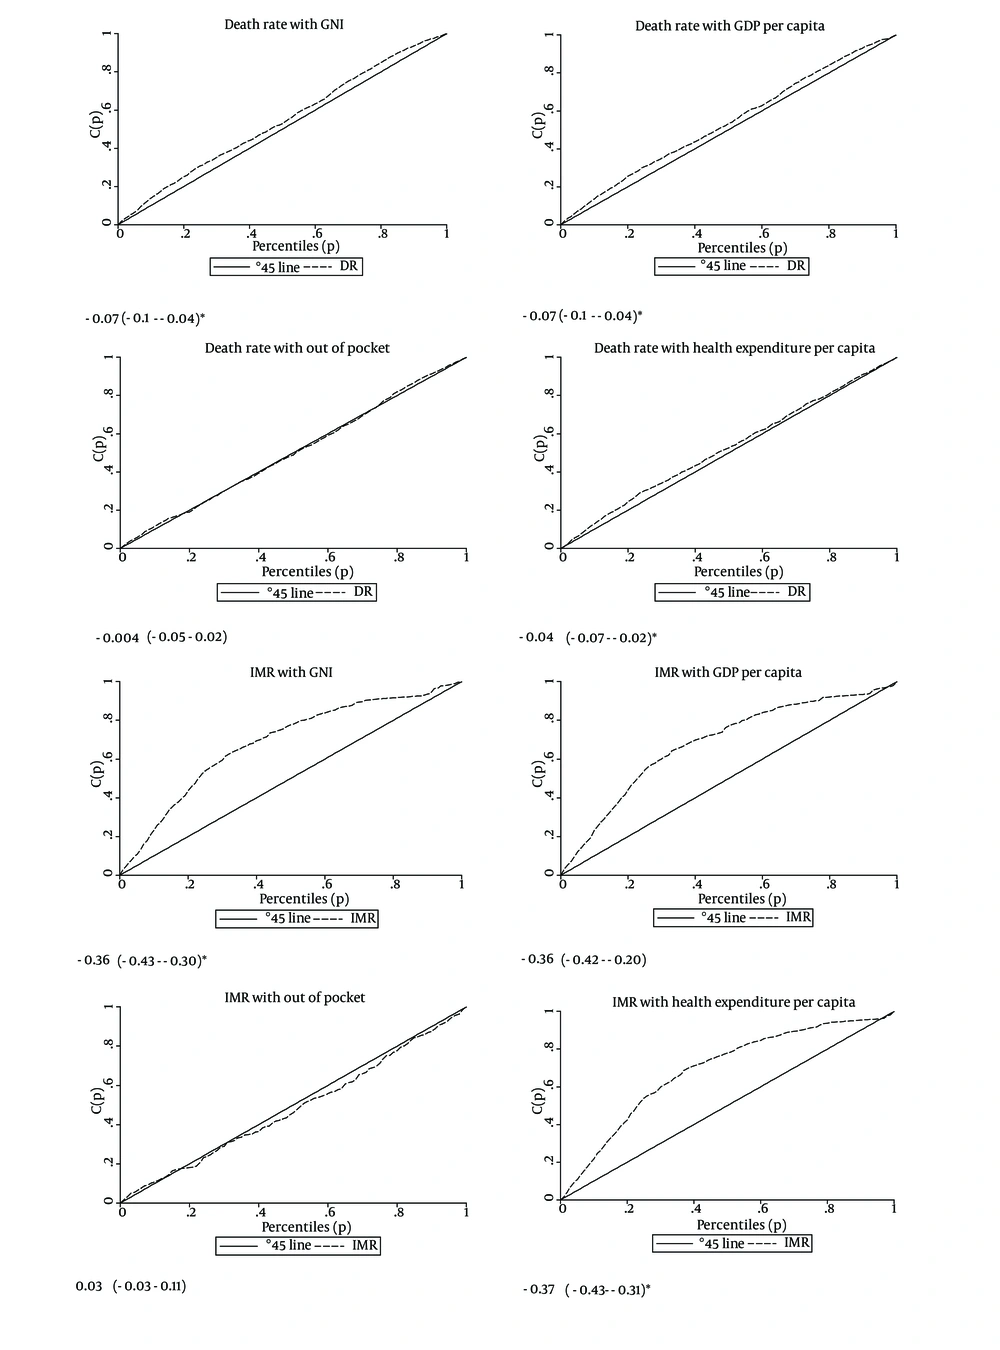
As is shown in Figure 1, although the crude mortality rate was slightly higher in the lower economic status, there was very little unequal distribution of crude mortality in the different variable levels of per capita GDP (CI = 0.07), GNI (CI = 0.07), per capita health expenditure (CI = 0.04), and out-of-pocket index (CI = 0.004).
The IMR showed an unequal distribution in the different levels of the variables of per capita GDP, GNI, and per capita health expenditure inasmuch as their CI was respectively -0.36, -0.36, and -0.37. Considering that its confidence interval did not include zero, it can be concluded that the IMR had a statistically significant unequal distribution in the different levels of the economic variables and was higher in poor countries (pro-poor). However, the out-of-pocket index (CI = 0.03) did not cause disparities in the IMR (Figure 1).
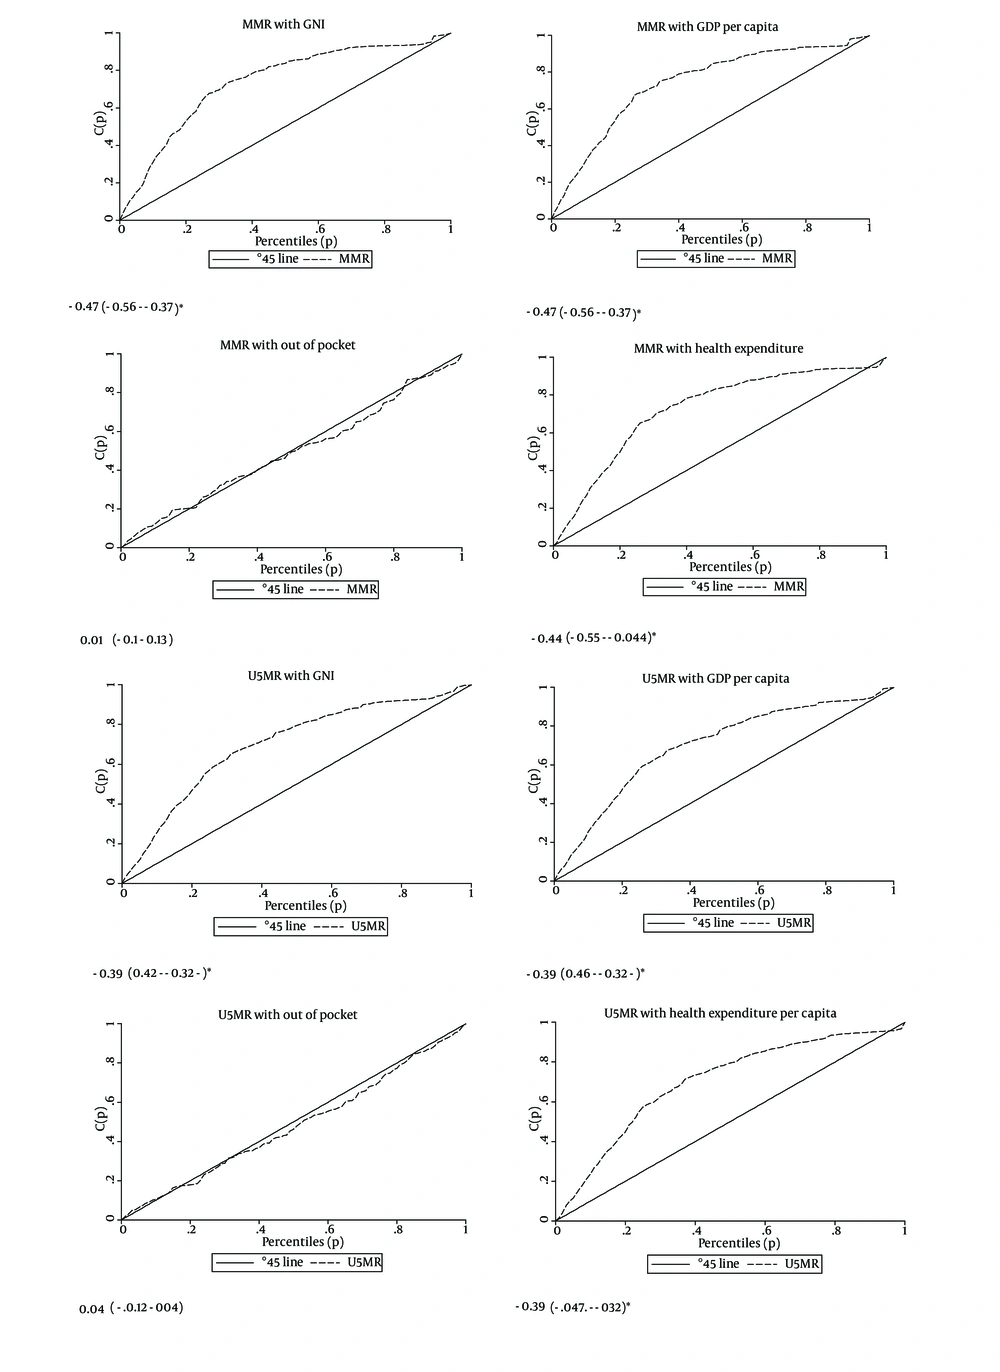
The MMR showed an unequal distribution in the different levels of the variables insofar as the CI for per capita GDP, GNI, and per capita health expenditure was -0.47, -0.47, and -0.44, respectively. Considering that its confidence interval did not include zero, it can be concluded that the MMR had a statistically significant unequal distribution in the different levels of the economic variables and was higher in poor countries. Nevertheless, the out-of-pocket index (CI = 0.01) did not lead to disparities in the MMR (Figure 2).
Similar to the IMR and MMR, significant disparities in the distribution of U5MR were observed (Figure 2) inasmuch as the CI was the same (-0.39) for per capita GDP, GNI, and per capita health expenditure. It means that the U5MR was more pronounced in low socioeconomic status people. Moreover, the U5MR did not show an unequal distribution based on the out-of-pocket index (CI = 0.04).
5. Discussion
Despite the reduction in the maternal and child mortality rates in many countries, especially developed countries, there is still marked inequality among countries. The main finding of this study was that low socioeconomic status countries (in terms of per capita GDP, GNI, and per capita health expenditure) had a greater proportion of IMR, U5MR, and MMR in the world. Indeed, a better economic status can lead to a reduction in these mortality rates. The economic indicators of any given country have little impact on the country’s crude mortality rate. However, considering the fact that this study was in the level of countries, its findings cannot be extrapolated to individual level and it is essential that future studies assess individual level as well.
Chiming in with the findings of the present study, Hosseinpoor et al. (17) examined the association between socioeconomic inequality and IMR and showed that the latter had an unequal distribution and was more pronounced among the poor. In another study by Hosseinpoor et al. (18), the CI was reported at -0.17, denoting that mortality was higher among individuals in a lower socioeconomic class of society. Our findings are concordant with those of similar studies in different parts of the world (19, 20). In a study conducted in 9 developing countries, the consumption level was used as socioeconomic indicator and the results showed that the countries with greater inequality in the consumption level had a greater inequality in children mortality (19).
Maternal mortality is an inevitability; its reduction requires commitment at national and global levels. One of the findings of the current study was economic inequalities in the MMR. Similar to our study, a study conducted in China reported a negative CI, which means that the MMR was higher among the low socioeconomic people in the country (21). Tajik et al. (22) examined the ecological disparities in the MMR in Iran and concluded that socioeconomic variables were significant factors in creating maternal inequality, but in ecological level (23). There are several related factors in maternal mortality which can be reduced by interventions such as prenatal care, increasing the access to health services, providing conditions for safe delivery, education, and vaccination.
In the present study, the CI of the crude mortality rate was very low, which indicates that the overall mortality had no relation with socioeconomic status and all people with different socioeconomic status finally die. A part of this weak inequality in the crude mortality rate can be justified with more deaths of specific groups such as children and mothers.
A large number of studies have shown that income level is associated with many health outcomes in population level (24-27), such that income inequality is accompanied by poor health status, after adjusting for important confounding factors (28). The association between income inequality and mortality is fully known. Nuru-Jeter et al. (29) studied more than 100,000 people in urban areas in 2014 and demonstrated a positive and significant association between income level and mortality among black persons, whereas this association was reverse among the white citizens.
Life expectancy has risen in the past 60 years in countries with appropriate economic status. A reduction in tobacco use and cardiovascular disease-induced mortality has played a significant role in this positive development (30). The mortality rate is low among countries with a good economic status, whereas the avoidable male mortality rate in some regions such as Europe, Latin America, and Central Asia and the female mortality rate across the world have exhibited minor changes and have even increased since 1980 (30). Totally, awareness about disease risk factors can be enhanced by improvement in economic status and it can lead to a reduction in high-risk behaviors and mortality. Individuals with high education levels, more income, and appropriate jobs tend to pay more attention to their health status, which contributes to improvement in their health status and low mortality rate. Another factor of significance among such individuals is that their working conditions are better and safer.
One of the limitations of the present study is that the data were collected in the level of countries; consequently, the extension of its findings to individual level would lead to ecological fallacy. Also, other covariates in creating inequality were not included in this study, rendering the decomposition of the inequality index and controlling for confounding and interaction effects impossible. Therefore, we suggest that similar studies be undertaken with more complete information.
In conclusion, our findings demonstrated that per capita GDP, GNI, and per capita health expenditure had an important effect on inequality, while the out-of-pocket index exerted no significant impact. The effect of per capita GDP and GNI on the inequality of the IMR, U5MR, and MMR was the same.

