1. Background
Physical readiness plays an important role in the professional life of navy personnel. It also has many dimensions, ranging from staying in shape to being actively involved in sports and athletics as well as particular physical capabilities for their missions. Human resources and students are trained in the navy with high costs. According to the occupational health, to obtain the best output from human resources, appointed jobs should be mentally and physically appropriate. This would result in improving staff well-being, enhancing productivity, and job satisfaction (1).
In the Navy of Islamic Republic of Iran Army (NEDAJA) students have to take initial military training for four years and after graduation they are employed in one of the five military categories including navigation, marine, sea scouts, electronics, and mechanics. Therefore, standard and scientific procedures are necessary to appoint the students in the most appropriate working group in NEDAJA. For this purpose, a nomogram was developed using several physical readiness variables in order to make a scientific platform to appropriately recruit students to each military category.
Nomogram is a multi-dimensional tool designed to allow the graphical computation of a multivariable mathematical function (2, 3). Interpreting the statistical models needs special knowledge of statistics and epidemiology, whereas nomograms simplify the interpretation of the sophisticated models (4-6).
2. Objectives
The current study aimed at constructing a valid and accurate statistical model using the physical readiness variables to predict the best military category for the students of NEDAJA and putting the complex concepts of this model to a simple practical tool such as nomogram.
3. Methods
The current cross sectional study included all of the navy students (Islamic Republic of Iran Navy) studying from 2011 to 2012 in Imam Khomeini Naval University of Noshahr. Out of 733 students in the university, 260 were randomly selected and their physical readiness variables were measured.
3.1. Dependent (Outcome) Variable Definition
Dependent variable was defined based on a Delphi technique in qualitative research in order to determine the best variables for five categories of navy (navigation, marine, sea scouts, electronics, and mechanics) using experts’ opinion. First, in the Delphi study, 15 experts were selected and the importance degree of physical readiness variables in each of the categories was measured, using a standard questionnaire. Then, according to the experts’ score to each variable, the most important variable was determined to define the outcome variable. Next, the participants with physical readiness values above 95% in terms of the selected variables were considered as case and the others as control groups in the current study.
3.2. Measurements
The procedure to measure the physical readiness variables consisted of nine parts and all the measuring was performed in the athletics track and swimming pool of the university. The start point was in the third arc of the track. First, for dynamic balance test, a balance beam, 120 cm height and 7 m length, was used. The score was calculated based on not falling off from the balance beam. Then, there was the jumping test with different hurdles height. In this test the speed and complete passing over hurdles were the scoring standard. The chin-up test was conducted in the first arc of track and the number of correct movements was the scoring standard. The 30-second sit-up test, holding a basketball ball, was performed in the end of the first arc and the number of correct movements was the scoring standard. Then along the track and in the middle of the track, test of general agility with the passing under and over hurdles was performed; no hurdles accident occurred and time of the test was considered as the scoring standard. Next, along the track, the test of rope in 30 seconds was performed in which the number of correct movements and harmony of movements were the scoring standard. After this stage, the participants ran around the track and passed through the end line, the overall time of the test was the criteria to score the aerobic endurance. In the shooting test with G3 battle rifle, participants had to place 13 bullets into the chamber of the gun and shoot in a sitting position on the target page. The distance between shooter and target was about 50 m and scoring standard was considered as speed of the operation and accurate targeting. The swimming test was after the previous test. In this test, participants swam from the shallow place in the pool toward the deep place, swimming the entire length of the pool, and the quality of swimming was the scoring criteria.
3.3. Statistical Methods
The allocation of each subject was calculated using binary logistic regression model. Separate models were built for each navy category. In the model, dummy code 1 was assigned to the participants meeting the inclusion criteria for the category (cases) and 0 to the participants that did not meet the criteria who were not appropriate for the category (controls) (7). The inclusion criteria for the model were selected based on expert opinion and literature review. The potential of the existence of multicollinearity in the model was assessed using variance inflation factor (VIF) that quantifies the severity of multicollinearity in an ordinary least-squares regression analysis (5). VIF > 10 was considered as the significant collinearity in the model (8). Four distinct models were developed for logistic regression, the first selection variables with a P value of < 0.2, second selection variables with a P value of < 0.1, third selection variables with a P value of < 0.05, and fourth all variables were believed to contribute to the model (forced entry method) (9). Potential non-linear relationship was examined through the inspection of scatter plot. If there was any non-linear relationship, log transformation was employed (5). The logistic model performance was assessed with respect to discrimination and calibration. Discrimination was quantified with the concordance index (c-index), which is identical to the area under the receiver operating characteristics (ROC) curve (8). Calibration (10) was estimated by the Hosmer and Lemeshow goodness-of-fit statistics, the Akaike information criterion (AIC), the Bayes information criteria (BIC), the Negelkerke R2, and the Cox and Snell R2 (5).
3.4. Development of Nomogram
The efficacy of a nomogram is that it graphs the probabilities into scores on an intelligible scale from 0 to 100. The total scores were accumulated by all independent variables corresponding to the predicted probability for a participant. The scoring system works by organizing the measure of association, regardless of statistical significance, and it is influenced by the presence of other independent variables (4). The Stata/MP ‘nomolog’ command was used to develop nomogram after building the finalized model by logit prediction command. All analyses were conducted using Stata version 14 as well as SPSS version 21.
4. Results
The general and physical fitness characteristics of 171 participants are shown in Table 1. The mean age was 21.2 ± 2.1 years, and 59 out of 171 participants (34.5%) in navigation, 78 (45.6%) in marine, 26 (15.2%) in sea scouts, 50 (29.2%) in electronics, and 59 (34.5%) in mechanics categories meet the inclusion criteria to fit the best for each category. The potential of the existence of collinearity was assessed prior to building the logistic model and significant multicollinearity was observed between weight and height (VIF 7.6 versus 7.5). Therefore, these two variables were transformed to the body mass index (BMI) and entered from BMI to the logistic model (VIF for the BMI = 1.09).
| Variable | Unit | Mean ± SD | Min | Max |
|---|---|---|---|---|
| Age | y | 20.4 ± 1.7 | 19 | 28 |
| Height | cm | 172.4 ± 8.6 | 161 | 198 |
| Weight | kg | 54.3 ± 12.4 | 54 | 105 |
| Balance | Referee’s opinion | 69.8 ± 21.3 | 20 | 100 |
| Rope | Correct movement | 43.2 ± 19.8 | 0 | 75 |
| Agility | Number of error | 69.2 ± 30.5 | 0 | 100 |
| Chin-up | Correct movement | 2.0 ± 2.4 | 0 | 13 |
| Sit-up test | Correct movement | 16.5 ± 30.5 | 8 | 32 |
| Swimming | Referee’s opinion | 93.5 ± 39.8 | 0 | 150 |
| Power | Number of error | 47.7 ± 25.7 | 0 | 100 |
| Aerobic endurance | s | 311.1 ± 30.8 | 215 | 390 |
| Coordination | s | 22.3 ± 7.2 | 10.2 | 56 |
| Shooting | Right targeting | 49.6 ± 14.3 | 40 | 100 |
4.1. Nomogram for Navigation Category
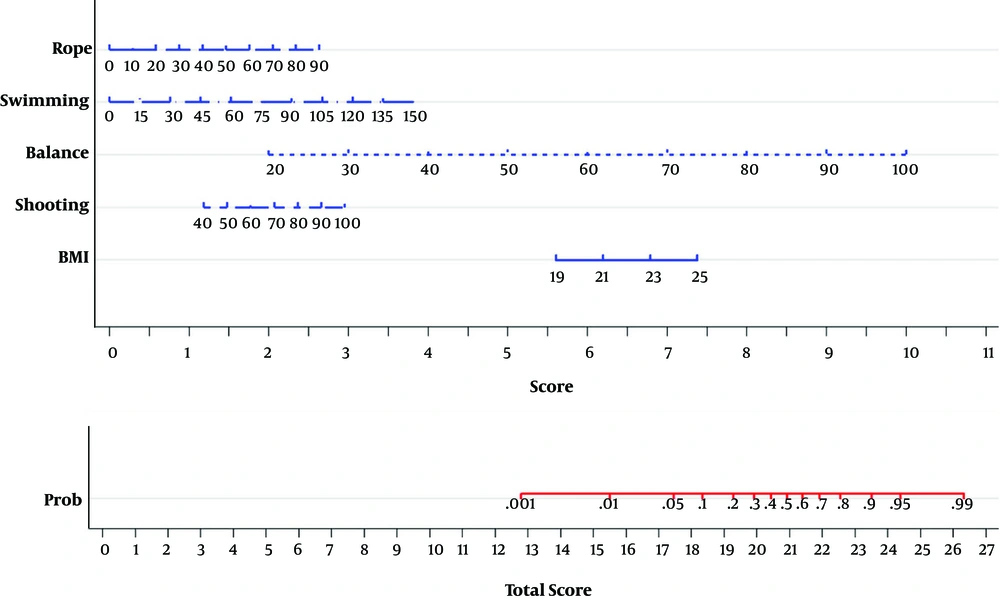
Table 2 shows the results of multivariate logistic regression model for the navigation category. The model with inclusion criteria of P < 0.2 was selected as the best model due to better goodness of fit statistics (pseudo R2: 0.29; ROC area: 0.86; AIC: 0.97; BIC: -693; the Hosmer and Lemeshow < 0.001). BMI (OR: 1.28; P = 0.13), shooting (OR: 1.02; P = 0.1), balance (OR: 1.08; P < 0.001), swimming (OR: 1.02; P < 0.001), and rope (OR: 1.02: P = 0.02) were selected for the model. A nomogram was developed based on the results of this multivariate analysis (Figure 1).
| Variable | Odds Ratio | 95% CI | P Value |
|---|---|---|---|
| Navy category | |||
| BMI, kg/m2 | 1.28 | 0.92 - 1.79 | 0.13 |
| Shooting | 1.02 | 0.99 - 1.05 | 0.10 |
| Balance | 1.08 | 1.05 - 1.12 | 0.001 |
| Swimming | 1.02 | 1.01 - 1.03 | 0.001 |
| Rope | 1.02 | 1.00 - 1.04 | 0.02 |
| Marine category | |||
| Shooting | 1.03 | 0.99 - 1.07 | 0.05 |
| Balance | 0.97 | 0.95 - 1.00 | 0.09 |
| Swimming | 1.02 | 1.01 - 1.03 | < 0.001 |
| Power | 1.12 | 1.08 - 1.17 | < 0.001 |
| Electronics category | |||
| Coordination | 0.90 | 0.83 - 0.98 | 0.02 |
| Swimming | 1.01 | 0.99 - 1.02 | 0.05 |
| Balance | 1.18 | 1.11 - 1.24 | < 0.001 |
| Shooting | 1.09 | 1.04 - 1.15 | < 0.001 |
| Mechanics category | |||
| Swimming | 1.02 | 1.01 - 1.03 | < 0.001 |
| Shooting | 1.05 | 1.02 - 1.09 | 0.001 |
| Balance | 1.10 | 1.06 - 1.14 | < 0.001 |
| Sea scouts category | |||
| Shooting | 1.10 | 1.05 - 1.16 | < 0.001 |
| Aerobic endurance | 0.13 | 0.04 - 0.41 | < 0.001 |
| Swimming | 1.02 | 1.00 - 1.03 | 0.001 |
| Coordination | 0.89 | 0.80 - 0.98 | 0.02 |
4.2. Nomogram for Marine Category
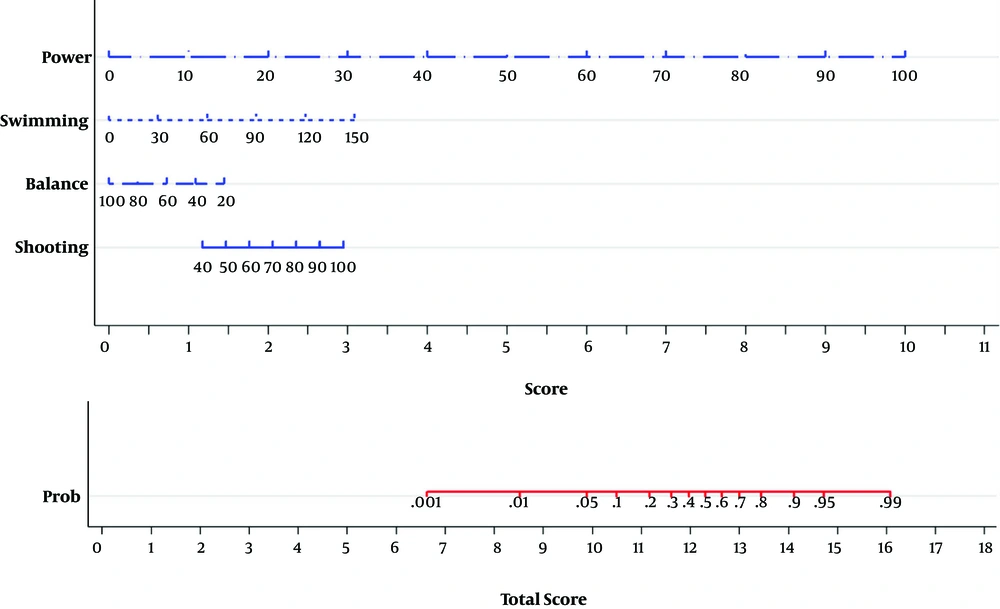
Table 2 shows the results of multivariate logistic regression model for the marine category. The model with selection criteria of P < 0.2 was selected as the best model due to better goodness of fit statistics (pseudo R2: 0.50; ROC area: 0.94; AIC: 0.73; BIC: -737; the Hosmer and Lemeshow < 0.001). The logistic regression revealed that shooting (OR: 1.03; P = 0.05), balance (OR: 0.97; P = 0.09), swimming (OR: 1.02; P < 0.001) and explosive leg power (OR: 1.12; P < 0.001) had significant contribution in the model. The nomogram for this model is exhibited in Figure 2.
4.3. Nomogram for Electronics Category
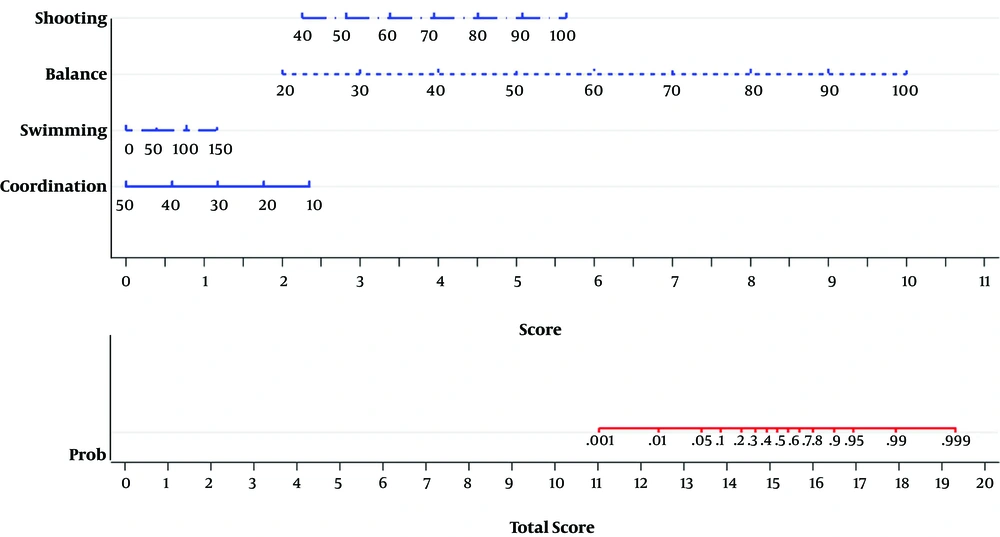
Table 2 shows the results of multivariate logistic regression model for the electronics category. The model with selection criteria of P < 0.2 was selected as the best model due to better goodness of fit statistics (pseudo R2: 0.52; ROC area: 0.92; AIC: 0.63; BIC: -754; the Hosmer and Lemeshow < 0.001). Coordination (OR: 0.90; P = 0.02), swimming (OR: 1.01; P = 0.05), balance (OR: 1.18; P < 0.001), shooting (OR: 1.09; P < 0.001) were selected for the model. A nomogram was developed based on the results of this multivariate analysis (Figure 3).
4.4. Nomogram for Mechanics Category
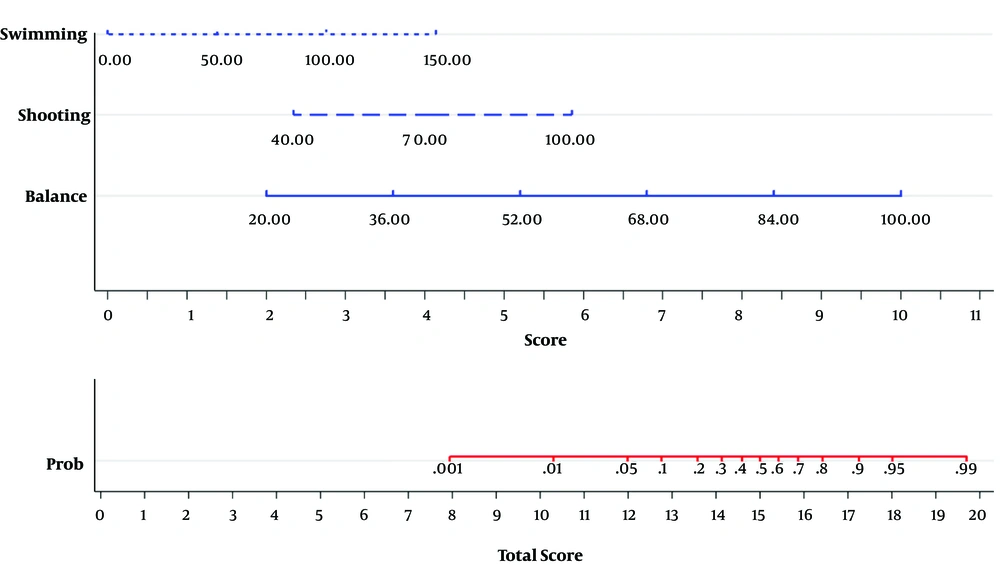
Adjusted OR for the mechanics category are reported in Table 2. The model with the inclusion criteria of P < 0.1 was selected as the best model due to better goodness of fit statistics (pseudo R2: 0.34; ROC area: 0.87; AIC: 0.89; BIC: -713; the Hosmer and Lemeshow < 0.001). Swimming (OR: 1.02; P < 0.001), shooting (OR: 1.05; P = 0.001), balance (OR: 1.10; P < 0.001) were selected for the model. A nomogram was developed based on the results of this multivariate analysis (Figure 4).
4.5. Nomogram for Sea Scouts Category
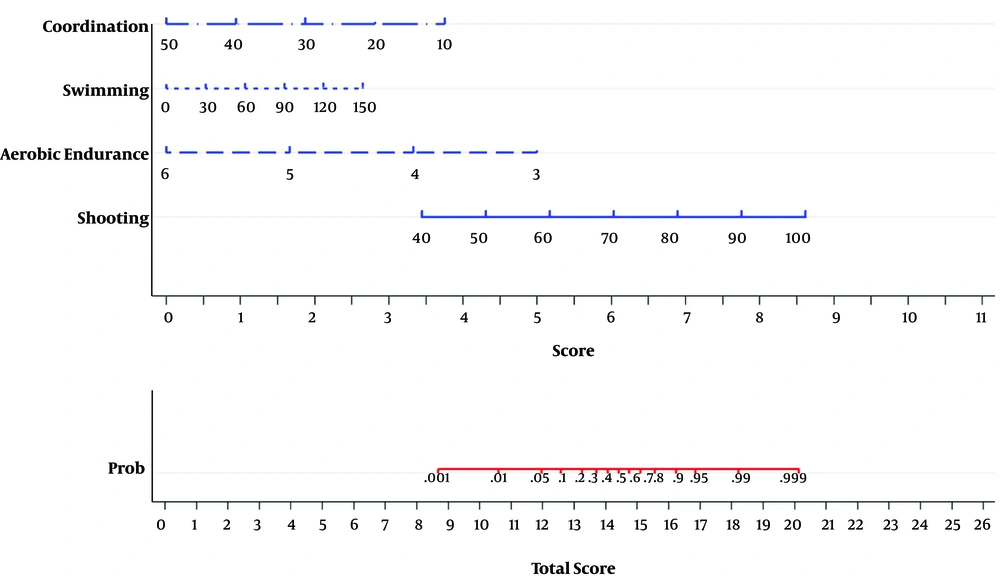
Table 2 shows the results of multivariate logistic regression model for the sea scouts category. The model with the inclusion criteria of P < 0.05 was selected as the best model due to better goodness of fit statistics (pseudo R2: 0.30; ROC area: 0.87; AIC: 0.64; BIC: -752; the Hosmer and Lemeshow = 0.25). Shooting (OR: 1.10; P < 0.001), aerobic endurance (OR: 0.13; P < 0.001), swimming (1.02; P = 0.001), and coordination (OR: 0.89; P = 0.02) were selected for the model. A nomogram was developed based on the results of this multivariate analysis (Figure 5).
5. Discussion
The current study described the development of nomograms predicting the most appropriate military category in the students of NEDAJA. After matching each value for independent variables to the appropriate score, the probability that responds to the total points was figured out. The validation of the model was assessed and showed fit performance in terms of calibration and discrimination. These nomograms exhibited probability estimates that were useful for individual students, predicting the best military category based on their physical fitness variables. Furthermore, with multidisciplinary nature of the navy recruitment, objective models in virtual settings are necessary for the recruiters when predicting the best category for each student. It was the first study in this field and authors did not found any similar studies in Iran or other countries for comparison.
5.1. Interpretation of the Nomograms
A nomogram maps the measure of associations into easy scores on a scale from 0 to 100 in a user-friendly figure. The total points collected by the various independent variables correspond to the predicted probability for a student (11, 12). The scoring standard works by ranking the regression coefficients, without considering the statistical significance, and it is influenced by the presence of other variables. Figures 1 - 5 show the nomogram predicting eligibility for navy category. For example, in Figure 1, assume a student with following measures: rope = 80; swimming = 120; balance = 80; shooting = 80; BMI = 19 kg/m2. In this example, rope 80 is converted to score 2.3, swimming 120 is converted to score 3, balance 80 is converted to score 8, shooting 80 is converted to score 2.5, and BMI 19 is converted to score 5.5. The sum of these scores is 21.3. By looking at the nomogram, it can be observed that total score of 21.3 is equal to the probability of 0.5 in this category. This calculation can be performed for all the five categories; consequently, greater probability for each model indicates better appropriateness for the category.
5.2. Limitations
There were some limitations in the present study. To develop the most comprehensive nomogram, it was better to enter the student’s educational status during the academic years and psychological variables. But, since the focus of the current study was only physical readiness variables, additional variables were not measured. In addition, except for the sea scouts model, the Hosmer and Lemeshow goodness of fit were significant for all models. A possible justification for this may be entering only the physical readiness variables in the models; consequently, it is suggested that measurement of educational status, psychological, and other potential variables be considered in the future studies.
5.3. Conclusion
Selection for the professional military categories requires that a candidate meets the physical readiness test standards, and then appropriate category can be selected based on individual physical ability. This type of selection procedure is in accordance with occupational health issue and may be led to better performance of military personnel.

