


1. Background
Tuberculosis (TB) is a necrotizing chronic or acute disease that usually involves the lungs although it can involve different body organs and tissues such as lymph nodes, pleura, pericardium, kidney, and bones. TB can occur as a result of either a new infection with Mycobacterium tuberculosis or reactivation of a latent TB infection. Most cases in endemic countries, such as Iran, occur due to a new infection (1).
One of the Millennium development goals is to end TB by decreasing the TB mortality rate by 50% compared to 1990, stopping or decreasing the TB incidence and prevalence until 2015, and decreasing the TB incidence to less than one case per million population by 2050 (2). The universal health coverage (UHC) has a vital role in this regard (2).
Generally, the disease burden of TB is decreasing but not at a speed sufficient to achieve the first milestones of the end TB strategy by 2020. The TB incidence rate should be decreased by 4% - 5% per year while it is decreasing by 2% per year (2). TB is reappearing in many countries as a public health crisis although it is not an emerging disease, it is an important reemerging disease. Reemerging TB might be caused by multidrug-resistant M. tuberculosis (category C of biological agents), the emergence of the HIV epidemics and a large number of immigrants from countries with common TB (3, 4).
During two decades, the TB incidence rate in Iran declined from 36 per 100000 in 1990 to 17 per 100000 in 2010, but it is not enough to reach the STB goal; hence, TB control is a prime concern for public health among policymakers. One of the important causes of this situation is the common frontier with three countries in which TB is a public health problem, i.e., Pakistan, Iraq, and Afghanistan (5, 6).
A way for the development of control programs and allocation of resources is reviewing temporal changes and forecasting. This method can have a major role in identifying health problems in the future (7).
2. Objectives
The aim of this investigation was to compare single exponential and double exponential smoothers to determine which model is more accurate for forecasting TB cases in Razavi Khorasan province and utilize this approach for surveillance and biosurveillance systems.
3. Methods
3.1. Study Setting
Razavi Khorasan province is located in the northeastern part of Iran in the vicinity of Afghanistan. It is the fifth-largest province in Iran, with an area of 118854 km2. Its population is about 6.5 million people, which makes it the second-largest populated province in Iran. The growth rate is 1.4%, which is higher than the national growth rate, with an incidence TB rate of about 14 per 100000 that is also higher than the national rate (about 11 per 100000).
3.2. Data Collection
We obtained the data from the Bureau of Tuberculosis the Center for Disease Control, the Ministry of Health and Medical Education of Iran.
The following definitions were used according to the national guideline of TB control:
A “new case” is a patient who has never received treatment for TB or who has taken anti-TB drugs for less than four weeks.
A “retreatment case” is a patient who has taken anti-TB drugs for at least four weeks.
Pulmonary tuberculosis is a patient who has Smear positive TB or Smear negative TB and extra pulmonary TB is as an infection of other parts of the body, except for lungs (1).
We presented a time series of monthly incidence counts of TB cases in Razavi Khorasan province between April 2007 and March 2018.
3.3. Model Fitting
For finding the best fitting model, according to previous studies (8, 9), we used two univariate time-series smoothing techniques (10, 11), including Simple Exponential and Duple Exponential smoothing. We pooled the number of TB cases per month of daily cases; thus, 132 time-points (months) were obtained.
3.3.1. Simple Exponential (SE) Smoothing
This method is applied for forecasting a time series when there is no trend or seasonal pattern, but the meantime series gradually varies with time. The model needs one parameter (α) to create the fitted and forecasted values. The SE method is frequently applied to forecast the value of the time ahead, given the present and previous values.
In this equation, St is the forecasted number of TB cases, xt denotes the actual value in the period of the previous year, and S t-1 is the prior forecast.
3.3.2. Holt’s Trend (HT) Corrected Exponential Smoothing
It is also called the Double-Exponential method that is obtained by smoothing the smoothed series, as follows:
A. The exponentially smoothed series value
in which, xt is the raw series and αt and St denote the smoothing parameter and forecasted xt, respectively.
B. The Double-Exponential smoother
C. The difference exponentially smoothed series value trend estimate. The constant term:
D. The linear term:
E. The τ, the-step-ahead out-of-sample prediction is given as follows:
To do the above-mentioned procedure, we used STATA V. 14.0 and Excel. The filters, which can produce forecasts, was run through the tssmooth command. Each of the two methods operates differently and is suitable for a specified type of forecasting task.
To compare the forecasts provided by these methods, we constructed several forecasted counts of TB, pulmonary TB, extrapulmonary TB, new TB, and retreatment TB.
For choosing models, we used about 20% of all data (24 data) for testing the model and 80% of the data for training the model. We used the testing data to measure how well the model forecasts the latest data (12).
The optimization of parameters was done automatically with STATA according to the smallest root mean squared error for these time-series analysis techniques. Smoothing constant (α) lies between 0 and 1 and controls the amount of inertia in the local mean. The values of α near 0 produce very smooth series with slowly changing mean, and the values near 1 produce more volatile series with rapidly changing means (10). Forecast accuracy was calculated for 24 month-ahead forecasts by one of stand-alone measurement (RMSE) (12).
4. Results
During 132 months from April 2007 to March 2018, there were 12406 TB cases in Razavi Khorasan province, including 9273 (74.7%) cases of pulmonary TB and 3133 (25.3%) cases of extrapulmonary TB. All of the extrapulmonary TB cases were new cases but 8797 cases of pulmonary TB were new TB cases and 476 cases were retreatment TB cases. The annual data are given in Table 1.
| Year | Total TB Cases | Pulmonary TB | New pulmonary TB | Retreatment Pulmonary TB | Extrapulmonary TB |
|---|---|---|---|---|---|
| March 2008 | 1192 | 852 | 803 | 49 | 340 |
| March 2009 | 1258 | 926 | 876 | 50 | 332 |
| March 2010 | 1229 | 928 | 868 | 60 | 301 |
| March 2011 | 1230 | 906 | 857 | 49 | 324 |
| March 2012 | 1227 | 904 | 854 | 50 | 323 |
| March 2013 | 1057 | 806 | 761 | 45 | 251 |
| March 2014 | 1159 | 871 | 831 | 40 | 288 |
| March 2015 | 1098 | 839 | 802 | 37 | 259 |
| March 2016 | 1063 | 797 | 764 | 33 | 266 |
| March 2017 | 1004 | 757 | 722 | 35 | 247 |
| March 2018 | 889 | 687 | 659 | 28 | 202 |
Annual Data of TB Cases Reported in Razavi Khorasan Provincea
During 132 months from April 2007 to March 2018, there were 12406 TB cases in Razavi Khorasan province, including 9273 (74.7%) cases of pulmonary TB and 3133 (25.3%) cases of extrapulmonary TB. All of the extrapulmonary TB cases were new cases but 8797 cases of pulmonary TB were new TB cases and 476 cases were retreatment TB cases. The annual data are given in Table 1.

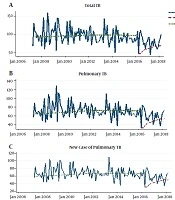
Time series plot for TB cases in Razavi Khorasan province from April 2007 to March 2018
Figure 1 represents the sketched time series plot of raw monthly counts of TB (type and site of the body) during the 11-year period from April 2007 to March 2018. According to raw series, the patterns of total cases of TB, total pulmonary TB, and new cases of pulmonary TB were almost the same. They illustrated a slow downward trend with oscillation around the trend that is a property of cyclic trend. For retreatment pulmonary TB cases and extrapulmonary TB cases, reductions occurred over time but with no patterns.
In the next stage to isolate the systematic component, we used two smoother techniques to remove noise components in a series. By using STATA on training data (April 2007 to March 20016), we obtained the optimization of parameters for five smoother techniques automatically. Table 2 gives the optimization of parameters for simple exponential and double exponential methods for total TB, pulmonary TB, new pulmonary TB, retreatment TB, and extrapulmonary TB series. The patterns are noisy with or without a secular trend. The values of smoothing constants of all series are near zero that indicates very smooth series with slowly changing counts.
| Smoother Technique | Parameter | Total TB | Pulmonary TB | New pulmonary TB | Retreatment Pulmonary TB | Extrapulmonary TB |
|---|---|---|---|---|---|---|
| Simple exponential | α | 0.0351 | 0.0304 | 0.0213 | 0.0353 | 0.0306 |
| Double exponential | α | 0.0266 | 0.0319 | 0.0313 | 0.0247 | 0.0001 |
The Parameters of TB Series Data for Two Smoothers Techniques
For using genuine forecasts, we needed to examine the accuracy. We calculated the forecast accuracy measures for the two models for each series. Table 3 shows forecast accuracy measures for two smoother techniques for estimating based on testing data of each series and Table 4 indicates the actual and forecast values according to fitted models for the period from March 2016 to March 2018. Thus, total TB, pulmonary TB, and new cases of pulmonary TB series had double exponential patterns with noisy and secular trend and they might be increasing in the 24 months ahead. The two other series, retreatment TB and extrapulmonary TB series, had simple exponential patterns with noisy and without secular trend and they might be with no change in the 24 months ahead.
Figure 2 shows the sketched time-series plot of actual, fitted, and forecasted values for monthly models estimated based on the training data (April 2007 to March 20016) and forecasts for the next 24 months (March 2016 to March 2018) were produced according to the fitted model for each series.
| Smoother Techniques | Total TB | Pulmonary TB | New pulmonary TB | Retreatment TB | Extrapulmonary TB |
|---|---|---|---|---|---|
| RMSE | RMSE | RMSE | RMSE | RMSE | |
| Simple exponential | 27.58 | 24.33 | 24.85 | 1.98 | 6.18 |
| Double exponential | 26.19 | 21.67 | 20.95 | 2.01 | 6.53 |
Forecast Accuracy Measures for two Smoother Techniques for Estimating Based on Testing Data of Each Series
| Month-Year | Total TB | Pulmonary TB | New pulmonary TB | Retreatment Pulmonary TB | Extrapulmonary TB | |||||
|---|---|---|---|---|---|---|---|---|---|---|
| Actual | Forecast | Actual | Forecast | Actual | Forecast | Actual | Forecast | Actual | Forecast | |
| Apr - 16 | 48 | 48 | 33 | 33 | 31 | 31 | 2 | 0 | 15 | 15 |
| May - 16 | 102 | 48.0266 | 85 | 33.0319 | 77 | 31.0313 | 8 | 2.0247 | 17 | 15.0002 |
| Jun - 16 | 111 | 48.0266 | 83 | 33.0319 | 83 | 31.0313 | 0 | 2.0247 | 28 | 15.0003 |
| Jul - 16 | 97 | 50.824 | 78 | 36.24536 | 75 | 33.82218 | 3 | 2.313869 | 19 | 15.0008 |
| Aug - 16 | 92 | 53.97702 | 68 | 39.18312 | 66 | 36.84744 | 2 | 2.206855 | 24 | 15.0035 |
| Sep - 16 | 72 | 56.27964 | 51 | 41.67207 | 49 | 39.24616 | 2 | 2.248315 | 21 | 15.0044 |
| Oct - 16 | 77 | 58.23121 | 56 | 43.42379 | 55 | 40.98609 | 1 | 2.240032 | 21 | 15.0063 |
| Nov - 16 | 61 | 59.06817 | 48 | 44.04002 | 46 | 41.61193 | 2 | 2.232021 | 13 | 15.0076 |
| Dec - 16 | 79 | 60.12939 | 61 | 44.93366 | 57 | 42.5705 | 4 | 2.176079 | 18 | 15.00889 |
| Jan - 17 | 80 | 60.31799 | 61 | 45.28812 | 55 | 42.93617 | 6 | 2.17036 | 19 | 15.00859 |
| Feb - 17 | 92 | 61.42967 | 66 | 46.42648 | 62 | 43.94972 | 4 | 2.26122 | 26 | 15.00929 |
| Mar - 17 | 93 | 62.54724 | 72 | 47.50823 | 66 | 44.79229 | 6 | 2.445113 | 21 | 15.01019 |
| Apr - 17 | 44 | 64.24016 | 41 | 48.84481 | 40 | 46.01767 | 1 | 2.525828 | 3 | 15.01248 |
| May - 17 | 73 | 65.91568 | 48 | 50.48575 | 47 | 47.42592 | 1 | 2.699909 | 25 | 15.01378 |
| Jun - 17 | 82 | 64.98405 | 67 | 50.12989 | 64 | 47.18816 | 3 | 2.626551 | 15 | 15.01148 |
| Jul - 17 | 68 | 65.5888 | 55 | 50.21968 | 52 | 47.38275 | 3 | 2.555794 | 13 | 15.01358 |
| Aug - 17 | 88 | 66.63331 | 69 | 51.47576 | 67 | 48.5964 | 2 | 2.583946 | 19 | 15.01367 |
| Sep - 17 | 73 | 66.90862 | 57 | 51.92725 | 55 | 49.02234 | 2 | 2.610992 | 16 | 15.01337 |
| Oct - 17 | 66 | 68.20635 | 54 | 53.21871 | 53 | 50.33505 | 1 | 2.588777 | 12 | 15.01427 |
| Nov - 17 | 60 | 68.67292 | 37 | 53.70361 | 35 | 50.85518 | 2 | 2.567302 | 23 | 15.01457 |
| Dec - 17 | 66 | 68.75546 | 51 | 53.97606 | 47 | 51.226 | 4 | 2.498348 | 15 | 15.01406 |
| Jan - 18 | 81 | 68.52091 | 66 | 53.18092 | 62 | 50.48365 | 4 | 2.480054 | 15 | 15.01576 |
| Feb - 18 | 88 | 68.60349 | 69 | 53.28442 | 68 | 50.49997 | 1 | 2.558765 | 19 | 15.01586 |
| Mar - 18 | 100 | 69.45696 | 73 | 54.30609 | 69 | 51.42195 | 4 | 2.63453 | 27 | 15.01596 |
The Actual and Forecast Values According to Fitted Models for the Period from March 2016 to March 2018

Actual, fitted, and forecasted values for monthly models according to the best fitting model for each series
5. Discussion
Adem and Ummu Atiqah (2009) showed that double exponential smoothing was the best forecasting model (9) and the results of the application of univariate forecasting models for TB cases in Kelantan (updated in 2014) indicated that the smallest MSE was related to Holt’s exponential smoothing method (8). Therefore, we used EWMAs models to determine which forecasting models forecast TB cases more accurately in Razavi Khorasan.
We considered a time series of monthly incidence of TB in Razavi Khorasan province from April 2007 to March 2018. The data included total TB, pulmonary TB, new pulmonary TB, retreatment TB, and extrapulmonary TB cases. The models were EWMAs models and the forecast accuracy measure was RMSE (10-12).
According to RMSE, total TB, pulmonary TB, and new pulmonary TB series had double exponential patterns and retreatment TB and extrapulmonary TB series showed simple exponential patterns.
This study indicated that total TB, pulmonary TB, and new pulmonary TB, and retreatment TB cases had slowly increasing trends with noisy patterns while pulmonary TB and extrapulmonary TB had somewhat unchanging trends with noisy patterns. These findings indicated that TB is an infection with low virulence and sputum smear-positive (SS+) patients are more important for the transmission of disease (13). We can also conclude that the number of persons getting infection over the time ahead depends on the number of infectious cases at present.
In our study, we considered all types of pulmonary. If we separated these patients into sputum smear-positive and sputum smear-negative patients, we would have clearer patterns. As shown in a study that forecasted the incidence of smear-positive TB in Iran, it had a seasonal pattern (14).
There are different factors affecting the incidence of TB in various areas, such as weather, epidemiological transition, drug resistance, HIV, migration, and poverty. These factors might increase the incidence of TB (5, 6, 15).
Another goal of this study was to do forecasting. We found that the number of total TB, pulmonary TB, and new TB cases might increase in the 24 months ahead. We forecasted no change in retreatment TB and extrapulmonary TB cases in the 24 months ahead.
A weakness of the forecasting method is that the trend of forecasting is influenced by the end value of the past data. If the last data level is higher than the earlier data, the forecasting section will have a growing trend and vice versa (11, 12).
The findings of this study and other studies from Iran and other countries indicate that the number of TB cases might increase (7, 14). In recent decades, our country has experienced immigrants from neighboring countries, sanctions or/and attack with category C of biological agents. Despite the fact that TB as a biological agent is not a present public health threat, it can be a growing hazard in the future. The predicted growth of TB might be alarming. The prediction of bioterrorist attacks is difficult but they can impose heavy demands on the public health care system (16, 17). Finally, according to the end TB strategy, MDG 6, target 8 is to stop and start to inverse the incidence of TB by 2015 and we joined the end TB strategy in January 2006. However, TB control remains one of the main public health concerns. Although the goals and functions of TB control programs are constant, for moving toward TB elimination, our implementation requires changes in strategies and activities and should evolve over time. Recently, healthcare delivery systems are changing, as there is a trend toward the increased privatization of health care for the delivery of services; these can also create opportunities. A way to develop controlling programs and allocation of resources is reviewing the temporal changes and forecasting.
