


1. Background
Cardiac defects are the most common congenital malformations in infants (1, 2), with a prevalence of 1% in about 4,000 live births per year in the United States (3). In Iran, out of 1,570,000 births, 9,000 to 12,000 infants have heart disease (2). Since more than half of these children need surgery during the first year of life (4), they are at risk for postoperative pulmonary complications that are associated with increased mortality (4, 5). It has been reported that the incidence of postoperative pulmonary complications (PPC) is 8% to 79% (5). These patients often require long-term mechanical ventilation in the ICU due to inherent lung disease and impaired ventilation (6, 7). Prolonged mechanical ventilation leads to numerous serious side effects, and it can increase the length of hospital stay and health costs (7).
Although early extubation (within 24 hours postoperatively) has been recently used as part of the management strategy for children undergoing heart surgery (8) and is expected to reduce postoperative complications and the length of hospital stay (9), respiratory failure after extubation in children undergone heart surgery is common and associated with high mortality (7). Thus, proper respiratory support is critical after removing the endotracheal tube and preventing acute respiratory failure (ARF). Oxygen therapy with high-flow nasal cannula (HFNC), as a new model of respiratory support, can provide up to 100% heated and moist oxygen using very high flow (up to 60 liters per minute) (4, 10). The 24-hour use of HFNC has been reported to significantly reduce the risk of re-intubation after extubation in adults compared to conventional oxygen therapy (5). The use of HFNC leads to accurate oxygen delivery, the reduction of nasopharyngeal dead space, and airway resistance (7). In addition, HFNC is easy-to-use and more tolerable than masks, especially in children (5). High-flow nasal cannulas are currently applied to patients of all age groups (11-15). There are limited studies on the use of HFNC for infants and children after congenital heart surgery, particularly after early extubation (4, 10, 16, 17). In this study, we aimed to investigate the effect of using high-flow nasal oxygen (HFNC) on respiratory parameters and pulmonary complications in children undergoing congenital heart surgery as a supportive method of oxygenation after early extubation.
2. Objectives
The primary objective of the study was to evaluate whether HFNC was able to improve atelectasis as a significant postoperative pulmonary complication and increase the Poa2/Fio2 ratio as the most important respiratory parameter after extubation postoperatively in children undergoing heart surgery.
The secondary objectives of the study were to assess whether HFNC was able to improve the following parameters: (1) PaO2 and PaCO2 elimination values at different time points up to 36 h post extubation; (2) the incidence rate of postoperative pulmonary complications; (3) the rate of extubation failure; and (4) the frequency of need for inotropic drugs after heart surgery.
3. Methods
This randomized controlled study was performed in a 10-bed pediatric intensive care unit during March 2020 and September 2020. This study was approved by the Ethics Committee of the School of Nursing and Midwifery of Sabzevar University of Medical Sciences (code of ethics: IR.MEDSAB.REC.1398.049) and registered in Iran clinical trial with IRCT number: IRCT20190917044792N1. Consent was obtained from at least one parent or legal guardian before enrollment. Overall, 105 children aged 1 to 24 months undergoing congenital heart surgery using cardiopulmonary bypass with Risk Adjustment for Congenital Heart Surgery (RACHS) 2 or 3 were intended in the study.
The allocation sequence was generated by a computerized random generation program stratified by two age groups. The children were evaluated for eligibility before surgery and randomized upon entering the operating room to receive either HFNC or conventional oxygen therapy after extubation in the ICU.
The inclusion criteria consisted of the absence of other comorbidities or preoperative infection, the need for mechanical ventilation before surgery, malnutrition, and moderate to severe anemia. The patients were excluded if they had a cardiac arrest during the surgery or in the ICU or if they had been returned to the operating room for re-operation for any reason.
All the patients underwent similar anesthesia, including ketamine, sufentanil, or fentanyl, for induction, atracurium to facilitate endotracheal intubation, and muscle relaxation during surgery, and sufentanil with atracurium for maintenance.
All the patients underwent a cardiopulmonary bypass and were transferred to the pediatric cardiac intensive care unit (PCICU) for recovery and postoperative care. Intravenous paracetamol, fentanyl, and dexmedetomidine were used for postoperative analgesia and sedation. The patients were ventilated using assisted pressure-regulated volume control (PRVC) mode and were weaned off the ventilator if they were hemodynamically stable without the need for high-dose vasopressor (defined as a vasopressor score more than 20) (18), besides having no bleeding, arrhythmia, electrolyte and acid-base disorders, or significant changes in chest radiography with appropriate oxygenation and ventilation. They were placed on the pressure support (PS) mode to continue the process of weaning and were extubated if SPO2 ≥ 92% with FiO2 ≤ 50%, with the respiration rate of 20 - 60 for 0 to 6-month-old patients, and 15 - 45 for 6-month to 2-year-old ones, and a spontaneous tidal volume more than 4 ml per kg body weight, as well as the end tidal CO2 (ETCO2) less than 45 mmHg for at least 4 hours (19, 20).
The children continued the study if they were extubated in less than 24 hours. High-flow nasal cannula, using the Fisher & Paykel MR850 series, was applied with appropriate nasal cannulas based on age and weight. The gas mixture was set at 2 liters/kg for the first ten kilograms and half a liter/kg per min with FiO2 equal to 40%. The control group received conventional oxygen therapy with a simple nasal cannula and a flow rate of 5 lit/min, which produced 36-40% FiO2. The arterial blood samples (PaO2-PaCO2-PaO2/FiO2-SpO2) were collected and analyzed by Gem Premier 3000 before anesthesia induction, while entering the ICU, 6 hours after being admitted to the ICU, during mechanical ventilation, before extubation, and immediately and 1, 6, 12, 24, and 36 hours after extubation. Respiratory failure was defined as arterial oxygen pressure less than 50 mmHg, carbon dioxide pressure more than 50 mmHg, with arterial pH less than 7.35, or the symptoms of tachypnea, using accessory respiratory muscles, nasal flaring, or intercostal retraction (21). Postoperative pulmonary complications (PPC), such as atelectasis, pleural effusion, and pneumothorax, were assessed using chest X-ray or daily lung ultrasound. Demographic information (i.e., age, height, weight, body mass index, and diagnosis based on RACHS system) and comorbidities, surgical information, including CPB time and aortic clamp time, duration of surgery, duration of mechanical ventilation, the need for re-ventilation, and the length of ICU stay were collected according to the prepared checklist.
3.1. Statistical Analysis
All data were collected in Microsoft Excel 2007 (Redmond, Washington: Microsoft) database. SPSS version 25 was used for statistical analysis. Numerical variables were expressed as mean ± SD when appropriate. Inter-group comparisons for data with a normal distribution were performed using Student’s t-test, and between-group comparisons for data without a normal distribution were performed using the Mann-Whitney U test. Categorical variables were compared using χ2 (chi-squared test). A P-value of less than 0.05 was considered significant.
3.2. Sample Size
The study was powered on the primary outcome, based on institutional retrospective data: considering a mean (SD) PaO2/FiO2 ratio, 1 h after extubation, of 300 (10) torr, and a 6-torr PaO2/FiO2 difference between the two groups, to achieve 80% statistical power with an α error of 0.05, the number of patients was calculated to be 49 for each group, including six dropouts per arm.
4. Results
Due to the prevalence of COVID-19, all heart surgeries at Imam Reza Hospital were canceled twice during the sampling period for 40 days; thus, within the allowed time for the study, a total of 105 samples could be selected. Thirteen patients were excluded during the study, and 92 patients completed it (Figure 1).
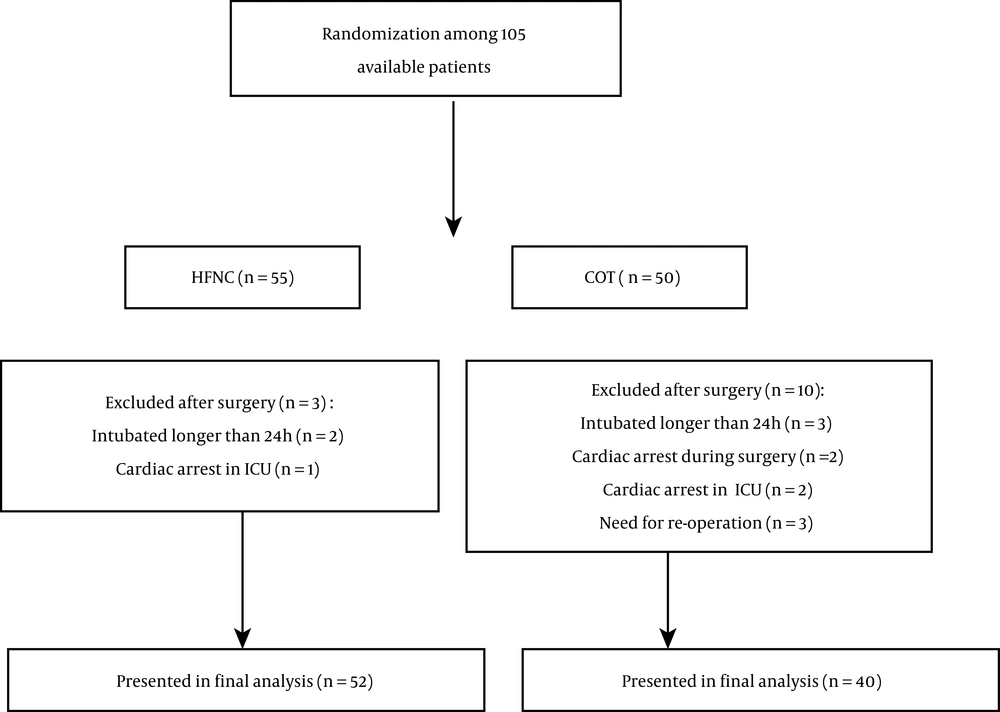
Figure 1.
Study flowchart
The mean age of the patients in the HFNC and control groups were 8.06 and 10.16 months, respectively (P > 0.05), with mean weights of 6.50 and 6.70 kg, respectively (P > 0.05). There was no significant difference in surgical characteristics between the two groups (P > 0.05; Table 1).
Table 1.Surgical Characteristics of the Patients a
| Variable | HFNC | Control | t-Test P-Value |
|---|---|---|---|
| Duration of surgery (min) | 132.83 ± 32.71 | 129.37 ± 26.15 | 0.603 |
| Cardiopulmonary bypass (min) | 78.79 ± 23.06 | 75 ± 21.52 | 0.442 |
| Aortic cross-clamp (min) | 55.61 ± 18.23 | 54.51 ± 17.14 | 0.778 |
| Mechanical ventilation (h) | 10.70 ± 5.14 | 10.29 ± 5.24 | 0.721 |
aValues are expressed as mean ± standard deviation.
There was no significant difference in m-RAS scale for atelectasis before surgery; however, during the first two days after surgery, the mean m-RAS score was significantly lower in the HFNO group compared to the control group (P < 0.05). However, the difference was not significant on the third post-operative day (P > 0.05; Table 2).
Table 2.Comparison of m-RAS Score in the Two Groups at Different Timesa
| Time | HFNC | Control | t-Test P-Value |
|---|---|---|---|
| Entrance to OR | 8.02 ± 0.48 | 7.29 ± 0.47 | 0.459 |
| Entrance to ICU | 7.47 ± 0.5 | 6.86 ± 0.51 | 0.326 |
| First day after surgery | 5.47 ± 0.48 | 7.29 ± 0.5 | 0.001 |
| Second day after surgery | 2.29 ± 0.25 | 5.19 ± 0.28 | 0.000 |
| Third day after surgery | 0.459 ± 0.00 | 0.459 ± 0.00 | 0.459 |
aValues are expressed as mean ± standard deviation.
After the surgery, the incidence of respiratory failure decreased in both groups with no significant difference between them (P > 0.05; Table 3)
Table 3.Incidence of Respiratory Failure in the Groupsa
| Variables | HFNC | Control | χ2 P-Value |
|---|---|---|---|
| Before surgery | 31 (60.8) | 20 (50) | 0.957 |
| Upon entry into the ICU | 22 (25.9) | 9 (10.6) | 0.497 |
| DAY1 | 14 (16.5) | 15 (17.6) | 0.754 |
| DAY2 | 2 (2.8) | 1 (1.4) | 1.000 |
aValues are expressed as No. (%).
PaO2/FiO2 was similar before extubation in both groups (P > 0.05). However, the values were significantly better in the HFNC than in the control group after extubation (P > 0.05; Table 4).
Arterial PCO2 was also similar before extubation in both groups (P > 0.05) and was lower in the HFNC group compared to the control group after extubation (P > 0.05; Table 4).
Table 4.PaO2/FiO2 and PaCO2 in the HFNC and Control Groupsa
| Time | PaO2/FiO2 | PaCO2 | ||||
|---|---|---|---|---|---|---|
| HFNO Group | Control Group | t-Test P-Value | HFNO Group | Control Group | t-Test P-Value | |
| Before surgery on room air | 241.86 ± 121.75 | 275.40 ± 114.46 | 0.202 | 40.72 ± 6.14 | 38.67 ± 5.98 | 0.129 |
| At the first hour of ICU admission | 238.90 ± 64.96 | 256.31 ± 68.18 | 0.235 | 36.72 ± 4.34 | 35.14 ± 4.78 | 0.115 |
| The first 6 hours after ICU admission | 258.00 ± 93.95 | 248.57 ± 79.06 | 0.628 | 37.49 ± 4.49 | 36.83 ± 4.4 | 0.500 |
| Before extubation | 310.39 ± 79.98 | 298.52 ± 61.02 | 0.476 | 36.33 ± 2.73 | 36.19 ± 2.71 | 0.819 |
| After extubation | 268.41 ± 80.95 | 245.49 ± 57.96 | 0.154 | 37.92 ± 3.62 | 38.42 ± 3.47 | 0.524 |
| 1 h after extubation | 278.41 ± 88.52 | 238.23 ± 44.75 | 0.001 | 36.75± 2.66 | 38.41 ± 3.35 | 0.014 |
| 6 h after extubation | 305.43 ± 93.22 | 248.23 ± 74.37 | 0.003 | 36.39± 2.99 | 39.39 ± 3.98 | 0.000 |
| 12 h after extubation | 326.58 ± 95.14 | 268.00 ± 77.87 | 0.009 | 36.37± 2.87 | 38.38 ± 4.51 | 0.021 |
| 24 h after extubation | 362.17 ± 86.35 | 295.50 ± 69.28 | 0.002 | 36.79± 1.39 | 36.87 ± 1.2 | 0.002 |
| 36 h after extubation | 370.31 ± 75.41 | 311.17 ± 68.60 | 0.002 | 35.39± 0.85 | 36.50 ± 1.02 | 0.000 |
aValues are expressed as mean ± standard deviation.
The incidence rates of endotracheal reintubation were 9.6% and 47.5% in the HFNC and control groups, respectively (P < 0.013). The patients had a shorter ICU stay in the HFNC group (2.55 ±0.53 days) than the control group (3.34 ± 0.59 days) group (P < 0.001). The patients were similar with regard to frequency of pleural effusion, pneumothorax (Table 5), and the need for inotropic drugs (P = 0.403).
Table 5.Frequencies of Pleural Effusion and Pneumothorax in the HFNC and Control Groupsa
| Time | Pleural Effusion | Pneumothorax | ||||
|---|---|---|---|---|---|---|
| HFNO Group | Control Group | P-Value | HFNO Group | Control Group | P-Value | |
| Entrance to OR | 22 (44) | 15 (9.42) | 0.917 | - | - | - |
| Entrance to ICU | 25 (49) | 17 (48.6) | 0.967 | 1 (2) | 1 (1.2) | 0.405 |
| First day after surgery | 24 (47.1) | 20 (57.1) | 0.358 | 3 (5.9) | 4 (4.7) | 0.513 |
| Second day after surgery | 5 (10.6) | 4 (17.4) | 0.428 | 1 (2.1) | 1(1.4) | 0.428 |
aValues are expressed as No. (%).
5. Discussion
We evaluated the effect of HFNC on respiratory parameters and pulmonary complications in children with congenital heart problems and undergoing heart surgery as a supportive method of oxygenation after early extubation.
High-flow nasal cannula has recently been applied to all age groups (15, 22-24). It provides 100% heated and moist oxygen using very fast nasal flow up to 60 liters per minute (13, 24), increasing nasopharyngeal pressure at the end of exhalation and decreasing nasopharyngeal anatomical dead space that appears to improve ventilation and oxygenation besides decreasing airway resistance (11, 19, 25-27).
The results of this study showed a greater decrease in atelectasis in the HFNC group in addition to better PaO2/FiO2 and PaCO2, as well as less need for re-intubation compared to the control group. Liew et al. reported that an increase in the flow of HFNC from 2 to 8 liters per minute significantly increased PEEP with an average of 2.3 to 6.1 cm H2O in infants (P < 0.001) (24).
Our findings are in agreement with those of Yu et al., who reported a significant improvement in PaO2/FiO2 using HFNC in the first 72 hours after extubation (P < 0.05) (23). In another study by Akyildiz et al., the modified radiological atelectasis score (m-RAS) for HFNC group decreased steadily compared to that of the control group (P = 0.001), and PCO2 levels were better in the first 24 hours (P = 0.008) with less extubation failure rate (P = 0.007) (28). Whereas, in the study of Testa et al., the level of PaCO2 and the re-intubation rate were not significantly different in HFNC and conventional oxygen therapy (COT) groups (17). Similar to the present study, they used RACHS scale to select the study sample. However, oxygenation status and respiratory parameters were not evaluated before the intervention, and neither was there a definite protocol for inducing and maintaining anesthesia or the ultrafiltration of the cardiopulmonary pump in the operating room, nor a known protocol for sedation in the ICU, which could possibly affect the extubation failure. In contrast to the present study, the duration of mechanical ventilation was not evaluated. Furthermore, the patients underwent early extubation in the first 24 hours to reduce the pulmonary complications of mechanical ventilation.
Our results showed that the incidence of respiratory failure was not significantly different in the HFNC and the control groups; however, it steadily decreased during the first 48 hours in the HFNC group (Table 3). Shioji et al. reported that the incidence of postoperative respiratory failure reduced using HFNC, with no control group. They defined HFNC effectiveness as the prevalence of respiratory failure less than 10% (4). On the other hand, Soonsawad et al. did not find a significant difference in respiratory failure using HFNC in comparison to CPAP; nevertheless, they stated that it could be used as an alternative to CPAP, due to its reduced dryness and damage to the nasal mucosa (29). The researchers defined respiratory failure based on respiratory parameters; however, in other studies, only the need for re-intubation was considered a criterion for respiratory failure (4, 17).
Researchers have also discovered that the need for inotropic drugs was similar in the two groups, which is in contrast to the results of Inata et al., suggesting that treatment with HFNC could help reduce overload and stress on both respiratory and the cardiovascular systems by creating positive pressure and reducing sympathetic nervous system activity (13). However, due to the anatomical and physiological conditions of congenital heart disease patients, it is necessary to consider different effects on hemodynamics when using HFNC. Respiratory and cardiac pathophysiology in these patients can influence the effect of the positive pressure produced by HFNC, and systolic blood pressure (SBP) may significantly be reduced in patients with serial circulation after treatment with HFNC. This reduction is probably due to decreased sympathetic activity and heart rate (13). The present research has been the first interventional study examining vasoactive-inotropic score (VIS) in children using HFNC after heart surgery; thus, we suggest further studies in this field with a different a type of disease (mono-ventricular, serial blood flow), physiologically (right to left shunt, high pulmonary blood flow, and low pulmonary blood flow), and surgery performed for different types of shunting (Glenn shunt, BT shunt, and Fontan shunt).
The present study revealed that the frequencies of pleural effusion and pneumothorax were not significantly different in the two groups, which might indicate the higher safety level of HFN. It is consistent with the result of the study of Testa et al., stating that the HFNC did not result in added complications in pediatric heart patients (17).
Our study has several limitations. First, some patients' families refused to participate in the study due to the coronavirus pandemic. Another drawback was loss of research samples due to various factors such as cardiac arrest during and after surgery and return to the operating room after surgery from the ICU for various reasons, such as bleeding or severe cardiorespiratory failure. Finally, since HFNC system is more expensive than COT (HFNC costs approximately 15 $ per patient vs. approximately 2.20 $ for COT) and HFNC is not included in intensive care payment system, the clinical application of HFNC may be advised for selected patients in PCICU. Although this system seems appears to be more expensive than others, it lowers the duration of ventilator use and its complications and reduces the length of treatment and hospital stay. The evaluation of the cost-effectiveness of HFNC compared to other noninvasive respiratory systems was beyond the scope of this study.
5.1. Conclusions
The researchers found that using HFNC is a supportive method of oxygen delivery after early extubation following pediatric congenital heart surgery. It can also reduce pulmonary complications, improve respiratory parameters, and curtail the lengths of ICU and hospital stay.

