


1. Background
Childhood and adolescent obesity are associated with many disorders such as nonalcoholic fatty liver disease (NAFLD), insulin resistance, diabetes, growth and sexual dysfunction, and metabolic syndrome (1, 2). NAFLD is children's most frequent form of liver disease (3). It is defined as the infiltration of fat into more than 5% of liver cells (4) with metabolic syndrome consisting of dyslipidemia, insulin resistance, and obesity (3). Nonalcoholic steatohepatitis (NASH) can result in liver fibrosis and cirrhosis in about 30% of obese adults. Fibrosis (71%) and steatohepatitis (88%) were reported in liver biopsies of obese children with fatty liver and elevated aminotransferases (5). NAFLD diagnosis is usually achieved with noninvasive methods, including liver ultrasonography and serology markers such as alanine aminotransferase (ALT), which are less specific, and liver biopsy as an invasive technique, which is the gold standard (5). The ultrasonic method is reliable when steatosis occurs in at least 33% of hepatocytes (6). NAFLD can occur even when liver-associated enzymes (LAEs) are normal (5).
Both children and adults with NAFLD have shown insulin resistance aggravated by oxidative stress (7). The increase of triglycerides and probably free fatty acids is another pathogenesis of NAFLD (8). The preferred treatment approach in NAFLD is decreasing oxidative stress and insulin resistance (9). Currently, the treatments focus mainly on controlling medical problems and disorders that cause fatty liver. The related supportive therapy includes changing lifestyle, doing more extensive exercises, and following appropriate diets leading to weight loss and improvements in insulin sensitivity (10). Since lifestyle changes in adolescents are less attainable, and the endured progression of NAFLD leads to cirrhosis, other further treatment options are essential. These alternatives include insulin sensitizers and antioxidants. Insulin sensitizers like metformin increase liver sensitivity to insulin and reduce ALT levels (5). Antioxidants, especially vitamin E that reduce oxidative stress, are considered second-degree agents after insulin sensitizers in treating pediatric NAFLD (10, 11).
There is also much controversy about the effect of metformin and vitamin E on fatty liver disease. For example, although the efficacy of vitamin E compared to placebo has been reported in the treatment of adult nonalcoholic steatohepatitis, no differences have been reported between the therapeutic effects of vitamin E, metformin, and placebo on fatty liver disease in obese children. Due to limited information and disagreement about the therapeutic efficacy of metformin and vitamin E in improving fatty liver in children, this clinical trial was performed to evaluate the efficacy of vitamin E and metformin on serum levels of hepatic transaminases and the degree of fatty infiltration in the liver using ultrasound (USG) in obese children with NAFLD. According to the results of the present study, we can help reduce the potential consequences of fatty liver disease in children.
2. Methods
This clinical trial was performed on 150 nondiabetic obese children with nonalcoholic fatty liver. Samples were taken from children admitted to the endocrinology clinic of the Children’s Hospital in Qazvin, Iran, who were referred for diagnostic-therapeutic measures from 2018 to 2019. Sampling in the present study was simple. Randomization was done with a random number list. The patients were assigned to one of the treatment groups using the randomized block sampling method (Figure 1), without loss to follow-up. The present study was designed as a triple-blind study, and the patients, the pediatric endocrinologist, and the statistician were unaware of the intervention.
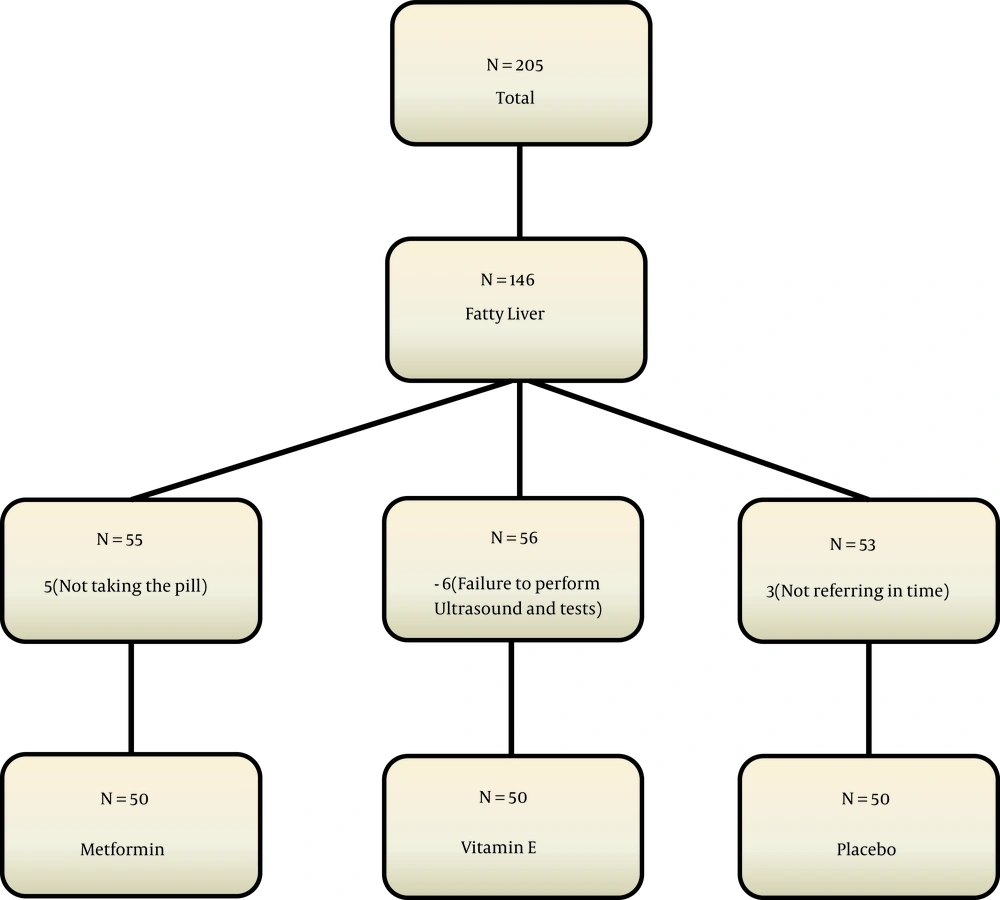
Figure 1.
The consort flowchart
We calculated the minimum sample size in each group as 46 people according to Shiasi Arani et al.'s study (12). Finally, 60 people were included in each group due to the loss of about 25% and power of 80%.
α = 0.05; β = 0.2; P1 = 5%; P2 = 25%; Z1-α/2 = 1.96; Z1-β = 0.84
Inclusion criteria consisted of patient satisfaction, age between 10 and 14 years, the body mass index (BMI) above 95% (13), the nonalcoholic fatty liver disease, which was diagnosed with increased serum ALT level ( > 60 U/L), and confirmation of fatty liver with ultrasonography (14).
Exclusion criteria were patients with diabetes or pre-diabetes, BMI below 95%, a history of alcohol consumption, inherited diseases related to obesity such as Prader Willi syndrome, pathological obesity such as Cushing's syndrome, hypothyroidism, pseudo-hypoparathyroidism, chronic kidney or liver disease such as cirrhosis, and parental dissatisfaction with participating in the study.
Viral hepatitis (HAV, HBV, and HCV) and other possible viral or bacterial infections were also ruled out by necessary studies such as HAV IgM, HBS Ag, HBS Ab, and HCV Ab in the subjects. Patients with a history of taking drugs that can increase liver enzymes, such as nonsteroidal anti-inflammatory drugs (NSAIDs), antibiotics, anticonvulsants, and statins, were excluded from the study. Also, disorders, such as autoimmune hepatitis (by electrophoresis of serum proteins, ANA, ASMA, anti LKM), Wilson's disease (with 24-hour urinary copper, serum ceruloplasmin), Hemochromatosis (with serum Fe, TIBC, Ferritin), Celiac disease [with anti TTG (IgA), total IgA] and hypothyroidism (with TSH and T4), were ruled out (15).
The patients were included in the study after obtaining informed consent from them and their parents. In the first group, patients were treated with metformin Glucophage (Merck) at a dose of 500 mg twice daily for three months. Patients in the second group were treated with vitamin E capsules (EuRHO VITAL) at a dose of 400 units twice daily. In the third (control) group, patients were given a placebo. In addition, all the patients were given a proper diet and advised to increase their physical activity. Recommendations for changing lifestyle, exercising, and following diets appropriate for weight loss were made to all the three groups by a nutritionist who was unaware of the treatment process. Unaware of the grouping, one of the facilitators followed the patients' diets and exercise programs weekly.
The choice of metformin and vitamin E was made based on previous studies showing that these drugs are safe for treating NAFLD in children (16, 17).
Weight, height, level of fasting blood sugar, fasting insulin, lipid profile, serum ALT, and aspartate aminotransferase (AST) were measured before and after three months of treatment. Any side effects from the above drugs were carefully monitored and recorded during treatment. Also, the participants were not allowed to use over-the-counter or other herbal medicines to treat NAFLD, liver disease, obesity, or diabetes.
BMI, the insulin sensitivity index (HOMA), and TyG indices (18) were calculated using the following equations: BMI = one’s weight in kilograms divided by the square of their height in meter (kg/m2); HOMA-IR = Fasting serum insulin (mm/L) × Fasting plasma glucose (mmol/L)/22.5; TyG = LN [Fasting triglyceride (mg/dL) × Fasting plasma glucose (mmol/L) /2].
An expert radiologist who performed ultrasonography was not aware of the treatment process. At the beginning of the study, ultrasonography was performed to determine the degree of fatty liver, which was compared with the ultra-sonographic findings after three months of intervention based on the below criteria (19):
- Grade I: A slight diffuse increase in fine echoes in the hepatic parenchyma with normal visualization of the diaphragm and intrahepatic vessel borders.
- Grade II: A moderate diffuse increase in fine echoes with slightly impaired visualization of the intrahepatic vessels and diaphragm.
- Grade III: An increase in fine echoes with poor or no visualization of the intrahepatic vessel borders, diaphragm, and posterior portion of the right lobe of the liver.
Decreasing ALT to half of the baseline level or less than 40 U/L was considered a decrease in ALT after three months of treatment.
This study was approved by the Ethics Committee of the Qazvin University of Medical Sciences (IR.QUMS.REC.1396.88) and received IRCT code IRCT2017061334514N1. In addition, informed consent was obtained from the children’s guardians. All patient information was kept confidential by the researchers.
The frequency of data was determined, and the Kolmogorov-Smirnov test was used to evaluate the normality of quantitative data. Also, the chi-square test and Fisher's exact test were used to examine the relationship between qualitative variables. Analysis of variance with repeated measures was used to examine mean differences between the groups, and paired t-test was used to compare means within the groups. SPSS software version 23 was used to analyze the data. A significance level of less than five was considered.
3. Results
Of the 150 participating patients, 79 (52.7%) were male. The minimum and maximum ages of the patients were 10 and 14 years, respectively. The frequency distribution and mean of the base variables are shown in Table 1. The statistical test did not show any statistically significant difference between variables consisting of gender, age, systolic blood pressure, diastolic blood pressure, waist circumference, neck circumference, hip circumference, hemoglobin level, fasting blood sugar, TSH level, and the maternal and paternal height of the three groups. Also, the three groups were not statistically different in terms of mean height, weight, insulin level, fatty liver, total cholesterol, TG, HDL, LDL, AST, ALT, and BMI at the beginning of the study (Table 2). The mean insulin resistance index (HOMA-IR) and the mean triglyceride and glucose index (TyG Index) were not significantly different between the three groups (P > 0.05) (Table 3).
Table 1.Baseline Characteristics of Participants According to Treatment Group a
| Variables | Metformin (n = 50) | Vitamin E (n = 50) | Control (n = 50) | P-Value |
|---|---|---|---|---|
| Gender; No. (%) | 0.974 | |||
| Male | 27 (34.2) | 26 (32.9) | 26 (32.9) | |
| Female | 23 (32.4) | 24 (33.8) | 24 (33.8) | |
| Age (y) | 11.8 ±1.6 | 12.1± 1.7 | 12.2 ±1.5 | 0.453 |
| Systolic blood pressure (mmHg) | 112.9 ± 12.5 | 110.5 ± 10.8 | 107.4 ± 14.3 | 0.096 |
| Diastolic blood pressure (mmHg) | 74.2 ± 6.4 | 72.8 ± 7.2 | 70.9 ± 7.4 | 0.061 |
| Waist circumference (cm) | 97 ±11.3 | 96.4 ±10.9 | 97.8 ±11.8 | 0.817 |
| Neck (cm) | 34.5 ± 2.8 | 35.2 ± 4.6 | 34.5 ± 2.7 | 0.452 |
| Hip (cm) | 96.4 ± 11.8 | 97.2 ± 12.3 | 98.2 ± 14.4 | 0.794 |
| MCV | 78.6 ± 6.9 | 78.4 ± 5.8 | 78.7 ± 4.5 | 0.967 |
| Hb | 13.8 ± 1.1 | 13.5 ± 1.5 | 13.7 ± 1.0 | 0.382 |
| FBS | 91.4 ± 94 | 88.7 ± 6.9 | 90.3 ± 7.4 | 0.237 |
| TSH | 2.9 ± 0.8 | 3.0 ± 1.3 | 2.8 ± 1.4 | 0.625 |
| Mother height (cm) | 158.4 ± 5.4 | 159.2 ± 5.5 | 159.1 ± 5.9 | 0.753 |
| Father height (cm) | 170.5 ±5.5 | 171.8 ± 5.9 | 173.3 ± 4.5 | 0.037 |
a Values are expressed as mean ± SD unless otherwise indicated.
Table 2.Basic and Post-treatment Characteristics of Participants Based on Sex a
| Variables | Metformin (n = 50) | Vitamin E (n = 50) | Control (n = 50) | P-Value |
|---|---|---|---|---|
| Height (cm) | ||||
| Before treatment | 147.9 ± 9.9 | 148.9 ±11.0 | 149.8 ± 10.6 | 0.704 |
| After treatment | 149.9 ±9.7 | 150.8 ± 10.9 | 151.8 ±10.8 | 0.676 |
| Weight (cm) | ||||
| Before treatment | 64.1 ± 16.2 | 63.3 ± 13.2 | 65.3 ± 20.4 | 0.829 |
| After treatment | 63.8 ± 15.6 | 63.6 ± 12.5 | 67.1 ± 19.3 | 0.461 |
| BMI (kg/m2) | ||||
| Before treatment | 28.9 ± 4.4 | 28.5 ± 3.3 | 28.6 ± 5.3 | 0.918 |
| After treatment | 27.9 ± 4.1 | 27.8 ± 4.1 | 28.5 ± 4.9 | 0.711 |
| ALT (U/L) | ||||
| Before treatment | 55.72± 12.7 | 55.38± 17.7 | 58.57 ± 17 | 0.364 |
| After treatment | 40.24 ± 7.4 | 39.48 ± 6.5 | 47.7 ± 14 | 0.001 |
| AST (U/L) | ||||
| Before treatment | 53.6 ± 5.9 | 55.3 ± 15.2 | 54.9 ± 8.7 | 0.709 |
| After treatment | 42.3 ± 6.3 | 42.9 ± 6.5 | 44.6 ± 7.2 | 0.201 |
| Low-density lipoprotein (mg/dL) | ||||
| Before treatment | 91.5 ± 22.9 | 95.4 ± 17.4 | 98.9 ± 24.6 | 0.239 |
| After treatment | 91.8 ± 20.1 | 93.7 ± 18.6 | 94.7 ± 22.7 | 0.773 |
| High-density lipoprotein (mg/dL) | ||||
| Before treatment | 42.2 ± 7.8 | 40.9 ± 8.5 | 43.7 ± 13.2 | 0.406 |
| After treatment | 43.2 ± 5.9 | 41.2 ± 6.9 | 46.2 ± 19.9 | 0.145 |
| Triglycerides (mg/dL) | ||||
| Before treatment | 135.9 ± 72.8 | 149.1 ± 72.7 | 128.1 ± 55.3 | 0.291 |
| After treatment | 129.7 ± 67.1 | 149.4 ± 66.1 | 132.9 ± 57.4 | 0.251 |
| Total cholesterol (mg/mL) | ||||
| Before treatment | 160.3 ± 27.9 | 156.2 ± 27.9 | 159.1 ± 35.1 | 0.793 |
| After treatment | 156.8 ± 29.9 | 157.1 ± 26.7 | 159.7 ±28.1 | 0.851 |
Abbreviations: BMI, body mass index; ALT, alanine aminotransferase; AST, aspartate aminotransferase.
a Values are expressed as mean ± SD.
Table 3.Baseline Characteristics of Participants According to Sex and Presence of Insulin Resistance a
| Variables | Metformin (n = 50) | Vitamin E (n = 50) | Control (n = 50) | P-Value |
|---|---|---|---|---|
| HOMA-IR index before | 4.7 ± 0.2 | 4.7 ± 0.3 | 4.6 ± 0.2 | 0.435 |
| HOMA-IR index after | 3.04 ± 1.85 | 3.15 ± 1.64 | 4.1 ± 0.11 | 0.211 |
| P-value | 0.029 | 0.001 | 0.984 | |
| TyG index before | 5.73 ± 0.47 | 5.79 ± 0.49 | 5.66 ± 0.48 | 0.438 |
| TyG index after | 5.66 ± 0.45 | 5.78 ± 0.43 | 5.68 ± 0.45 | 0.347 |
| P-value | 0.040 | 0.913 | 0.529 |
Abbreviations: HOMA-IR, the homeostasis model assessment for insulin resistance; TyG index, a product of triglyceride and fasting glucose.
a Values are expressed as mean ± SD.
In the ultra-sonographic study, after the intervention, the fatty liver grade decreased more in the group using metformin than in the other two groups (P < 0.05), and the fatty liver grade after the intervention was not significantly different between the two groups of metformin and vitamin E (P = 0.578). The fatty liver grade was significantly different after the intervention between the metformin and control groups, with a higher decrease observed in the metformin group (P = 0.004). Also, the fatty liver grade after the intervention was significantly different between the vitamin E and the control groups, with a higher decrease observed in the vitamin E group (P = 0.007) (Table 4).
Table 4.Comparison of Insulin Levels and Liver Grade Before and After Intervention in Three Groups a
| Variables | Metformin | P-Value | Vitamin E | P-Value | Control | P-Value b |
|---|---|---|---|---|---|---|
| Insulin level | <0.001 | <0.001 | 0.001 | |||
| Before treatment | 19.01 ± 18.21 | 18.79 ± 14.32 | 17.95 ± 14.59 | |||
| After treatment | 12.71 ± 8.25 | 14.47 ± 7.27 | 18.06 ± 20.58 | |||
| Liver grade | <0.001 | 0.001 | 0.317 | |||
| Before treatment | 1.12 ± 0.32 | 1.10 ± 0.30 | 1.06 ± 0.24 | |||
| After treatment | 0.78 ± 0.58 | 0.88 ± 0.32 | 1.02 ± 0.14 |
a Values are expressed as mean ± SD.
b Wilcoxon rank sum test.
4. Discussion
This study aimed to compare the effect of metformin and vitamin E against placebo on fatty liver ultrasonic and biochemical findings.
Fasting blood insulin levels significantly decreased in both metformin and vitamin E groups but increased in the control group compared to before the intervention. The fasting blood insulin reduction rate was much higher in the metformin group than in the vitamin E group.
Nadeau et al. reported that six months after metformin administration and lifestyle changes in adolescents with nonalcoholic fatty liver disease, fasting insulin levels improved significantly in all subjects (5), which agrees with the present study results. Ackam et al.’s study on the effect of metformin and vitamin E compared to diet therapy on obese patients aged 9 - 17 years with hepatic steatosis (20) showed that BMI was significantly reduced in all three groups which is similar to our study results. In treating obese patients with nonalcoholic fatty liver, metformin is much more effective than vitamin E in reducing insulin resistance and improving metabolic indicators such as fasting insulin levels.
In the present study, weight loss in children receiving metformin and vitamin E was insignificant compared to the control group. Bugianesi et al., in a study on patients with nonalcoholic fatty liver showed significant weight loss in the metformin group compared to groups receiving vitamin E or placebo at the end of treatment (21), which is not in line with the present study results.
In our study, the ALT and AST levels in all three groups decreased compared to before the intervention, although not significantly. Also, the metformin and vitamin E prescription had no significant effect on lipid profile in children with fatty liver disease. In Nadeau et al.’s study (5), ALT decreased significantly following treatment with metformin, which is different from the present study results; however, as in our study, their study reported no noticeable change in blood lipid profile. In a similar study by Bugianesi et al. (21), metformin was compared with vitamin E or diet therapy. They reported that aminotransferase levels decreased in all three groups, with the rate of improvement being significantly higher in the metformin group, which is not in line with the present study results. In a similar study, Lavine et al. (7) examined the effect of vitamin E and metformin on treating children and adults with nonalcoholic fatty liver disease (biopsy-proven). They reported a sustained decrease in ALT levels in both groups; thus, the effect of vitamin E and metformin was similar to that of the placebo. Based on these findings, the researchers concluded that neither vitamin E nor metformin had any advantage over placebo in decreasing ALT levels in children with nonalcoholic fatty liver disease, which are consistent with the present study results. In this study, the fatty liver grade in children showed a significant decrease compared to pre-prescribing metformin and vitamin E. However, in the control group, fatty liver grading changes were insignificant compared to before the intervention. Shiasi Arani et al. (12), in a study on obese children with nonalcoholic fatty liver based on ultrasound results, reported that vitamin E and metformin improved the fatty liver status of children for four months. Since studies evaluating fatty liver grade changes are inadequate, more research is needed in this area.
Unfortunately, this study did not examine confounding factors such as family income, number of children at home, parents' level of education, and family nutritional status. In addition, medications used to treat NAFLD may increase the cost of treatment and side effects, which can be avoided by following the guidelines (22).
4.1. Conclusions
The results of new studies suggest that the etiology and pathogenesis of NAFLD are not precisely known. Still, it seems that insulin resistance and impaired lipid metabolism play a key role in increasing the amount of fat in liver cells, and its progression to cirrhosis has been proven. Various drugs are suggested for treating fatty liver. Therefore, the treatment of this disease is more focused on eliminating risk factors such as obesity, diabetes, and insulin resistance, and most researchers have suggested a combination of a balanced diet and physical activity to prevent and treat the disease. Insulin resistance is one of the crucial factors in the incidence of nonalcoholic fatty liver disease. By reducing insulin resistance with pharmaceutical treatment, desirable results can be achieved.

