


1. Background
Celiac disease (CD) is a hereditary digestive disease in children associated with an autoimmune disorder of the small intestine (1). When the small intestine's villi are damaged due to the disease, it will disturb the absorption of substances (2). The prevalence of CD has been reported as 1 - 2% in the European region and 0.6 - 1.0% worldwide, with a peak in Western countries (2). It has been reported as 0.3% in Germany and 2.4% in Finland (3). Sistan & Baluchestan province of Iran showed a high prevalence of 7.35% based on a serologic test (4), 1.5- to 2-fold higher in women (2).
Anti-tTG IgA titers are an initial screening test for CD due to high sensitivity and specificity (5), correlated with intestinal mucosal damage (4), making duodenal mucosal viability the gold standard method, confirmed by laboratory studies (6). Anti-tTG IgA titers are also correlated with histological changes in the duodenum (7) and can be used to monitor response to a gluten-free diet (GFD) (8). The best and most successful treatment for CD is GFD with complete adherence (9). Mucous membrane healing is slow and more incomplete in adults than in children (10) with unclear natural history. A study assessing mucosal recovery found that about 35% improved two years and 66% five years after GFD (11). Furthermore, strong data are supporting the benefits of GFD in patients with CD or symptomatic CD, regardless of symptoms, whereas GFD outcomes in sub-groups of asymptomatic and latent CD are largely unknown.
Response to GFD cannot be measured in terms of symptoms or mucosal relief (11, 12). Aortic elasticity parameters are early indicators of structural and functional changes in the vessel wall and are independent predictors of atherosclerosis and age-related cardiovascular disease (13). Arterial function is critical for CD and untreated patients, can be detrimental, and is predictive of future cardiovascular events (14, 15). The effects of GFD on tTG-IgA and aortic stiffness have been studied in CD patients and shown a significant improvement in aortic elasticity especially in patients who adhered to GFD completely (16). In the recent studies by Noori et al. (17, 18) on chronic diseases such as thalassemia and celiac, they showed that both diseases had a significant effect on heart stiffing. A study of CD observed a decrease in aortic strain (AS) and aortic distensibility (AD) and an increase in pressure strain elastic modulus (PSEM) and AS β index in children with CD compared with controls. The did not assess the effect of GFD on heart stiffing in CD children. In this regard, Bayer et al. (16) attempted to find an answer to this question. They indicated that although CD had a significant effect on elasticity parameters, in patients with CD, adhering to GFD did not show acceptable effects on these parameters.
2. Objectives
To get more knowledge in this regard and because people in the study area consume high wheat products and follow a specific lifestyle that affect the prevalence of non-communicable diseases such as CD, the present study aimed to compare aortic stiffing in children with CD and controls and evaluate the impact of gluten-free diet on aortic stiffing in these patients.
3. Methods
3.1. Study Design
This case-control study was performed on 114 children with CD and 57 healthy children aged between 3.5 and 18 years at the Children's Heart Center in collaboration with the Special Diseases Center at Ali Asghar hospital of Zahedan, Sistan & Baluchestan province in 2020. Children with CD were categorized into three groups: response to GFD whose tTG-IgA improved to the normal range after 18 months of adhering to GFD, no response to GFD who had no improvement in tTG-IgA levels within the diet duration (18 months, possibly due to not proper adherence), and newly diagnosis whose CD was diagnosed in the last six months. The control group was randomly selected from children who had visited the clinic for regular health check-ups. Celiac disease was diagnosed using a combination of clinical findings and a threshold of 20 for tTG-IgA, confirmed by intestinal biopsy (1).
3.1.1. Sampling
The results from the study of Bayar et al. (16) were used to calculate the sample size. The formulae:
3.2. Criteria
The following exclusion criteria were used for children with CD and controls: Age ≥ 18 years on admission, co-morbidities such as diabetes mellitus, obesity, hypertension, dyslipidemia, systemic autoimmune disease, active infection, signs of liver or kidney disease or lung disease, exposure to smoking, antihypertensive drugs, concomitant treatment with lipid-lowering drugs, and a positive family history of dyslipidemia and early coronary artery disease.
3.3. Measurement of tTG IgA
Three milliliters of blood were taken from fasting participants at 8:00 a.m. The samples were centrifuged for serum separation and kept at -70°C until tTG IgA measurement. From the samples, 250 microns were separated for serological tests with an ELISA kit (AESKU, LOT:22100, Made in Germany). The normal limit of tTG IgA was 20 U/mL.
3.4. Blood Pressure Measurement
Blood pressure (BP) was measured with a sphygmomanometer from the brachial artery at the heart level after resting in the supine position for at least five minutes. At least two minutes apart, three measurements were taken, and the average was used for the study.
Using a pressure drop rate of approximately 2 mmHg per second, Korotkoff phases I and V were used to measure systolic and diastolic blood pressure, respectively. A cardiologist performed all blood pressure measurements. Pulse pressure (PP) was calculated as systolic pressure minus diastolic pressure.
3.5. Echocardiographic Measurement
After taking history, physical examination, and chest X-ray, the participants were referred to a cardiologist, and then echocardiography was performed using My lab 60 with transducers 3 and 8 (made in Italy). Measurements were repeated in three cycles to achieve high precision of echocardiographic findings, and the average value was considered for the final value. The M-mode results showed the aortic diastolic diameter (AoD) and the aortic systolic diameter (AoS).
3.6. Evaluation of Aortic Elasticity
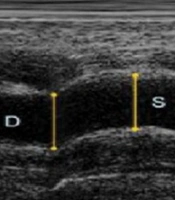
The aortic diastolic and systolic diameters were recorded in M-mode from a parasternal long-axis view approximately 3 cm above the aortic valve. The aortic systolic diameter was measured at the point of maximal aortic advancement, and the diastolic diameter was measured at the onset of the QRS complex on the electrocardiogram (Figure 1).
 and diastolic (AoD) diameters of the ascending aorta are shown on the M-mode tracing obtained at a level 3 cm above the aortic valve (<a href=\"#A131292REF17\">17</a>).")
Measurements of systolic (AoS) and diastolic (AoD) diameters of the ascending aorta are shown on the M-mode tracing obtained at a level 3 cm above the aortic valve (17).
Elasticity parameters of the aorta WERE measured as follows (17).
Aortic strain (%) = (AoS - AoD) × 100/AoD
Aortic stiffness β index = Natural logarithm (systolic blood pressure (SBP)/diastolic blood pressure (DBP))/([AoS - AoD]/AoD)
Aortic distensibility (cm2 × dyne-1.10-6) = 2 × ([AoS - AoD]/AoD)/(SBP - DBP)
Pressure strain elastic modulus (Kpa) = (SBP - DBP)/([AoS - AoD]/AoD)
3.7. Ethical Approval
This study was approved under the ethical approval code of IR.ZAUMS.REC.1400.095.
3.8. Statistical Analysis
SPSS 20.0 (SPSS Inc., Chicago, IL, USA) was used to analyze data. First, the Kolmogorov-Smirnov test was applied to assess the data normality. It revealed that all the variables had free distribution in the present study. Then, the nonparametric tests were used for the analysis. The Mann-Whitney U test was used to analyze the data between the two groups, and the Kruskal-Wallis test by ranks was applied to analyze the data between three or more groups. For all the tests, a P value < 0.05 was considered significant.
4. Results
There were 96 girl children in the sample. Of the girls, 27.1% were healthy, while 21.9%, 33.3%, and 17.7% had no response to GFD, response to GFD, and new diagnosis, respectively. The same trends were observed for boys, and the gender distribution was the same (X2 = 6.767, P = 0.080) (Table 1). The normality test showed that all quantitative variables had free distribution (P < 0.05).
| Gender | Groups of Participants | P Value | ||||
|---|---|---|---|---|---|---|
| Control | No Response to GFD | Response to GFD | Newly Diagnosed | Total | ||
| Girls | 26 (27.1) | 21 (21.9) | 32 (33.3) | 17 (17.7) | 96 (100.0) | 0.08 |
| Boys | 31 (41.3) | 14 (18.7) | 25 (33.3) | 5 (6.7) | 75 (100.0) | |
| Total | 57 (33.3) | 35 (20.5) | 57 (33.3) | 22 (12.9) | 171 (100.0) | |
a Values are expressed as No. (%).
Table 2 shows the mean age of participants as 9.36 ± 3.85 years; it was 9.7 ± 3.66 and 9.19 ± 3.95 years in the healthy and patient groups, respectively (MWU = 2938.500, P = 0.308). The same age trend was observed when the participants were classified into four groups. In children with CD, those with no response to GFD, response to GFD, and new diagnosis were on treatment with GFD for 8.53 ± 3.96, 9.67 ± 3.82, and 8.99 ± 4.28 years, respectively.
a Mann-Whitney test.
b Kruskal-Wallis test.
Table 3 compares the elasticity properties between CD and healthy children groups. A significant decrease was observed in AS (11.15 ± 7.47 vs. 13.78 ± 6.95, P = 0.002) and AD (6.98 ± 5.03 vs. 8.33 ± 5.13, P = 0.012), while a significant increase was observed in PSEM (410.60 ± 247.45 vs. 330.71 ± 216.94, P = 0.012) and AS β index (1.79 ± 0.62 vs. 1.44 ± 0.51, P < 0.001).
| Parameters and Groups | Mean ± SD | P Value |
|---|---|---|
| AoD | 0.468 | |
| Controls | 1.75 ± 0.33 | |
| Celiac | 1.69 ± 0.29 | |
| AoS | 0.052 | |
| Controls | 1.98 ± 0.33 | |
| Celiac | 1.88 ± 0.33 | |
| SBP (mm Hg) | < 0.001 | |
| Controls | 102.84 ± 4.77 | |
| Celiac | 93.3 ± 11.14 | |
| DBP (mm Hg) | < 0.001 | |
| Controls | 68.16 ± 6.31 | |
| Celiac | 59.96 ± 9.02 | |
| AS (%) | 0.002 | |
| Controls | 13.78 ± 6.95 | |
| Celiac | 11.15 ± 7.47 | |
| ASβI | < 0.001 | |
| Controls | 1.44 ± 0.51 | |
| Celiac | 1.79 ± 0.62 | |
| AD (cm2 × dyne-1.10-6) | 0.012 | |
| Controls | 8.33 ± 5.13 | |
| Celiac | 6.98 ± 5.03 | |
| PSEM (kPa) | 0.012 | |
| Controls | 330.71 ± 216.94 | |
| Celiac | 410.6 ± 247.45 |
Abbreviations: AoD, aortic diameter in diastole; AoS, aortic diameter in systole; SBP, systolic blood pressure; DBP, diastolic blood pressure; AS, aortic strain; ASβI, aortic stiffness β index; AD, aortic distensibility; PSEM, pressure strain elastic modulus.
Blood pressure, aortic diameters, and aortic elasticity were compared between healthy and CD children (Table 4). All variables were significantly different among the four groups, except AoD and AoS, with a slight but insignificant difference. In this regard, AoS (X2 = 15.052, P = 0.003), SBP (X2 = 85.554, P < 0.001), DBP (X2 = 77.783, P < 0.001), AS (X2 = 23.927, P = 0.001), ASβ index (X2 = 44.071, P < 0.001), AD (X2 = 13.044, P = 0.004), and PSEM (X2 = 13.66, P = 0.004) differed significantly between the groups.
| Variables and Participants | N | Mean ± SD | P Value |
|---|---|---|---|
| AoD | 0.157 | ||
| Control | 57 | 1.75 ± 0.33 | |
| No response to GFD | 35 | 1.63 ± 0.25 | |
| Response to GFD | 57 | 1.75 ± 0.3 | |
| Newly diagnosed | 22 | 1.64 ± 0.3 | |
| Total | 171 | 1.71 ± 0.3 | |
| AoS | 0.003 | ||
| Control | 57 | 1.98 ± 0.33 | |
| No response to GFD | 35 | 1.8 ± 0.26 | |
| Response to GFD | 57 | 1.97 ± 0.36 | |
| Newly diagnosed | 22 | 1.74 ± 0.29 | |
| Total | 171 | 1.91 ± 0.33 | |
| SBP (mm Hg) | < 0.001 | ||
| Control | 57 | 102.84 ± 4.77 | |
| No response to GFD | 35 | 86.57 ± 10.06 | |
| Response to GFD | 57 | 101.16 ± 5.11 | |
| Newly diagnosed | 22 | 83.64 ± 9.66 | |
| Total | 171 | 96.48 ± 10.5 | |
| DBP (mm Hg) | < 0.001 | ||
| Control | 57 | 68.16 ± 6.31 | |
| No response to GFD | 35 | 54.57 ± 8.43 | |
| Response to GFD | 57 | 65.81 ± 5.16 | |
| Newly diagnosed | 22 | 53.41 ± 8.08 | |
| Total | 171 | 62.7 ± 9.07 | |
| AS (%) | < 0.001 | ||
| Control | 57 | 13.78 ± 6.95 | |
| No response to GFD | 35 | 11.05 ± 6.35 | |
| Response to GFD | 57 | 12.96 ± 8.55 | |
| Newly diagnosed | 22 | 6.65 ± 3.1 | |
| Total | 171 | 12.03 ± 7.38 | |
| ASβI | < 0.001 | ||
| Control | 57 | 1.44 ± 0.51 | |
| No response to GFD | 35 | 1.85 ± 0.51 | |
| Response to GFD | 57 | 1.57 ± 0.64 | |
| Newly diagnosed | 22 | 2.30 ± 0.39 | |
| Total | 171 | 1.68 ± 0.61 | |
| AD (cm2 × dyne-1.10-6) | 0.004 | ||
| Control | 57 | 8.33 ± 5.13 | |
| No response to GFD | 35 | 7.6 ± 5.66 | |
| Response to GFD | 57 | 7.49 ± 5.23 | |
| Newly diagnosed | 22 | 4.66 ± 2.14 | |
| Total | 171 | 7.43 ± 5.09 | |
| PSEM (kpa) | 0.004 | ||
| Control | 57 | 330.71 ± 216.94 | |
| No response to GFD | 35 | 370.87 ± 182.32 | |
| Response to GFD | 57 | 382.2 ± 219.33 | |
| Newly diagnosed | 22 | 547.37 ± 350.68 | |
| Total | 171 | 383.97 ± 240.06 |
Abbreviations: AoD, aortic diameter in diastole; AoS, aortic diameter in systole; SBP, systolic blood pressure; DBP, diastolic blood pressure; AS, aortic strain; ASβI, aortic stiffness β index; AD, aortic distensibility; PSEM, pressure strain elastic modulus.
Table 5 details the analysis regarding four groups in pairwise comparisons. Aortic diameter in systole differed significantly between control and no response to GFD (P = 0.018), control and newly diagnosed (P = 0.003), response to GFD and no response to GFD (P = 0.030), and response to GFD and newly diagnosed (P = 0.006) groups.
| Variables and Groups | P Value |
|---|---|
| AoS | |
| Control | |
| No response to GFD | 0.018 |
| Response to GFD | 0.894 |
| Newly diagnosed | 0.003 |
| No response to GFD | |
| Response to GFD | 0.03 |
| Newly diagnosed | 0.283 |
| Response to GFD | |
| Newly diagnosed | 0.006 |
| SBP (mm Hg) | |
| Control | |
| No response to GFD | < 0.001 |
| Response to GFD | 0.013 |
| Newly diagnosed | < 0.001 |
| No response to GFD | |
| Response to GFD | < 0.001 |
| Newly diagnosed | 0.26 |
| Response to GFD | |
| Newly diagnosed | < 0.001 |
| DBP (mm Hg) | |
| Control | |
| No response to GFD | < 0.001 |
| Response to GFD | 0.035 |
| Newly diagnosed | < 0.001 |
| No response to GFD | |
| Response to GFD | < 0.001 |
| Newly diagnosed | 0.579 |
| Response to GFD | |
| Newly diagnosed | < 0.001 |
| AS (%) | |
| Control | |
| No response to GFD | 0.026 |
| Response to GFD | 0.206 |
| Newly diagnosed | < 0.001 |
| No response to GFD | |
| Response to GFD | 0.401 |
| Newly diagnosed | 0.003 |
| Response to GFD | |
| Newly diagnosed | < 0.001 |
| ASβI | |
| Control | |
| No response to GFD | < 0.001 |
| Response to GFD | 0.053 |
| Newly diagnosed | < 0.001 |
| No response to GFD | |
| Response to GFD | 0.035 |
| Newly diagnosed | 0.02 |
| Response to GFD | |
| Newly diagnosed | < 0.001 |
| AD (cm2 × dyne-1.10-6) | |
| Control | |
| No response to GFD | 0.128 |
| Response to GFD | 0.19 |
| Newly diagnosed | < 0.001 |
| No response to GFD | |
| Response to GFD | 0.936 |
| Newly diagnosed | 0.037 |
| Response to GFD | |
| Newly diagnosed | 0.021 |
| PSEM (kpa) | |
| Control | |
| No response to GFD | 0.128 |
| Response to GFD | 0.19 |
| Newly diagnosed | < 0.001 |
| No response to GFD | |
| Response to GFD | 0.936 |
| Newly diagnosed | 0.037 |
| Response to GFD | |
| Newly diagnosed | 0.021 |
Abbreviations: AoS, aortic diameter in systole; SBP, systolic blood pressure; DBP, diastolic blood pressure; AS, aortic strain; ASβI, aortic stiffness β index; AD, aortic distensibility; PSEM, pressure strain elastic modulus.
Systolic blood pressure differed significantly between control and no response to GFD (P < 0.001), control and response to GFD (P = 0.013), control and newly diagnosed (< 0.001), response to GFD and no response to GFD (P < 0.001), and response to GFD and newly diagnosed (P < 0.001) groups.
Diastolic blood pressure differed significantly between control and response to GFD (P = 0.035), control and no response to GFD (P < 0.001), control and newly diagnosed (P < 0.001), response to GFD and no response to GFD (P < 0.001), and response to GFD and newly diagnosed (P < 0.001) groups.
Aortic strain differed significantly between control and no response to GFD (P = 0.026), control and newly diagnosed (P < 0.001), no response to GFD and newly diagnosed (P = 0.003), and response to GFD and newly diagnosed (P < 0.001) groups.
Aortic strain β index differed significantly between control and no response to GFD (P ≤ 0.001), control and newly diagnosed (P < 0.001), response to GFD and no response to GFD (P = 0.035), no response to GFD and newly diagnosed (P = 0.002), and response to GFD and newly diagnosed (P < 0.001) groups.
Aortic distensibility differed significantly between control and newly diagnosed (P < 0.001), no response to GFD and newly diagnosed (P = 0.037), and response to GFD and newly diagnosed (P = 0.021) groups.
Pressure strain elastic modulus differed significantly between control and newly diagnosed (P < 0.001), no response to GFD and newly diagnosed (P = 0.037), and response to GFD and newly diagnosed (P = 0.021) groups.
5. Discussion
The present study revealed a significant decrease in AS and AD and a significant increase in PSEM and AS β index in children with CD. In pairwise comparisons, AS differed significantly between control and no response to GFD, control and newly diagnosed, no response to GFD and newly diagnosed, and response to GFD and newly diagnosed groups. Aortic stiffness β index (ASβI) differed significantly between control and no response to GFD, control and newly diagnosed, response to GFD and no response to GFD, no response to GFD and newly diagnosed, and response to GFD and newly diagnosed groups. AD differed significantly between control and newly diagnosed, no response to GFD and newly diagnosed, and response to GFD and newly diagnosed groups. Pressure strain elastic modulus differed significantly between control and newly diagnosed, no response to GFD and newly diagnosed, and response to GFD and newly diagnosed groups.
In a similar study, Noori et al. (18) showed that all stiffing parameters, aortic strain, aortic stiffness β index, aortic distensibility, and pressure strain elastic modulus were significantly different between children with CD and controls. In their study, aging was one of the most significant factors in stiffing damage. Sari et al. (19) found that AS and AD decreased and ASβI increased significantly in patients with CD. Bayar et al. (16) found an increase in ASβI and a decrease in PSEM and AD while AS retained similarities to controls. Karpuz et al. (20) concluded that AD did not change in celiac compared with healthy children, whereas AS and ASβI significantly increased in the patients. Our study showed a significant decrease in AS and AD and a significant increase in PSEM and ASβI in children with CD, inconsistent with some of the abovementioned results.
Gluten consumption causes tumult of the intestinal mucosa with hyperplasia of the crypts and atrophy of the small intestine (21). Anti-tTG titer antibodies are the primary tool to identify and rule out CD or susceptibility for further investigation with acceptable sensitivity and specificity (22). As high anti-tTG titers are significantly associated with histology changes in CD, Barker et al. (23) revealed that among symptomatic children with an anti-tTG titer of more than 100, at least one child had Marsh II enteropathies. A systematic review comparing endomysial antibodies with anti-tTG titers found that human recombinant tTG IgA antibodies screen asymptomatic individuals and rule out CD in symptomatic individuals (20). Donaldson et al. (24) revealed that children with anti-tTG titers of more than 100 were shown to have Marsh III histopathology of CD. Demir et al. (25) found many patients with CD in Marsh IIIC. It has been sought to determine the rate of mucosal recovery in CD children with GFD and found that about one-fifth of the children who received GFD did not respond to diet (26, 27). Leonard et al. (26), at the time of biopsy, found that tTG-IgA antibodies elevated in 43% of cases of persistent bowel disease and 32% of cases of mucosal recovery. They concluded that two out of 10 children with CD had persistent bowel disease despite adhering to GFD and that IgA-tTG was not an accurate marker of mucosal recovery.
Gidrewicz et al. (28) sought to determine whether the resolution of symptoms and the normalization of serology determine the response to GFD in CD. They assessed the normalization rate of tTG-IgA antibodies in children with CD who were adhering to GFD. They found that three-quarters of children adhering to GFD had tTG-IgA less than 20, which probably revealed that it would take about one year or more to normalize the celiac serology test. Alarida et al. (29) analyzed some children with CD who had a repeat small intestinal biopsy one year after GFD. They found that children in Marsh II had villous changes at diagnosis that normalized to Marsh 0 within the first year of diet, and about 86 children in Marsh III recovered within one year. In addition, about four-fifths of the CD patients recovered within two to three years, and more than 97% recovered after three years. Catal et al. (30) found that GFD significantly affected final tTG-IgA levels, which were significantly lower in patients who adhered to GFD than in those who did not comply with the diet. The tTG-IgA titers in patients exceeded 100 U/mL and decreased in patients with strict GFD. Bayar et al. (16) found significant differences in aortic elastic properties between those who adhered to GFD and those who did not.
The present study found that the ASβ index and PSEM differed among the three groups. The pairwise comparisons showed that the ASβ index differed significantly between control and response to GFD, control and newly diagnosed, response to GFD and no response to GFD, response to GFD and newly diagnosed, and no response to GFD and newly diagnosed groups. Aortic distensibility differed significantly between control and newly diagnosed, response to GFD and newly diagnosed, and no response to GFD and newly diagnosed groups. Pressure strain elastic modulus differed significantly between control and newly diagnosed, response to GFD and newly diagnosed, and no response to GFD and newly diagnosed groups. The difference between our results and Bayer's may be due to participants' age; as we already said, aging is the main cause of stiffening.
Based on studies, most symptoms and clinical findings improve early, and antibody titers are reduced with GFD adherence, but Bayer et al. (16) analysis showed that the aortic elastic properties were not associated with GFD. Nestel et al. (31) showed that elevated homocysteine caused a sharp increase in aortic stiffness due to increased methionine. To date, data regarding the effect of GFD on homocysteine levels in CD patients are conflicting (32). As Gefel et al. (33) show, GFD decreases homocysteine levels. On the other hand, De Marchi et al. (32) found no significant changes in homocysteine levels in patients with GFD. These results also suggest that chronic systemic inflammation decreases with GFD in CD patients and that persistent inflammation may be an essential factor in increasing CVD risk in patients who do not adhere to GFD. It would be concluded that there is no significant relationship between GFD and the elastic properties of the aorta. Therefore, impaired aortic elasticity in patients with CD is multifactorial and cannot be explained by inflammation alone. The study limitation was the small sample of newly diagnosed children with CD, which probably affected the results.
5.1. Conclusions
The present study concluded that the elasticity parameters changed due to celiac disease such that AD and AS decreased when ASβI and PSEM increased. The study also concluded that a gluten-free diet had no significant effect on all elasticity parameters except ASβI. A slight difference in the results of various studies is probably due to children's age, as it is the most critical factor in stiffing. As a suggestion, assessing aortic elastic properties as a non-traditional cardiovascular risk factor can help identify cardiovascular risk in patients with celiac disease.
