1. Background
Virginia Apgar introduced the Apgar scoring system about 70 years ago, in 1953, to evaluate the condition of a newborn baby at birth (1), and many clinicians have used this method hitherto. In this method, 5 factors are evaluated, including skin color, muscle tone, heart rate, grimace to stimulation, and respiratory effort; each is given a score from zero to two. A maximum of 10 points are given to the baby (2). However, what interventions were done to achieve this score was not considered. Therefore, the American Academy of Pediatrics (AAP) and the American College of Obstetricians and Gynecologists (ACOG) introduced expanded Apgar determination (3).
In this method, 7 interventions are considered for the baby. If it is done, it gets zero points; if no intervention is done, it gets one point. These interventions include the administration of supplemental oxygen, continuous positive airway pressure (CPAP), positive pressure ventilation (PPV), intubation, surfactant administration, chest compression, and epinephrin administration (3-5).
Combined Apgar score (CA), a new scoring system, is the sum of the conventional Apgar score and the Expanded Apgar score, and the baby is awarded a score of 17 in the best condition and with no interventions (6).
Although many studies have shown that gestational age, birth weight, maternal pregnancy complication, maternal hospitalization during pregnancy, etc., are predictors of hospitalization in the neonatal intensive care unit (NICU) (7, 8), there is still a challenge as to what factors can best predict short term outcomes in neonates. In this study, we intended to check whether a combined Apgar score can predict the need for hospitalization, the length, and the age at which full oral feeding can be achieved.
2. Methods
2.1. Study Population and Sampling
This diagnostic test study was conducted on babies born in Ayatollah Rouhani Hospital, affiliated with Babol University of Medical Science, between October 2021 and August 2022.
Inclusion criteria were all live births of any gestational age without major anomalies. Exclusion criteria subsume congenital cyanotic heart disease, a congenital metabolic disorder diagnosed during hospitalization, and babies transferred to another hospital for any reason.
2.2. Data Collection
According to the checklist the researcher previously designed, all live births were given conventional, expanded, and combined Apgar scores at minute 5 of birth. Considering that in all low-risk births, a midwife who is certified in neonatal resuscitation program, and all high-risk births, in addition to the midwife, a pediatric specialist or a trained pediatric specialist assistant who is certified in neonatal resuscitation program, are present in the delivery room or the cesarean section operating room, Apgar scoring is done by these personnel. All interventions performed during resuscitation were completely recorded. The combined Apgar score was reviewed again and corrected by the neonatologist according to the information contained in the medical reports.
Demographic data (such as gender, gestational age, and birth weight) and admission and discharge data were recorded.
The baby's age at the time of starting oral feeding and the age when the baby achieved oral feeding at the rate of 50 cc/kg/day and 100 cc/kg/day were recorded in the medical reports. Breastfed babies were considered fullfed (> 100cc/kg/day).
2.3. Sample Size and Data Analysis
Based on the formula for determining the sample size, this study had to be done on 570 samples.
Sense = 85%
Prev = 35%
d = 5%
After collecting data, all statistical analyses were performed using SPSS version 22 statistical software and analyzed with descriptive indices and chi-square tests, t-test, ANOVA, and calculation of sensitivity, specificity, positive and negative predictive value; receiver operating characteristic (ROC) curve was used to analyze the correlations and relationships between variables. A P value < 0.05 was used to evaluate the statistical significance of the associations and correlations between variables.
This study was approved by the Ethics Committee of the Babol University of Medical Sciences. (Ethics code: IR.MUBABOL.HRI.REC.1400.215).
3. Results
Based on the formula, 615 babies were included in the study. Sixteen were excluded from the study due to the exclusion criteria (including 8 babies with congenital heart disease, 2 with gender disorders, 2 with a diaphragmatic hernia, 1 with hydrops fetalis, 1 with esophageal atresia, 1 with imperforate anus and a baby transferred to another hospital for surgery). This study was conducted on 599 babies (339 boys and 260 girls) with a mean gestational age (GA) of 35.3 ± 3.8 weeks (w) (25 - 42 w).
At minute 5, 0.5% of neonates had an EA score of zero, and 47.7% of themes had a score of 7. The lowest conventional Apgar score of 5 minutes was 2, which included only 0.3% of the babies, but more than half of the babies (58.4%) got a perfect conventional Apgar score of 5 minutes (9). At minute 5, The lowest combined Apgar score was 3, which included 0.3% of the babies, and the highest was 17, which included 42.6%.
Of 599 babies, 280 (46.7%) were admitted to NICU. Among admitted cases, 10.7% (n = 64) were hospitalized for 1 to 7 days, and 36.1% (n = 216) were admitted for more than 7 days. The average duration of hospitalization was 9.5 ± 17.2 days, and the maximum duration was 101 days.
Surfactant therapy was done for 49.6% of admitted babies (n = 139) in the first hour of life.
Babies were divided into three groups based on gestational age: GA < 28 w (A), 28 - 34 w (B), > 34 w (C), and outcomes were analyzed separately in these groups.
3.1. Need to Admission
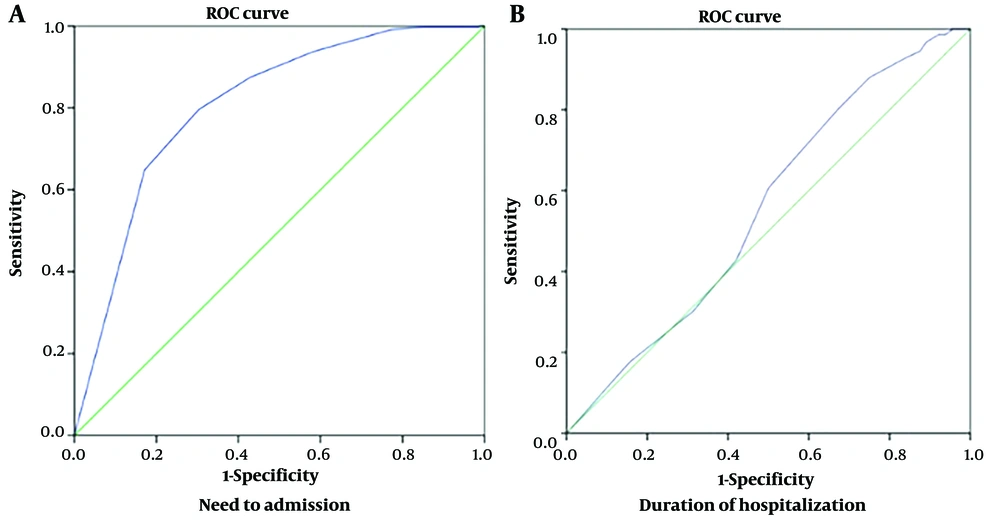
Of 599 babies, 280 (46.7) were admitted to NICU. The mean of 5th-minute combined Apgar in admitted babies was 16.23 ± 1.37; in not-admitted babies, it was 13.81 ± 2.68 (Table 1). Figure 1 illustrates the sensitivity and specificity of the 5th-minute combined Apgar score in predicting the need for admission using an ROC curve. The area under the ROC curve (AUC) for 5th minutes combined Apgar equaled 80% (Table 2). Combined Apgar equal to and less than 15 with 79% sensitivity and 70% specificity can predict the probability of hospitalization in neonates.
| Admission | Mean | Standard Deviation | Mean Difference | P-Value |
|---|---|---|---|---|
| No | 16.23 | 1.37 | 2.415 | <0.001 |
| Yes | 13.81 | 2.68 |
| Test Result Variable(s) | Area | P-Value | Asymptotic 95% Confidence Interval | |
|---|---|---|---|---|
| Lower Bound | Upper Bound | |||
| 5th minute combined Apgar | ||||
| Need to admission | 0.805 | < 0.001 | 0.769 | 0.840 |
| Duration of hospitalization | 0.555 | 0.178 | 0.469 | 0.642 |
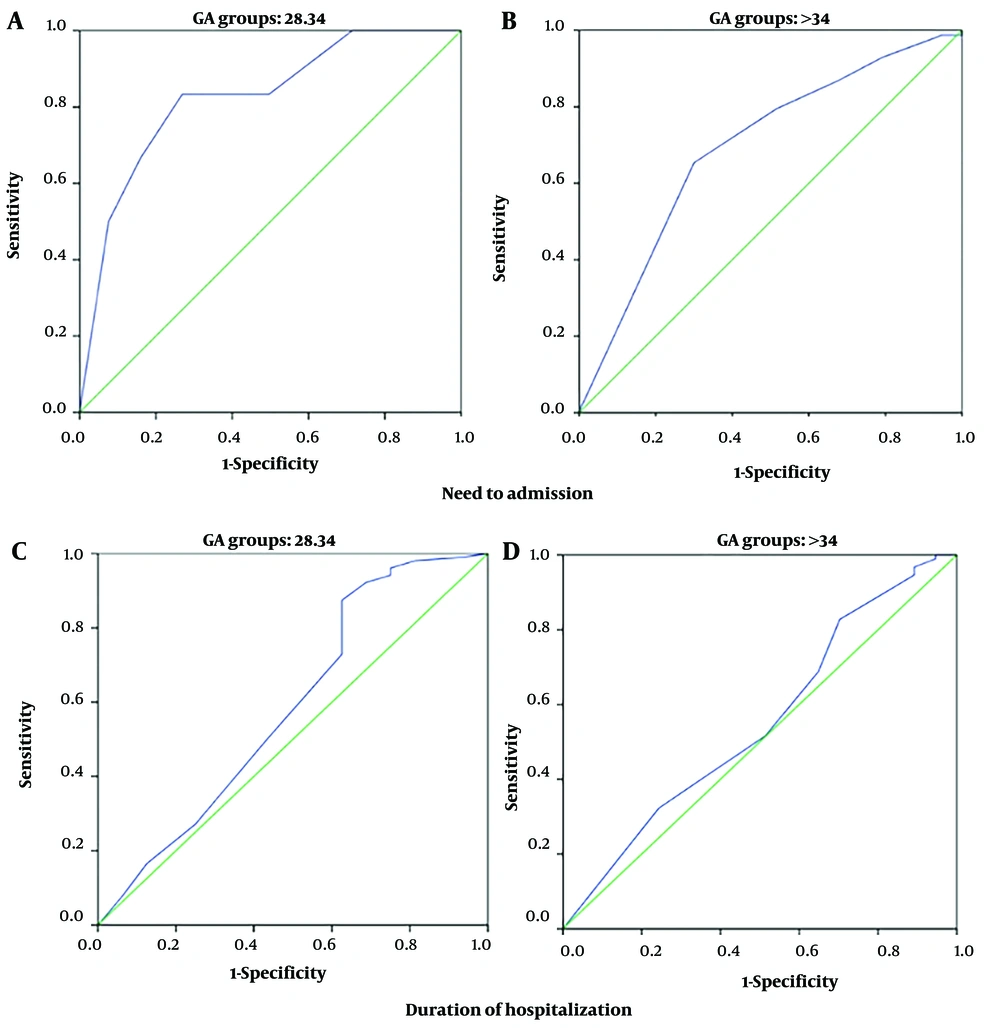
Because all infants with a gestational age of less than 28 weeks were admitted, it was impossible to assess combined Apgar for the need for admission. Still, the other two groups evaluated it separately (Figure 2 and Table 3). Fifth-minute combined Apgar score can predict the need to be admitted in group B better than group C.
| Test Result Variable(s) | GA Groups | Area | P-Value | Asymptotic 95% Confidence Interval | |
|---|---|---|---|---|---|
| Lower Bound | Upper Bound | ||||
| 5th minute combined Apgar | |||||
| Need to admission | B | 0.825 | 0.007 | 0.655 | 0.994 |
| C | 0.693 | < 0.001 | 0.638 | 0.748 | |
| Duration of hospitalization | B | 0.586 | 0.269 | 0.416 | 0.756 |
| C | 0.550 | 0.378 | 0.438 | 0.662 | |
3.2. Duration of Hospitalization
Among 280 admitted babies, 64 were hospitalized for 7 days, and less than 216 were hospitalized for more than 7 days. The mean of the 5th-minute combined Apgar score in the first group was 13.16 ± 3.47, and in the second group was 14 ± 2.37. Figure 1 illustrates the sensitivity and specificity of the 5th-minute combined Apgar score in predicting the duration of hospitalization by using an ROC curve. The area under the ROC curve for 5th minutes combined Apgar equaled 55% (Table 2), which was undesirable.
Since the length of hospitalization was ≤ 7 days in babies with a gestational age of less than 28 weeks, which means their death in the hospital, it was not possible to assess combined Apgar for the duration of hospitalization. However, in two other groups, it was evaluated separately. Based on AUC, 5th minutes combined Apgar was not a good predictor for the duration of hospitalization in these groups, too (Figure 2, Table 3).
3.3. Feeding Tolerance
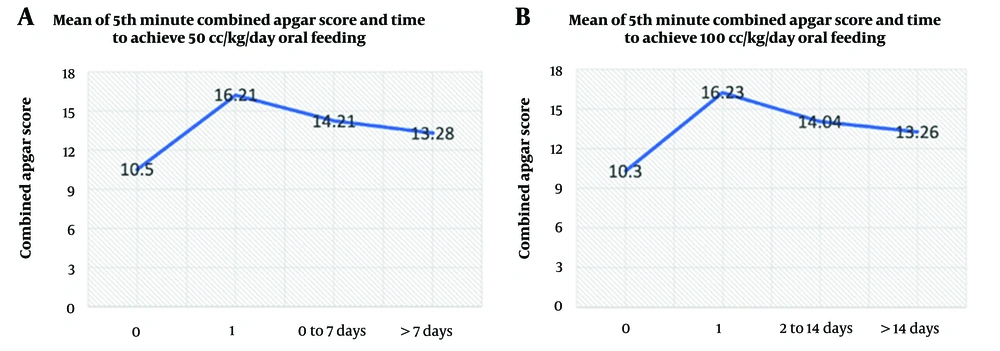
Among 599 babies, 351 were breastfed on the first day of life. Six babies were fed 50 cc/kg on the first day of life, 131 babies (21.9%) on the second to seventh day, and 78 babies (13%) after the seventh day. Among 599 babies, 176 (29.4%) cases on the 2nd to the 14th day and 39 (6.5%) cases after the 14th day were fed 100 cc/kg (Figure 3, Table 4).
As seen in Figure 3 and Table 4, those who never achieved oral feeding (category 0, in fact, the same infants who died before oral feeding) had the lowest mean combined Apgar scores. As the average Apgar score decreases, achieving full oral feeding is associated with a longer delay.
This result was also seen in GA groups B and C, especially in categories 0 and 1 (Tables 4 and 5).
| Time | N | Mean ± Std. Deviation | 95% Confidence Interval for Mean | |
|---|---|---|---|---|
| Lower Bound | Upper Bound | |||
| 50cc/kg Oral Feeding | ||||
| 0 | ||||
| All | 33 | 10.30 ± 3.631 | 8.94 | 11.66 |
| < 28 w | 16 | 10.56 ± 2.190 | 9.40 | 11.73 |
| 28 - 34 w | 11 | 10.09 ± 4.158 | 7.30 | 12.88 |
| > 34 w | 6 | 14.33 ± 5.574 | 8.48 | 20.18 |
| 1 | ||||
| All | 357 | 16.21 ± 1.256 | 16.08 | 16.34 |
| < 28 w | 0 | - | - | - |
| 28 - 34 w | 11 | 15.27 ± 1.421 | 14.32 | 16.23 |
| > 34 w | 346 | 16.17 ± 2.989 | 15.85 | 16.49 |
| 2 - 7 | ||||
| All | 131 | 14.21 ± 2.267 | 13.82 | 14.61 |
| < 28 w | 1 | 13 | - | - |
| 28 - 34 w | 54 | 13.63 ± 2.226 | 13.02 | 14.24 |
| > 34 w | 76 | 14.64 ± 2.225 | 14.14 | 15.15 |
| > 7 | ||||
| All | 78 | 13.28 ± 2.186 | 12.79 | 13.77 |
| < 28 w | 15 | 11.80 ± 2.111 | 10.63 | 12.97 |
| 28 - 34 w | 49 | 13.27 ± 1.998 | 12.69 | 13.84 |
| > 34 w | 14 | 15.14 ± 1.460 | 14.30 | 15.99 |
| Total | 599 | 15.10 ± 2.412 | 14.90 | 15.29 |
| 100 cc/kg Oral Feeding | ||||
| 0 | ||||
| All | 33 | 10.30 ± 3.631 | 8.94 | 11.66 |
| < 28 w | 16 | 10.56 ± 2.190 | 9.40 | 11.73 |
| 28 - 34 w | 11 | 10.09 ± 4.158 | 7.30 | 12.88 |
| > 34 w | 6 | 13.80 ± 6.058 | 6.28 | 21.32 |
| 1 | ||||
| All | 351 | 16.23 ± 1.243 | 16.10 | 16.36 |
| < 28 w | 0 | - | - | - |
| 28 - 34 w | 10 | 15.40 ± 1.430 | 14.38 | 16.42 |
| > 34 w | 341 | 16.19 ± 3.000 | 15.87 | 16.51 |
| - 14 | ||||
| All | 176 | 14.04 ± 2.323 | 13.69 | 14.39 |
| < 28 w | 3 | 11.33 ± 2.887 | 4.16 | 18.50 |
| 28 - 34 w | 80 | 13.36 ± 2.252 | 12.86 | 13.86 |
| > 34 w | 93 | 14.74± 2.121 | 14.31 | 15.18 |
| > 14 | ||||
| All | 39 | 13.26 ± 1.874 | 12.65 | 13.86 |
| < 28 w | 13 | 12.00± 1.958 | 10.82 | 13.18 |
| 28 - 34 w | 24 | 13.79 ± 1.532 | 13.14 | 14.44 |
| > 34 w | 2 | 15.00 ± 0.000 | 15.00 | 15.00 |
| Total | 599 | 15.10 ± 2.412 | 14.90 | 15.29 |
| GA Groups | Sum of Squares | df | Mean Square | F | P-Value |
|---|---|---|---|---|---|
| 50 cc/kg Oral Feeding | |||||
| < 28 | |||||
| Between groups | 15.131 | 2 | 7.566 | 1.633 | 0.213 |
| Within groups | 134.338 | 29 | 4.632 | ||
| Total | 149.469 | 31 | |||
| 28 - 34 | |||||
| Between groups | 161.965 | 3 | 53.988 | 10.093 | < 0.001 |
| Within groups | 647.235 | 121 | 5.349 | ||
| Total | 809.200 | 124 | |||
| > 34 | |||||
| Between groups | 166.750 | 3 | 55.583 | 6.693 | < 0.001 |
| Within groups | 3637.395 | 438 | 8.305 | ||
| Total | 3804.145 | 441 | |||
| 100 cc/kg Oral Feeding | |||||
| < 28 | |||||
| Between groups | 14.865 | 2 | 7.432 | 1.601 | 0.219 |
| Within groups | 134.604 | 29 | 4.642 | ||
| Total | 149.469 | 31 | |||
| 28 - 34 | |||||
| Between groups | 163.445 | 3 | 54.482 | 10.209 | < 0.001 |
| Within groups | 645.755 | 121 | 5.337 | ||
| Total | 809.200 | 124 | |||
| > 34 | |||||
| Between groups | 175.515 | 3 | 58.505 | 7.062 | < 0.001 |
| Within groups | 3628.630 | 438 | 8.285 | ||
| Total | 3804.145 | 441 | |||
aANOVA
4. Discussion
In this study, we concluded that a low combined Apgar score can be associated with delayed completion of oral feeding. A combined Apgar score can be a good predictor of the need for admission but cannot predict the duration of hospitalization.
Although studies such as the one conducted in Amman, Jordan (8) considered lower gestational age and lower birth weight as risk factors for NICU admission, in our study, we showed that combined Apgar can be a good predictor of need for NICU admission. In the study conducted in Amman, Jordan, 2016, the reasons for the hospitalization of 373 babies were retrospectively analyzed by delivery type. Although in babies born by cesarean section, compared to vaginal delivery, low Apgar score was more likely to lead to hospitalization. Still, in general, the Apgar score was not a strong predictor. In our study, we examined the combined Apgar score (as opposed to the conventional) and prospectively examined the need for examination in the studied babies that were not separated from each other based on the type of delivery.
A Retrospective observational study that was conducted in the Medi-Clinic private hospital group in Southern Africa, 2007- 2008, used 2376 infants born between 1 January – 31 December 2008 to build the regression models, and a further 1 578 infants born between 1 January – 31 December 2007 to test the models. Outcome measures were mortality and length of hospital stay for NICU admissions. They concluded that Apgar score at one minute, birth weight, and delivery mode can significantly influence the odds of neonatal death and are associated with significant effects on length of stay for neonatal admissions (10). Increases in Apgar score at one minute are associated with a decrease in the duration of hospitalization. In our study, instead of the conventional Apgar, the fifth-minute combined Apgar score value was evaluated in a smaller statistical population compared to their study, and we observed that the fifth-minute combined Apgar was not a good predictor for the duration of hospitalization.
An exploratory study was conducted by Rosemary White-Traut et al. in two inner city community-based Chicago medical centers (2008 - 2011) on 142 stable premature infants (29 - 34 weeks gestational age) who were fully or partially gavage-fed immediately after birth. This study investigated the factors affecting Oral feeding progression (transition time from the first attempt to complete oral feeding). The authors concluded that the longer transition from first to complete oral feeding was related to the Latina origin of the mothers, lower birthweight, lower gestational age, and higher morbidity scores. No significant associations with feeding progression were noted for infant sex, plurality, and 5-minute Apgar score (9). In our study, we specifically investigated combined Apgar scores in oral feeding progression and showed the relationship between variables. We examined 599 infants of all gestational ages and specifically looked at the combined Apgar scores on oral feeding and its progression. However, their study examined only infants with a gestational age of 29 to 34 weeks and retrospectively investigated the factors influencing the progress of feeding.
Although the Apgar score was recorded by individual experts in neonatal resuscitation programs, human error was the most significant limitation of our study. Future research involving larger neonatal populations across multiple centers can more accurately estimate the predictive value of combined Apgar scores for short-term neonatal outcomes.
4.1. Conclusions
Based on our study, we have found that while the combined Apgar score is a reliable indicator of the need for admission, it is not a reliable predictor of the length of stay in the hospital. Additionally, we observed that a low combined Apgar score can result in delayed completion of oral feeding.


