


1. Background
Diabetes is one of the most prevalent chronic conditions in children, affecting nearly 4.8 out of every 100,000 individuals in Iran. Among the various types of diabetes, diabetes mellitus type I (DMTI) is a common endocrine disorder during childhood and adolescence. It significantly impacts physical development and increasingly poses a global public health challenge (1).
One notable physical complication in children with DMTI is impaired heart function, which arises from premature vascular aging and atherosclerosis during childhood. Children with DMTI exhibit considerable arterial stiffness (AS) even before the onset of cardiovascular disease (CVD), indicating generalized arterial dysfunction (2). Atherosclerosis, characterized by abnormal collagen deposition in arterial walls due to reduced elastin fibers and inflammation, is a natural consequence of aging and contributes to this condition (3).
Factors such as hypertension, dyslipidemia, body weight, and insulin resistance may accelerate this process; however, the literature presents inconsistent reports regarding these correlations (4-7). Early signs of arterial structural and functional impairment are evident in children with DMTI, and these impairments are exacerbated by age and Body Mass Index (BMI) (8). These children are generally shorter in stature and weigh less compared to their non-diabetic peers (9).
The degree of AS in obese children serves as a critical predictor of future cardiovascular morbidity and mortality risks (10). The severity of CVD increases with age and BMI, particularly in children with DMTI (10, 11). Despite the link between childhood obesity and adverse vascular alterations in adulthood, conflicting findings exist in the literature regarding changes in AS among obese children (10).
Central AS is among the earliest detectable signs of vascular damage (10, 11). Therefore, echocardiography, particularly tissue Doppler echocardiography (TDE), plays a pivotal role in the early identification of cardiac dysfunction. The TDE offers high sensitivity and quality in detecting asymptomatic ventricular dysfunction, making it a preferred diagnostic tool (4).
Various non-invasive methods are available for assessing vascular compliance, including the β stiffness index, which evaluates local central AS. This measure is less influenced by blood pressure (BP) and is considered advantageous over systemic AS assessments (4-6). In children with DMTI, vascular stiffness appears to be primarily driven by endothelial dysfunction, exacerbated by poor glycemic control, chronic hyperglycemia, and the formation of advanced glycation end-products (AGEs). These factors impair the elasticity of arterial walls, leading to increased stiffness (12).
A longer duration of DMTI and an earlier age at diagnosis are associated with more significant vascular changes. High BP and obesity further accelerate these changes through mechanisms such as inflammation, endothelial dysfunction, and insulin resistance. Maintaining tight glycemic control, especially by keeping HbA1c levels within target ranges, is critical in preventing vascular damage (4-7).
Regular non-invasive monitoring of vascular health using various techniques is essential for the early detection of vascular stiffness in children, particularly those with poor glycemic control or additional risk factors, such as a family history of CVD (5). Vascular stiffness in children with DMTI is considered an early marker for the development of CVDs, including hypertension, coronary artery disease, and heart failure later in life. It also contributes to complications such as diabetic nephropathy and retinopathy (6).
Effective glycemic and BP management is crucial in preventing long-term cardiovascular complications. Optimal care requires a multidisciplinary approach involving pediatric endocrinologists, cardiologists, nephrologists, and dietitians. Ongoing research into the long-term effects of vascular changes in these children is essential (13).
2. Objectives
In light of these insights, this study aimed to evaluate changes in AS among children with DMTI compared to healthy counterparts, while exploring the roles of age and BMI in this context.
3. Methods
This case-control study was conducted on 186 children aged 4 to 18 years, equally divided into healthy and DMTI groups, at the pediatric cardiac center in collaboration with the Center for Specific Diseases at Ali Asghar Hospital, Zahedan, Sistan and Baluchestan province, Iran, from April 2020 for one year.
Consent forms were obtained from participants or their guardians after the study was approved as a project (IR.ZAUMS.REC.1400.095). Symptomatic and asymptomatic children with DMTI were included in the study based on fasting blood sugar levels above 125 mg/dL or random blood sugar levels higher than 200 mg/dL to confirm their diabetes diagnosis. Healthy children were selected from those visiting the pediatric clinic for heart examinations and were confirmed to be disease-free, particularly free from heart diseases, through echocardiography. The sampling method for data collection was straightforward and accessible for both groups.
The sample size was determined using the formula:
N = σ2 (Zα - Zβ)2/DIFF2
Where, Zβ = 0.84, Zα = 1.96, r = 1, and σ = 0.07, and the Multidimensional Pain Inventory (MPI) means for patients and controls were 0.29 and 0.27, respectively (14). Using these parameters, the calculated sample size was approximately 93 subjects per group.
Participants were matched for age, gender, and BMI. A comprehensive physical examination, including cardiac evaluation and BP measurement, along with echocardiography, was performed before recruitment to ensure the absence of underlying cardiac issues.
3.1. Criteria
Diabetes was confirmed by fasting blood glucose > 125 mg/dL or random blood glucose > 200 mg/dL. The exclusion criteria included participants with cardiac diseases such as ischemic or hypertensive heart disease, cardiomyopathy, valvular heart disease, congenital heart disease, or myocarditis.
3.2. Echocardiography Measures
All the children underwent medical history review, physical examination, chest X-ray, and echocardiography, which was performed using a MyLab 60 device with a 3.8 MHz transducer (manufactured in Italy). Echocardiograms were performed over three cardiac cycles, and the average values were recorded.
Left ventricular mass (LVM) was measured using conventional echocardiography of the left side and estimated from three cardiac cycles. LVM was calculated using the following formula:
LVM (g) = 0.8 [1.04 (LVDD + PWD + IVSD)3 - LVDD3] + 0.6 (4 - 6)
3.3. Doppler and Tissue Doppler Imaging Measurements
Tissue Doppler imaging (TDI) was conducted from the apical four-chamber view, using a 3 mm pulsed Doppler sample volume positioned at the mitral annulus. Myocardial velocity profiles were obtained by placing the sample volume at the junction of the tricuspid annulus and the right ventricular (RV) free wall, as well as at the junction of the mitral annulus and the left ventricular (LV) posterior wall. The recorded parameters included early (E) and late (A) diastolic velocities of the mitral and tricuspid annuli, along with the E/A ratio (4). The Myocardial Performance Index (MPI) for the right and left ventricles was calculated by dividing the sum of isovolumetric relaxation time (IRT) and isovolumetric contraction time (ICT) by ejection time (ET) (4-6):
3.4. Aortic Parameters
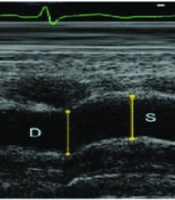
After echocardiography, the aortic diameter was measured 3 cm above the aortic valve using the M-mode. Aortic diameters were determined as the distance between the inner edges of the anterior and posterior walls of the aorta during systole and diastole. The systolic aortic diameter (AoS) was recorded when the aortic wall was fully opened, while the diastolic aortic diameter (AoD) was documented at the QRS peak on electrocardiographic (ECG) recordings (Figure 1).
 and diastolic (D) diameters of the ascending aorta are shown on the M-mode tracing.")
Measurements of systolic (S) and diastolic (D) diameters of the ascending aorta are shown on the M-mode tracing.
3.5. Aortic Elasticity Parameters
Aortic elasticity parameters were calculated as follows:
Aortic strain (%) = (aortic SD - aortic DD) × 100/aortic DD Aortic Stiffness Beta Index = natural logarithm (systolic BP/diastolic BP)/([aortic SD - aortic DD]/aortic DD) Aortic distensability (cm2. dyne-1.10 - 6) = 2 × ([aortic SD - aortic DD]/aortic DD)/(SBP - DBP) Pressure strain elastic modulus = (SBP – DBP)/([aortic SD – aortic DD]/aortic DD) (4-6).
3.6. Blood Pressure
Blood pressure was measured from the brachial artery using a sphygmomanometer after the participants had rested in a supine position for at least 5 minutes. Three measurements were taken, each separated by at least 2 minutes, and the average of the two closest readings was recorded. The pressure drop rate was set to approximately 2 mmHg/s, with Korotkoff phases I and V used to determine systolic and diastolic BP, respectively. All continuous variables were measured three times, and their averages were recorded for analysis to ensure greater accuracy.
3.7. Anthropomorphic Measures
Height was measured in the standing position using a balance and a scaled ruler, while weight was recorded with a RASA scale factor with a precision of 100 g (manufactured in Iran). Body Mass Index (kg/m2) was calculated using the formula [weight/height2].
Body Mass Index percentiles for children aged 4 to 18 years were calculated using CDC growth charts, which take age and sex into account. Each child’s BMI percentile was determined by comparing their BMI to the reference population for their age and sex. According to CDC guidelines:
- Below the 5th percentile is classified as underweight.
- Between the 5th and 85th percentiles is considered normal weight.
- Above the 85th percentile is categorized as overweight or obese.
3.8. Statistical Analysis
Data were analyzed using SPSS for Windows version 20.0 (SPSS Inc., Chicago, IL, USA). The Kolmogorov-Smirnov test was applied to assess the distribution of continuous variables, while homogeneity was also tested. Student’s t-test was used to compare the mean values of normally distributed quantitative variables, whereas the Mann-Whitney U test was applied for variables with skewed distributions. For correlation analyses, the Pearson chi-square test was used for parametric variables. A P-value ≤ 0.05 was considered statistically significant.
4. Results
The gender distribution was similar between the participant groups. Among children with DMTI, boys accounted for 47.9%, compared to 57.3% in the control group. A normality test was performed to evaluate the data distribution for all study variables, revealing that most variables exhibited non-normal distribution across all participants (P < 0.05), except for right MPI and AOD, which displayed normal distribution (P = 0.200). In the DMTI subgroup, variables such as age, height, left MPI, right A/A’, AOS, AOD, and left E/A followed a normal distribution, while the rest were non-normally distributed.
Table 1 presents the demographic factors of patients and healthy children, along with a comparison of the diabetes group based on HbA1c levels. According to Table 1, there was no significant difference in age between children with type 1 diabetes and the control group (P = 0.579). However, height (P < 0.001), weight (P < 0.001), and BMI (P < 0.001) were significantly lower in children with type 1 diabetes compared to controls. These demographic factors were consistent among patient subgroups classified by HbA1c levels.
| Variables and Groups | Mean ± SD | t-Value | P-Value |
|---|---|---|---|
| Groups of Participants | |||
| Age | 4395 a | 0.579 | |
| Case | 10.87 ± 3.46 | ||
| Control | 10.77 ± 2.82 | ||
| Height | 2408.5 a | < 0.001 | |
| Case | 137.39 ± 19.01 | ||
| Control | 153.23 ± 12.76 | ||
| Weight | 2413 a | < 0.001 | |
| Case | 33.14 ± 11.68 | ||
| Control | 43.96 ± 11.97 | ||
| BMI | 150.5 a | 0.095 | |
| Case | 17.89 ± 2.68 | ||
| Control | 18.01 ± 2.11 | ||
| HbA1c Levels | |||
| Age | 588.5 a | 0.847 | |
| < 7 | 11 ± 3.55 | ||
| ≥ 7 | 10.84 ± 3.47 | ||
| Height | 0.30 b | 0.767 | |
| < 7 | 138.73 ± 19.27 | ||
| ≥ 7 | 137.14 ± 19.07 | ||
| Weight | 0.62 b | 0.535 | |
| < 7 | 34.87 ± 11.76 | ||
| ≥ 7 | 32.81 ± 11.7 | ||
| BMI | 503.5 a | 0.294 | |
| < 7 | 17.65 ± 3.09 | ||
| ≥ 7 | 16.88 ± 2.6 |
Abbreviation: BMI, Body Mass Index.
a Mann-Whitney U test.
b Independent samples t-test.
Table 2 highlights the findings related to LVM and tissue Doppler measurements. Left ventricular mass did not differ significantly between children with diabetes and controls (P = 0.866). However, tissue Doppler measurements such as left MPI (P < 0.001), right MPI (P < 0.001), and left E/E’ (P = 0.039) showed significant differences. In contrast, parameters such as right E/E’ (P = 0.105), left A/A’ (P = 0.783), right A/A’ (P = 0.194), left E/A (P = 0.009), right E/A (P = 0.590), left E’/A’ (P = 0.578), and right E’/A’ (P = 0.175) did not show significant differences between the groups.
| Variables and Groups | Mean ± SD | t-Value | P-Value |
|---|---|---|---|
| LVM | 4543 | 0.866 | |
| Case | 48.1 ± 21.07 | ||
| Control | 47.8 ± 20.58 | ||
| Left MPI’ | 552 | < 0.001 | |
| Case | 0.78 ± 0.1 | ||
| Control | 0.51 ± 0.13 | ||
| Right MPI’ | 7.54 | < 0.001 | |
| Case | 0.76 ± 0.12 | ||
| Control | 0.63 ± 0.11 | ||
| Right E/E’ | 3983 | 0.105 | |
| Case | 5.01 ± 1.49 | ||
| Control | 4.7 ± 1.41 | ||
| Left E/E’ | 2890 | < 0.001 | |
| Case | 5.84 ± 1.54 | ||
| Control | 6.94 ± 2.32 | ||
| Left A/A’ | 4502 | 0.783 | |
| Case | 7.92 ± 2.11 | ||
| Control | 8.62 ± 4.99 | ||
| Right A/A’ | 4108.5 | 0.194 | |
| Case | 7.4 ± 2.18 | ||
| Control | 7.61 ± 5.67 | ||
| SBP | 3456 | 0.002 | |
| Case | 101.71 ± 8.57 | ||
| Control | 98.4 ± 10.17 | ||
| DBP | 3100 | < 0.001 | |
| Case | 66.6 ± 7.26 | ||
| Control | 61.84 ± 9.28 | ||
| AOS | 2821 | < 0.001 | |
| Case | 21.89 ± 2.94 | ||
| Control | 19.9 ± 2.97 | ||
| AOD | 2.53 | 0.012 | |
| Case | 19.65 ± 2.93 | ||
| Control | 18.55 ± 3.11 | ||
| ASBI | 2915.5 | < 0.001 | |
| Case | 12.71 ± 15.15 | ||
| Control | 8.77 ± 17.46 | ||
| AS | 3149 | < 0.001 | |
| Case | 7.78 ± 6.32 | ||
| Control | 11.98 ± 9.1 | ||
| AD | 2792.5 | < 0.001 | |
| Case | 0.08 ± 0.06 | ||
| Control | 0.13 ± 0.09 | ||
| PSEM | 3774.5 | 0.03 | |
| Case | 8.92 ± 12.03 | ||
| Control | 7.24 ± 14.34 | ||
| Left E/A | 3608.5 | 0.009 | |
| Case | 1.77 ± 0.4 | ||
| Control | 1.96 ± 0.49 | ||
| Right E/A | 4400.5 | 0.59 | |
| Case | 1.42 ± 0.32 | ||
| Control | 1.47 ± 0.37 | ||
| Left E’/A’ | 4394 | 0.578 | |
| Case | 2.66 ± 2.61 | ||
| Control | 2.39 ± 0.74 | ||
| Right E’/A’ | 4085.5 | 0.175 | |
| Case | 2.13 ± 0.66 | ||
| Control | 2.26 ± 0.74 |
Abbreviations: LVM, left ventricular mass; MPI, multidimensional pain inventory; AoS, aortic diameter; AoD, aortic diameter; AS, arterial stiffness; AD, aortic distensibility.
Blood pressure measurements indicated that systolic BP (P = 0.002) and diastolic BP (P < 0.001) were significantly higher in children with type 1 diabetes compared to controls. Additionally, aortic parameters such as AOS (P < 0.001) and AOD (P = 0.012) were elevated in the diabetic group. Elasticity parameters, including ASβI (P < 0.001) and PSEM (P = 0.039), were higher in children with DMTI, whereas AS (P < 0.001) and AD (P < 0.001) were lower when compared to controls.
Table 3 presented changes in elasticity parameters across age groups in both DMTI children and controls. Significant differences were observed in the 4 - 6 years age group for ASβI (P = 0.002), AS (P = 0.003), and AD (P = 0.003). Similar differences were noted in the 7 - 9 years age group for ASβI (P = 0.007), AS (P = 0.011), and AD (P = 0.005). In the 10 - 12 years age group, differences were less pronounced for ASβI (P = 0.255), AS (P = 0.318), and AD (P = 0.127), as well as in the 13 - 15 years age group for ASβI (P = 0.172), AS (P = 0.261), and AD (P = 0.120). In the 16 - 18 years age group, significant differences were observed only for ASβI (P = 0.043), while AS (P = 0.228) and AD (P = 0.108) showed no significant differences.
| Variables | Age Groups (y) and Elasticity Parameters | |||||||||
|---|---|---|---|---|---|---|---|---|---|---|
| 4 - 6 | 7 - 9 | 10 - 12 | 13 - 15 | 16 - 18 | ||||||
| Mean ± SD | P-Value | Mean ± SD | P-Value | Mean ± SD | P-Value | Mean ± SD | P-Value | Mean ± SD | P-Value | |
| ASBI | 0.002 | 0.007 | 0.255 | 0.172 | 0.043 | |||||
| Case | 14.15 ± 15.76 | 16.08 ± 18.23 | 13.26 ± 19.61 | 9.01 ± 7.00 | 12.78 ± 6.83 | |||||
| Control | 3.52 ± 1.46 | 9.68 ± 20.52 | 7.86 ± 12.81 | 11.78 ± 25.18 | 5.82 ± 5.51 | |||||
| AS | 0.003 | 0.011 | 0.318 | 0.261 | 0.228 | |||||
| Case | 5.61 ± 3.43 | 6.99 ± 7.34 | 8.93 ± 6.91 | 8.46 ± 5.87 | 7.18 ± 7.08 | |||||
| Control | 14.62 ± 7.82 | 12.49 ± 8.61 | 12.09 ± 10.23 | 10.44 ± 8.40 | 11.21 ± 8.37 | |||||
| AD | 0.003 | 0.005 | 0.127 | 0.120 | 0.108 | |||||
| Case | 0.06 ± 0.04 | 0.06 ± 0.06 | 0.09 ± 0.06 | 0.08 ± 0.06 | 0.07 ± 0.06 | |||||
| Control | 0.16 ± 0.11 | 0.12 ± 0.07 | 0.13 ± 0.10 | 0.12 ± 0.09 | 0.15 ± 0.12 | |||||
| PSEM | 0.964 | 0.019 | 0.442 | 0.308 | 0.142 | |||||
| Case | 5.33 ± 8.84 | 11.66 ± 13.64 | 10.77 ± 16.94 | 6.93 ± 5.62 | 8.96 ± 6.50 | |||||
| Control | 2.71 ± 1.06 | 7.72 ± 16.02 | 6.90 ± 12.65 | 9.26 ± 19.09 | 4.87 ± 4.63 | |||||
Abbreviation: AS, arterial stiffness; AD, aortic distensibility; PSEM, pulse wave velocity.
a P < 0.05 was considered statistically significant.
Table 4 demonstrated changes in elasticity parameters across different BMI levels in children with DMTI and controls. Among the underweight group, no significant differences were found in BMI values between cases and controls for any parameter (ASβI, AS, AD, PSEM). In the normal-weight group, a significant difference was observed in AD, where cases had lower BMI values compared to controls (P = 0.009). In the overweight/obese group, significant differences were observed across all parameters (ASβI, AS, AD, PSEM), with varying trends. Specifically, ASβI and PSEM values were significantly higher in cases compared to controls, whereas AS and AD values were significantly higher in controls compared to cases. These results suggest notable differences in BMI distributions between cases and controls, particularly in the overweight/obese category.
| BMI Percentiles | Parameters | Groups | N | Mean ± SD | t | P-Value |
|---|---|---|---|---|---|---|
| Underweight (< 5th) | ASBI | Case | 14 | 10.66 ± 5.25 | 0.93 | 0.369 |
| Control | 4 | 7.85 ± 5.83 | ||||
| AS | Case | 14 | 6.95 ± 5.11 | 0.03 | 0.976 | |
| Control | 4 | 6.87 ± 3.21 | ||||
| AD | Case | 14 | 0.06 ± 0.03 | -0.96 | 0.351 | |
| Control | 4 | 0.08 ± 0.03 | ||||
| PSEM | Case | 14 | 8.1 ± 4.68 | 0.580 | 0.57 | |
| Control | 4 | 6.54 ± 4.94 | ||||
| Normal (5th - 85th) | ASBI | Case | 72 | 12.48 ± 15.75 | 0.54 | 0.591 |
| Control | 64 | 10.78 ± 20.88 | ||||
| AS | Case | 72 | 8.1 ± 6.71 | -1.58 | 0.116 | |
| Control | 64 | 9.99 ± 7.2 | ||||
| AD | Case | 72 | 0.08 ± 0.06 | -2.67 | 0.009 | |
| Control | 64 | 0.11 ± 0.08 | ||||
| PSEM | Case | 72 | 8.6 ± 12.4 | -0.13 | 0.899 | |
| Control | 64 | 8.93 ± 17.16 | ||||
| Overweight or obese (> 85th) | ASBI | Case | 10 | 17.27 ± 19.91 | 3.28 | 0.002 |
| Control | 28 | 4.31 ± 4.56 | ||||
| AS | Case | 10 | 6.68 ± 5.03 | -2.85 | 0.007 | |
| Control | 28 | 17.25 ± 11.27 | ||||
| AD | Case | 10 | 0.07 ± 0.05 | -3.05 | 0.004 | |
| Control | 28 | 0.17 ± 0.11 | ||||
| PSEM | Case | 10 | 12.38 ± 16.38 | 2.77 | 0.009 | |
| Control | 28 | 3.47 ± 3.48 |
Abbreviations: AS, arterial stiffness; AD, aortic distensibility; BMI, Body Mass Index.
Table 5 indicated that none of the cardiac findings differed significantly between DMTI children with HbA1c levels < 7 and those with HbA1c levels ≥ 7.
| Variables | The Status of HbA1c | Mean ± SD | Test | P-Value | Variables | Mean ± SD | Test | P-Value |
|---|---|---|---|---|---|---|---|---|
| Duration of the diabetes (mon) | HbA1c < 7 | 44.07 ± 25.43 | 401.5 | 0.037 | AOS | 22.83 ± 2.87 | 1.35 | 0.181 |
| HbA1c ≥ 7 | 29.43 ± 22.53 | 21.72 ± 2.94 | ||||||
| LVM | HbA1c < 7 | 46.8 ± 19.41 | 596.5 | 0.912 | AOD | 20.3 ± 2.55 | 0.93 | 0.354 |
| HbA1c ≥ 7 | 48.35 ± 21.47 | 19.53 ± 3 | ||||||
| Left MPI’ | HbA1c < 7 | 0.74 ± 0.13 | -1.69 | 0.094 | ASBI | 15.21 ± 19.02 | 581 | 0.789 |
| HbA1c ≥ 7 | 0.79 ± 0.09 | 12.25 ± 14.42 | ||||||
| Right MPI’ | HbA1c < 7 | 0.73 ± 0.16 | 542 | 0.509 | AS | 8.57 ± 8.23 | 604 | 0.972 |
| HbA1c ≥ 7 | 0.76 ± 0.11 | 7.64 ± 5.95 | ||||||
| Right E/E’ | HbA1c < 7 | 5.07 ± 1.53 | 595 | 0.9 | AD | 0.08 ± 0.07 | 590.5 | 0.864 |
| HbA1c ≥ 7 | 5 ± 1.49 | 0.08 ± 0.06 | ||||||
| Left | HbA1c < 7 | 5.46 ± 1.57 | 579 | 0.774 | PSEM | 10.45 ± 14.71 | 579 | 0.774 |
| E/E’ | HbA1c ≥ 7 | 5.91 ± 1.53 | 8.64 ± 11.56 | |||||
| Left A/A’ | HbA1c < 7 | 7.38 ± 0.98 | 530 | 0.434 | Left | 1.74 ± 0.54 | -0.34 | 0.733 |
| HbA1c ≥ 7 | 8.02 ± 2.25 | E /A | 1.78 ± 0.38 | |||||
| Right A/A’ | HbA1c < 7 | 7.13 ± 2.21 | -0.52 | 0.608 | Right | 1.4 ± 0.31 | 589.5 | 0.856 |
| HbA1c ≥ 7 | 7.45 ± 2.19 | E /A | 1.43 ± 0.33 | |||||
| SBP | HbA1c < 7 | 98.73 ± 5.6 | 460.5 | 0.127 | Left | 2.37 ± 0.54 | 595.5 | 0.904 |
| HbA1c ≥ 7 | 102.26 ± 8.93 | E’/A’ | 2.71 ± 2.83 | |||||
| DBP | HbA1c < 7 | 65 ± 5 | 526.5 | 0.394 | Right | 1.99 ± 0.51 | 563.5 | 0.657 |
| HbA1c ≥ 7 | 66.9 ± 7.59 | E’/A’ | 2.16 ± 0.68 |
Abbreviations: LVM, left ventricular mass.
Table 6 outlined multiple regression models used to adjust for the effects of age and BMI on aortic elasticity parameters in children with diabetes. The predicted variables were AS, AD, ASβI, and PSEM, and the analysis aimed to predict these based on age and BMI. According to the table, the results were as follows:
- For AS, R = 0.099, R² = 0.01, and Adjusted R² = -0.01.
- For AD, R = 0.127, R² = 0.02, and Adjusted R² = -0.01.
- For ASβI, R = 0.126, R² = 0.02, and Adjusted R² = -0.01.
- For PSEM, R = 0.043, R² = 0.00, and Adjusted R² = -0.02.
| Predicted Variable and Predictor Factors | Unstandardized Coefficients | Standardized Coefficients | t-Value | P-Value | R | R2 | Adjusted R2 |
|---|---|---|---|---|---|---|---|
| B | Beta | ||||||
| AS | 0.099 | 0.01 | -0.01 | ||||
| Age | 0.190 | 0.104 | 0.948 | 0.346 | |||
| BMI | -0.044 | -0.019 | -0.170 | 0.865 | |||
| AD | 0.127 | 0.02 | -0.01 | ||||
| Age | 0.002 | 0.114 | 1.045 | 0.299 | |||
| BMI | 0.001 | 0.029 | 0.264 | 0.793 | |||
| ASI | 0.126 | 0.02 | -0.01 | ||||
| Age | -0.585 | -0.134 | -1.222 | 0.225 | |||
| BMI | 0.211 | 0.037 | 0.341 | 0.734 | |||
| PSEM | 0.043 | 0.00 | -0.02 | ||||
| Age | -0.112 | -0.032 | -0.293 | 0.770 | |||
| BMI | 0.183 | 0.041 | 0.370 | 0.712 |
Abbreviations: AS, arterial stiffness; AD, aortic distensibility; PSEM, pulse wave velocity; BMI, Body Mass Index.
5. Discussion
Our study revealed that height, weight, and BMI were lower in children with DMTI compared to the controls. Among the TDI parameters, left and right MPI were higher, while left E/E’ and left E/A were lower in children with DMTI compared to the controls.
Previous studies have consistently demonstrated significant differences in cardiac parameters between children with DMTI and healthy controls. Ozdemir et al. (15) reported higher values for left E’, left E/E’, and left MPI in DMTI patients. They also found that right E’ and right MPI were elevated, whereas right E/E’ was lower in DMTI patients compared to healthy children. Bradley et al. (16) corroborated these findings, showing that children with DMTI exhibited significantly lower E’ and A’, along with higher E/E’ ratios.
Moreover, TDE has been recognized as a more sensitive and accurate method for detecting LV diastolic dysfunction compared to conventional Doppler techniques (15, 17). Adel et al. (17) specifically noted that tissue Doppler detected significant differences in LV diastolic filling patterns in 52.5% of patients, whereas conventional Doppler identified dysfunction in only 7.5% of cases.
Regarding AS evaluation, traditional studies often employed parameters such as pulse wave velocity (PWV) and Augmentation Index (Aix). However, recent research has shifted focus toward aortic strain, ASβI, aortic distensibility (AD), and pulse wave velocity (PSEM) (4-6). Li et al. (18), Obermannova et al. (19), and McCulloch et al. (20) observed a significant increase in ASβI and reductions in aortic strain and AD among children with diabetes compared to controls, underscoring the vascular changes associated with diabetes.
Çiftel et al. (8) conducted a study examining AS in children with DMTI versus controls, affirming similar findings of decreased aortic strain and AD in the diabetic group. Collectively, these studies highlight the adverse effects of DMTI on both cardiac function and AS, emphasizing the importance of advanced echocardiographic techniques in assessing cardiovascular health in diabetic children.
Age plays a crucial role in the dynamics of AS from childhood onward. Participants were divided into age groups: 4 - 6, 7 - 9, 10 - 12, 13 - 15, and 16 - 18 years, and elasticity parameters were compared between children with diabetes and healthy controls within each group. The findings revealed significant differences in the 4 - 6 years age group for all parameters, except PSEM. In the 7 - 9 years age group, all parameters showed significant differences, whereas in the 10 - 12 and 13 - 15 years age groups, none of the parameters were significant. In the 16 - 18 years age group, only ASβI showed a significant difference.
Research on AS in children has yielded conflicting results, largely due to variations in measurement methodologies, including differences in devices and the arterial segments assessed. The distribution of blood components also varies by vessel location, influencing elasticity. Central arteries typically exhibit higher elasticity due to a higher elastin/collagen ratio and minimal smooth muscle tone, whereas peripheral vessels are less elastic with a lower elastin/collagen ratio. Therefore, the method of measurement and the arterial segment evaluated are critical considerations.
Noori et al. (21) observed a significant increase in arterial stiffening with age in healthy children, whereas children with diabetes showed no significant age-related changes, except for AD. Batista et al. (22) further emphasized the association between AS and early age, supporting these findings. Additionally, Dangardt et al. (23) and Zhong et al. (24) found a positive correlation between age and PWV, further reinforcing age as a determinant of AS.
Based on the findings of this study, it was evident that underweight children exhibited significant differences in all elasticity parameters between those with diabetes and healthy controls, except for PSEM. This trend varied across different BMI categories: In children with a normal BMI, all elasticity parameters differed significantly, while in overweight children, no significant differences were observed in any of the parameters. Noori et al. (21) reported that ASβI and AD showed no significant associations with BMI in either children with DMTI or control subjects. Sulakova et al. (25) found that the mean difference between vascular age and chronological age was greater in children with DMTI compared to controls.
Contrary to these findings, studies by Batista et al. (22), Heier et al. (26), Stabouli et al. (27), and Noori et al. (6) indicated that BMI was associated with aortic stiffening, particularly in children aged 9 - 10 years. Stabouli et al. (27) observed higher PWV in obese children compared to those with normal weight, a trend also noted by Heier et al. (26), where BMI and body fat percentage correlated with elevated carotid-femoral PWV levels in children and adolescents. The pathophysiological mechanisms linking obesity to AS remain incompletely understood, especially within the age group studied here, highlighting the need for lifecycle-focused risk factor assessments.
Regarding glycemic control, this study found no changes in cardiac findings among children with DMTI whose HbA1c was < 7 compared to those with HbA1c ≥ 7. This aligns with findings by Adel et al. (17) but contrasts with studies by Ritchie and Abel (28).
Noori et al. (21) similarly found that ASβI and AD were not significantly associated with arterial compliance or HbA1c levels. Given that adolescence is a critical period for the onset and progression of vascular complications associated with diabetes mellitus, evaluating both central cardiac and peripheral vascular changes remains crucial. This study underscores that while diabetes mellitus itself contributes to AS in children, poor glycemic control did not lead to changes in AS among patients.
In the present study, the multiple regression models indicated that neither age nor BMI were significant predictors of aortic elasticity parameters, as all significance values were above the common threshold of 0.05. Additionally, the R² values were very low, suggesting that the models explained very little of the variance in the aortic elasticity parameters.
It has been reported that, in the case of age, recent studies typically find that aortic stiffness increases with age. This is often a significant predictor in regression models for aortic elasticity parameters, with higher standardized coefficients (29). Regarding BMI, the relationship between BMI and aortic elasticity is less consistent (30).
Some studies find a significant association, whereas others do not, possibly due to confounding factors like physical activity and metabolic health. In total, the studies discussed in this survey indicate a strong positive correlation between age and aortic stiffness, with older age being significantly associated with increased aortic stiffness. However, the relationship between BMI and aortic elasticity shows mixed results, with some studies suggesting that a higher BMI may be associated with increased aortic stiffness, particularly in obese individuals (29, 30). Considering the evidence from our study, the results are somewhat inconsistent with common findings, especially regarding the role of age in increasing aortic stiffness. The low R² values and non-significant P-values suggest that the dataset used in this study may have unique characteristics or limitations that differ from those typically observed in larger or more diverse populations.
5.1. Study Limitations
This study may have encountered several potential limitations: The sample size might be limited, potentially affecting the generalizability of the findings. Moreover, the participants were selected from a single center, which may lead to selection bias. Ensuring adequate matching between the DMTI group and the healthy control group in terms of age, BMI, and other relevant factors is crucial. Other potential confounding variables, such as physical activity, dietary habits, socioeconomic status, family medical history, and many other key factors that could have affected the outcomes, were not accounted for in the study. Addressing these limitations through rigorous study design, robust statistical analysis, and careful interpretation of results could enhance the validity and applicability of findings from studies comparing the effects of age and BMI on aortic elasticity in children with DMTI and healthy children.
5.2. Conclusions
The study concluded that aortic strain and AD decreased, while the aortic stiffness beta index and pressure strain elastic modulus increased in children with type 1 diabetes compared to healthy controls. Normal BMI and early age were two important factors that accelerated stiffening in children with type 1 diabetes. In these children, the level of HbA1c did not show any effects on cardiac parameters, particularly aortic stiffening.
