


1. Background
Advances in the diagnosis and treatment of childhood cancers, particularly leukemias, have fortunately resulted in a dramatic increase in survival rates. Families are faced with the news of a life-threatening disease and a "new normal" that includes physical limitations and side effects, health crises, frequent hospital visits and hospitalizations, painful and invasive treatments, and disruptions to normal day-to-day life (1). Childhood cancer can affect the child’s siblings and parents, becoming a source of stress for the entire family. When parents are involved in caring for a child with cancer, they experience negative changes in quality of life (QOL), family function, and their relationships (2).
Health-related QOL is a broad conceptual term that refers to the patient’s perception of the impact of their illness and treatment on their social, psychological, and physical well-being (3). For children with cancer, QOL is an important consideration used to evaluate the child’s overall mental and physical health during and following treatment. Children undergoing oncological treatment show significant impairment in QOL compared with patients who are out of treatment (4). Childhood cancer affects not only the child but also the siblings and parents, highlighting the impact of cancer on the entire family (5).
Some families are more exposed to problems caused by cancer due to financial, personal, social, and family issues, and they endure more challenges than others. These families experience more severe distress and therefore require more attention, support, and multimodal interventions (6). Caring for a child with cancer affects the structure and functioning of the family. The continuous stress and impact of cancer on a child’s QOL are significant and warrant investigation. Evaluating the impact of childhood cancer on family functioning and the needs of parents and caregivers is necessary for planning and providing comprehensive care.
2. Objectives
There is limited literature on the experiences of families with children who have cancer in Iran. Therefore, the present study aimed to determine the family functioning and QOL of children with cancer in selected medical centers in Isfahan, Iran.
3. Methods
3.1. Study Design and Setting
The present study is a cross-sectional descriptive study conducted in affiliated hospitals of Isfahan University of Medical Sciences (Al-Zahra, Seyed-ol-Shohada). Considering the number of children hospitalized in each hospital’s wards, an available sampling method was employed. The study was conducted between December 2023 and August 2024.
3.2. Study Participants and Sampling
G*power software was used to calculate the sample size. With a power of at least 0.95 and a confidence interval of 95% (α ≤ 5%), the sample size was determined to be 67. After coordinating with the hospital managers and inpatient departments, the researcher approached the patients, introduced herself, explained the study’s aim, and obtained informed consent from the parents. Evaluation tools were administered and completed by the participants in one step. Participants were assured that all information obtained would be kept confidential. The research population included all children and adolescents with cancer in the selected treatment and palliative care centers of Isfahan. Inclusion criteria were: Age between 2 to 18 years, absence of chronic medical or psychiatric illness in the child except cancer, consent of the child and parents to participate in the study, and presence of at least one parent with the child. Exclusion criteria included unwillingness of the parent or child to participate in the study and incomplete completion of the questionnaire.
3.3. Data Collection Tool and Technique
Data were collected using a triple tool presented to the participants. The first questionnaire was a demographic characteristics questionnaire, including age, sex, type of cancer, level of education of children and parents, rank of birth, and mean time of hospitalization. The MacMaster family assessment device and a specific QOL measure for children with cancer were used to assess family function and QOL. The MacMaster family assessment device has 60 questions and 7 dimensions, assessing family performance in different areas and overall family performance. The Persian version of this device has been validated in Iran by Khosravi et al. [as cited in (7)]. This tool measures the ability of family members to adapt to roles within the family on a four-point Likert Scale: Completely agree (4), agree (3), disagree (2), and completely disagree (1). A higher score indicates lower family performance. The specific QOL measure for children with cancer includes 25 questions for children aged 2 - 5 years and 27 questions for children aged 6 - 18 years. It has demonstrated good external and internal validity (8). This tool covers dimensions such as side effects of therapy, mental, emotional, social, and cognitive fields. The questions evaluate events from the past month and are completed by parents. Scoring is done on a 5-point Likert Scale: "Always" (4 points), "often" (3 points), "sometimes" (2 points), "rarely" (1 point), and "never" (0 points). Scores are reversed and specified as 0 - 100.
After completing the informed consent form, data were obtained from the participants and analyzed using SPSS version 21 software. Before conducting multiple linear regression, it was checked whether the data met the key assumptions of regression.
3.4. Ethical Considerations
The present study was approved by the Research Ethics Committee of Isfahan University of Medical Sciences (IR.ARI.MUI.REC.1402.246). Prior to data collection, written informed consent was obtained from the parents of the children by the research team.
4. Results
In this study, 67 children under the age of 18 with cancer were investigated. Among them, 28 patients (41.8%) had leukemia, 13 patients (19.4%) had head and neck tumors, and 26 patients (38.8%) had other malignancies. The average age of these patients was 6.7 ± 2.4 years, and the average length of hospitalization was 55.1 ± 6.48 days. Table 1 shows the distribution of demographic and clinical characteristics of the patients.
Table 1.Frequency Distribution of Demographic Characteristics
| Variables | No. (%) |
|---|---|
| Age | |
| < 6 | 18 (26.9) |
| 6 - 12 | 37 (55.2) |
| 13 - 18 | 12 (17.9) |
| Sex | |
| Female | 31 (46.3) |
| Male | 36 (53.7) |
| Grade levels | |
| Kids | 20 (29.9) |
| 1 - 6 | 36 (53.7) |
| 7 - 12 | 11 (16.4) |
| Kind of disease | |
| Head and neck | 13 (19.4) |
| Leukemia | 28 (41.8) |
| Others | 26 (38.8) |
| Time of hospitalization | |
| < 1 | 31 (46.3) |
| 1 - 3 | 27 (40.3) |
| > 3 | 9 (13.4) |
| Birth rank | |
| 1 | 30 (44.8) |
| 2 | 26 (38.8) |
| ≥ 3 | 11 (16.4) |
| Number of children | |
| 1 | 14 (20.9) |
| 2 | 33 (49.3) |
| ≥ 3 | 20 (29.9) |
| Mothers’ education | |
| Under diploma | 17 (25.4) |
| Diploma | 27 (40.3) |
| University | 23 (34.3) |
| Fathers’ education | |
| Under diploma | 23 (34.3) |
| Diploma | 23 (34.3) |
| University | 21 (31.3) |
| Mothers’ occupation | |
| Housewife | 63 (94) |
| Employee | 4 (6) |
| Fathers’ occupation | |
| Freelance | 58 (86.6) |
| Employee | 6 (9) |
| Others | 3 (4.5) |
The average score of the total QOL in the studied patients was 50.22 ± 16.69, indicating an intermediate level. The average scores in specific areas were as follows: Treatment complications, 45.42 ± 22.5; psychological domain, 46.7 ± 21.45; emotional domain, 25.51 ± 21; social domain, 58.46 ± 33.3; and cognitive domain, 65 ± 24.18 (Figure 1). In Table 2, the mean and standard deviation of the QOL score and related components are shown. According to this table, the averages of the social and cognitive domains had a statistically significant relationship with the type of disease.
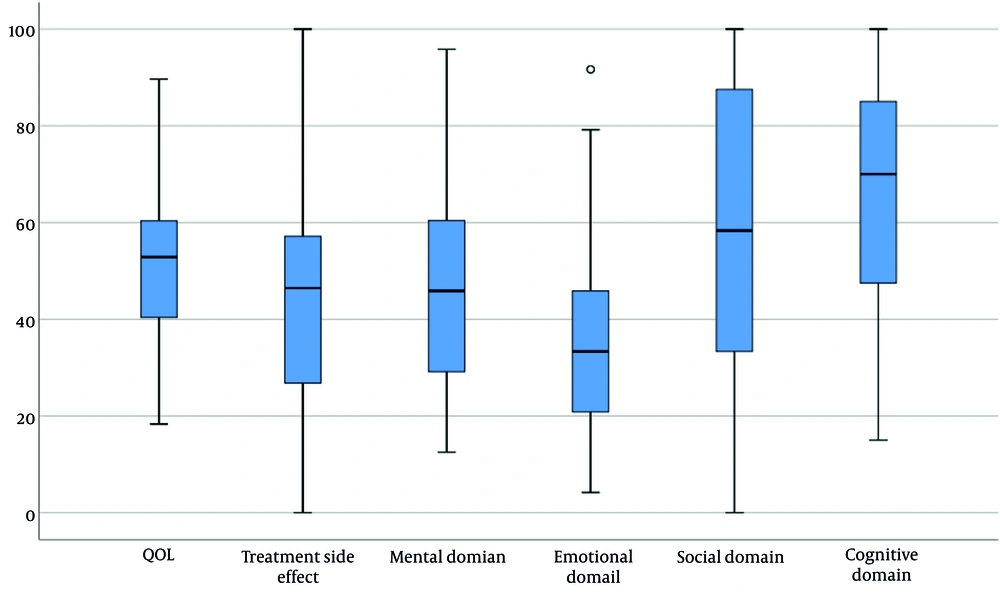
Figure 1.
Median, domain and percentile 25% - 75% quality of life (QOL) score of participants
Table 2.Mean ± SD of Quality of Life Based on Demographic Characteristics
| Variables | Total QOL | Side Effect Treatment | Mental Domain | Emotional Domain | Social Domain | Cognitive Domain |
|---|---|---|---|---|---|---|
| Age | ||||||
| < 6 | 54 ± 15.1 | 55.4 ± 16.9 | 56.9 ± 20.1 | 29.2 ± 17.8 | 55.6 ± 35.8 | 73.1 ± 24 |
| 6 - 12 | 49.4 ± 18 | 42.8 ± 24.5 | 22.4 ± 3.7 | 39.5 ± 22.9 | 33.8 ± 5.6 | 57.5 ± 28.1 |
| 12 - 18 | 47 ± 15.1 | 38.7 ± 19.6 | 38.2 ± 15.3 | 32.6 ± 17.3 | 28.2 ± 8.1 | 65 ± 24.2 |
| P-value | 0.49 | 0.08 | 0.039 | 0.20 | 0.55 | 0.195 |
| Sex | ||||||
| Female | 52 ± 19.7 | 47.8 ± 23.2 | 51.3 ± 22.8 | 37.6 ± 19 | 58.6 ± 36.4 | 64.5 ± 25.4 |
| Male | 48.7 ± 13.7 | 43.4 ± 22 | 42.7 ± 19.7 | 33.7 ± 22.6 | 58.3 ± 30.8 | 65.4 ± 23.4 |
| P-value | 0.43 | 0.42 | 0.10 | 0.45 | 0.97 | 0.88 |
| Kind of disease | ||||||
| Head and neck | 48.2 ± 19.2 | 37.1 ± 24.8 | 44.6 ± 19.8 | 42.9 ± 17.4 | 52.6 ± 36.1 | 63.8 ± 23.2 |
| Leukemia | 46.2 ± 18.5 | 45.7 ± 21.5 | 44.6 ± 26.2 | 35.3 ± 21.2 | 49.4 ± 30.8 | 55.9 ± 25.1 |
| Others | 55.6 ± 11.8 | 49.3 ± 22.1 | 50 ± 16.4 | 32.1 ± 22 | 71.2 ± 31.5 | 75.4 ± 20 |
| P-value | 0.103 | 0.28 | 0.61 | 0.31 | 0.041 | 0.01 |
| Hospitalization time | ||||||
| < 1 | 47.8 ± 19.7 | 45.5 ± 26.6 | 47.3 ± 23.8 | 32.3 ± 21.9 | 54 ± 33.2 | 60 ± 25.1 |
| 1.3 | 52.4 ± 13.6 | 48.4 ± 17.9 | 44.4 ± 19.7 | 38.4 ± 30.4 | 64.2 ± 31.2 | 66.5 ± 22.9 |
| > 3 | 51.9 ± 14.4 | 36.1 ± 18.7 | 51.4 ± 19.3 | 38 ± 20 | 56.5 ± 40.6 | 77.8 ± 22 |
| P-value | 0.56 | 0.37 | 0.69 | 0.51 | 0.51 | 0.14 |
Abbreviation: QOL, quality of life.
Table 3 shows the mean and standard deviation of the family performance score according to demographic characteristics. The mean family performance score was 2.190, with a minimum range of 1 and a maximum level of 2.75. According to the table, the average scores of the domains of problem-solving, communication, and emotional engagement did not have a statistically significant relationship with any demographic characteristics. However, the component of emotional companionship had a significant relationship with the disease type variable. There was also a significant relationship between the global functioning of the family and the type of disease.
Table 3.Mean ± SD of Family Functioning Based on Demographic Characteristics
| Variables | Problem Solving | Relationship | Roles | Emotional Companionship | Emotional Engagement | Behavior Control | Global Family Functioning |
|---|---|---|---|---|---|---|---|
| Age | |||||||
| < 6 | 1.84 ± 0.41 | 2.24 ± 0.35 | 2.46 ± 0.35 | 2.25 ± 0.39 | 2.15 ± 0.56 | 2.27 ± 0.42 | 2.16 ± 0.41 |
| 6 - 12 | 1.89 ± 0.36 | 2.32 ± 0.34 | 2.38 ± 0.28 | 2.18 ± 0.38 | 2.06 ± 0.50 | 2.28 ± 0.31 | 2.09 ± 0.37 |
| 12 - 18 | 1.85 ± 0.57 | 2.1 ± 0.48 | 2.42 ± 0.35 | 1.96 ± 0.42 | 1.90 ± 0.48 | 2.20 ± 0.37 | 2.08 ± 0.44 |
| P-value | 0.91 | 0.18 | 0.69 | 0.13 | 0.44 | 0.795 | 0.80 |
| Sex | |||||||
| Female | 1.92 ± 0.38 | 2.33 ± 0.37 | 2.43 ± 0.29 | 2.23 ± 0.36 | 2.11 ± 0.54 | 2.34 ± 0.33 | 2.18 ± 0.36 |
| Male | 1.83 ± 0.44 | 2.20 ± 0.37 | 2.39 ± 0.33 | 2.10 ± 0.54 | 2.01 ± 0.49 | 2.19 ± 0.35 | 2.05 ± 0.41 |
| P-value | 0.35 | 0.14 | 0.65 | 0.197 | 0.44 | 0.076 | 0.17 |
| Kind of disease | |||||||
| Head and neck | 1.85 ± 0.36 | 2.24 ± 0.39 | 2.39 ± 0.34 | 2.06 ± 0.34 | 2 ± 0.44 | 2.16 ± 0.23 | 2.13 ± 0.34 |
| Leukemia | 1.98 ± 0.31 | 2.34 ± 0.27 | 2.39 ± 0.31 | 2.30 ± 0.34 | 2.15 ± 0.52 | 2.31 ± 0.32 | 2.24 ± 0.35 |
| others | 1.77 ± 0.51 | 2.19 ± 0.45 | 2.43 ± 0.31 | 2.05 ± 0.44 | 1.98 ± 0.54 | 2.27 ± 0.42 | 1.96 ± 0.42 |
| P-value | 0.17 | 0.32 | 0.88 | 0.038 | 0.44 | 0.469 | 0.024 |
| Hospitalization time | |||||||
| < 1 | 1.92 ± 0.29 | 2.28 ± 0.29 | 2.44 ± 0.28 | 2.20 ± 0.39 | 2.09 ± 0.46 | 2.30 ± 0.28 | 2.23 ± 0.29 |
| 1.3 | 1.84 ± 0.47 | 2.25 ± 0.45 | 2.36 ± 0.34 | 2.12 ± 0.37 | 2.01 ± 0.59 | 2.25 ± 0.39 | 2.02 ± 0.46 |
| > 3 | 1.80 ± 0.57 | 2.22 ± 0.42 | 2.44 ± 0.35 | 2.11 ± 0.49 | 2.08 ± 0.50 | 2.17 ± 0.42 | 1.95 ± 0.37 |
| P-value | 0.63 | 0.91 | 0.53 | 0.69 | 0.83 | 0.61 | 0.053 |
Assessing the relationship between the QOL score and family function shows a reverse correlation of 24% between them, which is statistically significant (P = 0.048). Considering the inverse scoring of the two questionnaires, more favorable family performance (lower scores) is associated with better QOL (higher scores) (Table 4).
Table 4.Correlation Between Quality of Life and Family Functioning
| FamilyFunctioning | QOL (Total) | Treatment Side Effect | Mental Domain | Emotional Domain | Social Domain | Cognitive Domain |
|---|---|---|---|---|---|---|
| Total | -0.24 (0.048) | 0.056 (0.65) | -0.099 (0.43) | -0.27 (0.028) | -0.18 (0.14) | -0.32 (0.008) |
| Problem solving | -0.23 (0.067) | 0.17 (0.17) | -0.15 (0.23) | -0.20 (0.11) | -0.18 (0.15) | -0.39 (0.001) |
| Relationship | -0.23 (0.064) | 0.02 (0.86) | -0.19 (0.13) | -0.21 (0.09) | -0.08 (0.52) | -0.35 (0.004) |
| Roles | -0.15 (0.22) | -0.05 (0.68) | 0.05 (0.68) | -0.14 (0.27) | -0.23 (0.06) | -0.08 (0.51) |
| Emotional companionship | -0.22 (0.07) | 0.09 (0.47) | -0.12 (0.36) | -0.24 (0.053) | -0.22 (0.077) | -0.24 (0.049) |
| Emotional engagement | -0.14 (0.27) | -0.024 (0.85) | -0.008 (0.95) | -0.26 (0.034) | -0.047 (0.71) | -0.15 (0.23) |
| Behavior control | -0.04 (0.73) | 0.08 (0.5) | 0.04 (0.73) | -0.12 (0.34) | -0.01 (0.90) | -0.14 (0.26) |
| Global family functioning | -0.32 (0.009) | 0.02 (0.88) | -0.16 (0.2) | -0.28 (0.024) | -0.25 (0.04) | -0.38 (0.001) |
Abbreviation: QOL, quality of life.
5. Discussion
Children’s cancer is a major concern for the mental health system due to its impact on various aspects of life. This disorder can affect the personal and social life of patients and disrupt the normal life process. It can cause significant distress to both the family and the individual patient, affecting overall family functioning. This study showed that the most affected dimension of QOL by cancer is the emotional domain. A study by Zahed et al. reports similar findings (9), indicating that children with cancer experience a wide range of emotional disturbances that affect their QOL. These children and survivors may experience severe anxiety, inhibited and withdrawn behavior, behavior problems, excessive somatic complaints, intense stress, post-traumatic stress disorder (PTSD), academic difficulties, peer relationship challenges, and concerns about future career and relationships.
Another finding of this study is that the social and cognitive domains of QOL had a statistically significant relationship with the type of cancer. The type and location of the tumor influence the type, severity, and extent of cognitive dysfunction. Patients with head and neck tumors can experience impairments in executive function, memory, and attention. A systematic review of patients with glioma has shown that between 23% and 90% of patients had cognitive impairment, while the rate of cognitive decline in tumors in other parts of the body is less than in the head and neck region (10). Chemotherapy and radiotherapy, common treatments for cancer, can also affect the cognitive status of patients.
Regarding the social effects of cancer on patients, it should be noted that this disease can reduce a person’s ability to communicate with peers (11). Cancers or treatments that affect a person’s appearance can impact body image, self-concept, and ultimately, social competence. On the other hand, the more advanced and extensive the tumor type, the more family functioning is affected. Family functioning refers to the ability of the family to adapt to new conditions and stresses, enabling members to solve problems through coordination and cooperation (12). Cancers requiring multimodal treatment, including radiotherapy, chemotherapy, and surgery, affect family functioning more than those with a single treatment procedure. The impact of cancer on family functioning extends beyond the family environment, affecting the family’s relationship with society (12). While high-functioning families may seek social resources and strengthen communication during treatment, low-functioning families may struggle to cope with adverse events and fail to establish a new pattern of family functioning.
Another finding of this study was the statistically significant association between family functioning and QOL in pediatric patients with cancer. Studies have shown that families with a child with cancer face many problems in family communication and a decline in QOL (13). This decline can affect relationships between family members, problem-solving within the family, roles, and emotions in the family environment, leading to deterioration in family performance. From the onset of cancer diagnosis, the disease can impact various aspects of the caregiver’s life, including social, physical, and psychological aspects of the parents, and generally, the lifestyle of family members (14). Therefore, increasing awareness about the emotional damage to family members can improve the QOL of patients with cancer.
5.1. Conclusions
The functioning of the family and the QOL of children with cancer are closely related, and improvements in either domain can enhance the child’s sense of well-being.

