


1. Background
Type 1 diabetes mellitus (T1DM) is a prevalent chronic disease among the pediatric population, significantly impacting their lives (1, 2). It ranks as the second most common autoimmune disease in children and is associated with substantial mortality and morbidity throughout their lifespan (3). The incidence of T1DM varies across different regions of the world, but there has been a global increase in its occurrence (4, 5). In 2021, approximately 355,900 new cases of type 1 diabetes were reported globally among children and adolescents, with varying levels of underdiagnosis depending on the region. By 2050, the projected number of incident childhood cases is estimated to rise to 476,700 (6).
Type 1 diabetes mellitus is characterized by low or absent endogenous insulin levels, necessitating lifelong insulin administration and continuous monitoring of blood sugar levels (5). The acute and long-term complications associated with T1DM, such as hypoglycemia, diabetic ketoacidosis, and various organ complications, considerably impact morbidity and mortality rates in pediatric patients (7, 8). These complications also impose a significant burden on healthcare services and result in increased healthcare costs (9).
While the exact cause of T1DM remains incompletely understood, research has shed light on its multifactorial etiology involving genetic, environmental, chemical-induced, or infectious factors (5, 8, 10). The destruction of beta cells and impaired glucose utilization are central to the disease’s pathogenesis (8). Consequently, ongoing investigations focus on interventions aimed at preserving or regenerating beta cells to achieve a less severe disease course and potential cure (4, 8).
In recent years, there has been increasing recognition of the influence of viral infections, the hygiene hypothesis, and alterations in the gut microbiome in the development and progression of T1DM (8, 11). Notably, gastrointestinal bacteria play a crucial role in the development of T1DM by influencing the function of the intestinal mucosa and promoting autoimmunity against pancreatic beta cells. Disturbance of the intestinal bacterial flora significantly impacts glucose, lipid, and insulin metabolism, leading to the onset of metabolic syndrome, insulin resistance, and diabetes (3). Emerging evidence indicates disparities in the composition of intestinal bacteria between individuals with and without diabetes, characterized by a reduction in strains belonging to the phylum Firmicutes and Clostridia, accompanied by a rise in Bacteroidetes and Proteobacteria strains (12).
Following the onset of T1DM in pediatric patients, a honeymoon phase ensues, characterized by partial remission, preserved beta cell function, and decreased insulin requirements (13). There is no consensus on the clinical definition of the honeymoon phase, but it could be defined as an insulin requirement of less than 0.5 units/kg/day, accompanied by an HbA1c level below 7% (14). The honeymoon phase, spanning between 7 and 9 months, is considered crucial in the early management of diabetes (15). It reveals optimal efficacy in introducing novel dietary patterns, immunotherapies, and strategies aimed at preserving and/or expanding β-cell mass (15). Predictors of a prolonged honeymoon phase include older age at onset, male gender, absence of ketoacidosis, and minimal metabolic disturbance at diagnosis (16, 17). Various interventions have been proposed to extend or enhance this phase, but their impact on residual beta cell functioning remains inconclusive (14, 15).
In recent years, the potential use of synbiotics in managing diabetes, including type 1 diabetes, has been investigated (8, 18, 19). Notably, a systematic review has demonstrated the potential therapeutic value of synbiotics in diabetes management (19). Although promising effects have been observed in animal studies, further research is needed to validate these findings in human trials (19).
2. Objectives
Therefore, given the affordability, safety, and accessibility of synbiotics, we aimed to evaluate the impact of oral synbiotics on glycemic control and the duration of the honeymoon phase in newly diagnosed children with T1DM. The findings of this research will contribute to ongoing efforts aimed at improving the management and long-term outcomes in pediatric diabetes care.
3. Methods
3.1. Study Design and Settings
This study was conducted as a parallel-group, triple-blind, randomized controlled trial at the outpatient clinic of Akbar Hospital, a tertiary medical center located in Mashhad, Iran, between March 2022 and March 2023.
3.2. Study Population
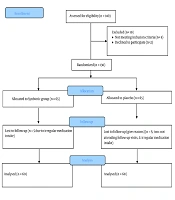
Children aged 6 to 18 years with newly diagnosed type 1 diabetes, who provided informed consent and were committed to maintaining medication adherence throughout the study, were eligible. Children with coexisting conditions such as significant cardiac, hepatic, or renal diseases, immunodeficiency, allergies to synbiotics, and unwillingness to continue participating in the study were excluded. The diagnosis of T1DM was established based on the criteria outlined by the International Society for Pediatric and Adolescent Diabetes (ISPAD) (20). During the course of the study, a total of 10 individuals were excluded. Within the synbiotic group, five individuals were excluded due to irregular medication intake. In the control group, two individuals did not attend follow-up visits, and three individuals were excluded due to irregular medication intake (Figure 1).

Flow diagram of the randomized study
3.3. Ethical Considerations
The research project was approved by the Ethics Committee of Mashhad University of Medical Sciences. All methods were conducted following the Declaration of Helsinki. The participants or their guardians provided their written informed consent to participate in the study (IRCT20200117046164N3).
3.4. Study Procedure
3.4.1. Randomization
A simple randomization was carried out on an individual basis using Rand List software. The allocation was performed by an independent monitor and remained blinded until the end of the study. Patients were randomly assigned to the synbiotic or placebo group in a 1:1 ratio. The random allocation to the two groups was done using a 4-block design [AABB (1), ABAB (2), ABBA (3), BBAA (4), BABA (5), BAAB (6)]. The list of blocks was written and assigned numbers, and random numbers between 1 and 6 were selected using the website http://www.graphpad.com/quickcalcs/index.cfm. The treatment allocation list was determined based on the previous random numbers (...AABB-BBAA-BABA-).
3.4.2. Blinding
The researchers were blinded to group assignments throughout the study. The synbiotic capsules were given randomized codes, and clinicians blindly administered them to participants in the synbiotic and placebo groups. Data collection and analysis were also performed blindly. All follow-up data were collected by two researchers who were blinded to group assignments. The researchers who generated the randomization sequence were not involved in the treatment or future evaluation of the participants.
3.4.3. Study Interventions
In the synbiotic group, newly diagnosed children with T1DM aged 6 to 18 years received synbiotics for six months. The synbiotics were supplied in the form of capsules by ZIST TAKHMIR Company, Iran, containing the strains Lactobacillus rhamnosus, L. casei, L. bulgaricus, L. acidophilus, Bifidobacterium breve, B. longum, and Streptococcus thermophiles at a concentration of 109 CFU. The product also contained fructooligosaccharides (FOS) as a placebo and was gluten-free. In the placebo group, newly diagnosed children with T1DM aged 6 to 18 years received a placebo for six months. The placebo was similar in taste and appearance to the active product and also contained FOS as a placebo. The placebo did not contain synbiotics and was gluten-free.
3.4.4. Monitoring of the Study Participants
Participants were monitored at three-month intervals for six months. During each visit, glycemic control and the total daily insulin dose required to maintain optimal glycemic control were evaluated and recorded.
3.4.5. Outcome Measures
The main outcome variables of the study included the total daily insulin dose and HbA1c levels. Secondary measures included insulin requirements (unit/kg/day), the occurrence of concomitant autoimmune diseases (such as celiac disease and Hashimoto’s thyroiditis), and complications such as hypoglycemia or diabetic ketoacidosis during the study period. The measurements were obtained by asking the patient and based on prescribed insulin for glycemic control.
3.5. Statistical Analysis
Based on an attrition rate of 20%, a sample size of 50 individuals per group was determined, resulting in a calculated total sample size of 60 for each group. The formula used to calculate the sample size was t-tests - means: Difference between two independent means (two groups), where a confidence level of 95% was considered, with α set at 0.05 and the critical value, Zα/2, as 1.96. The values of Zβ, representing the critical value of the normal distribution at β (e.g., 1.28 for a power of 90%), and σ2, denoting the population variance, were also taken into account. The aim was to detect a specific difference, represented by d. For this study, a total of 130 individuals were initially included in the sample. However, 10 individuals were subsequently excluded during the sampling process. Out of these exclusions, 5 individuals from the synbiotic group were excluded due to irregular medication consumption, while in the control group, 2 individuals were excluded due to non-attendance, and 3 individuals were excluded due to irregular medication consumption.
Data were analyzed using SPSS version 22.0. Descriptive statistics, including mean, standard deviation, and frequency distribution, were used to describe the participants’ characteristics. The distribution normality of quantitative variables was tested using the Kolmogorov-Smirnov test. The homogeneity of the two groups in terms of underlying and confounding variables was assessed using the chi-square test and independent t-tests. Between-group comparisons were performed using independent t-tests, while within-group comparisons were conducted using paired t-tests to achieve the main objectives of the study. For all parameters, the P-value was set at 0.05.
4. Results
A total of 120 patients with T1DM were enrolled in this study. There were no statistically significant differences in mean age, duration of illness, and BMI percentile between the synbiotic and placebo groups (Table 1). The mean pre-intervention insulin dose was 11.40 ± 5.01 in the synbiotic group and 12.88 ± 4.90 in the placebo group. No significant difference was found in the mean insulin dose between the two groups (P > 0.05). However, after six months of follow-up, the mean long-acting insulin dose was 9.45 ± 4.37 in the synbiotic group and 9.85 ± 5.05 in the placebo group. There was no significant difference observed in the mean long-acting insulin dose between the two groups before the intervention and three months after the study (P > 0.05). However, after six months of follow-up, the synbiotic group demonstrated a significant reduction in long-acting insulin levels (P < 0.05) (Table 2).
| Variables | Synbiotic Group (n = 60) | Placebo Group (n = 60) | P-Value |
|---|---|---|---|
| Age | 9.48 ± 2.31 | 9.28 ± 2.61 | 0.658 |
| Weight (kg) | 31.14 ± 10.94 | 29.94 ± 10.70 | 0.545 |
| Height (cm) | 134.10 ± 14.07 | 131. 64 ± 14.63 | 0.353 |
| Sex | 0.100 | ||
| Female | 25 (41.7) | 34 (56.7) | |
| Male | 35 (58.3) | 26 (43.3) | |
| Percentile | 0.646 | ||
| Under weight | 12 (20.0) | 14 (23.7) | |
| Normal weight | 41 (68.3) | 38 (64.4) | |
| Over weight | 6 (10.0) | 4 (6.8) | |
| Obese | 1 (1.7) | 3 (2.5) |
a Values are expressed as No. (%) or mean ± SD.
| Variables | Synbiotic Group (n = 60) | Placebo Group (n = 60) | P-Value |
|---|---|---|---|
| Short-acting insulin | |||
| Pre-intervention short-acting insulin | 11.40 ± 5.01 | 13.08 ± 4.60 | 0.058 |
| Post-intervention short-acting insulin (3 mon) | 11.00 ± 5.22 | 13.05 ± 4.60 | 0.025 |
| Post-intervention short-acting insulin (6 mon) | 9.62 ± 5.10 | 12.77 ± 4.70 | 0.001 |
| Post-intervention short-acting insulin (9 mon) | 9.72 ± 5.30 | 12.40 ± 4.8 | 0.013 |
| Post-intervention short-acting insulin (12 mon) | 9.81 ± 5.35 | 12.55 ± 4.96 | 0.013 |
| Long-acting insulin | |||
| Pre-intervention long-acting insulin | 9.45 ± 4.37 | 9.85 ± 5.05 | 0.644 |
| Post-intervention long-acting insulin (3 mon) | 9.30 ± 4.56 | 9.55 ± 5.39 | 0.785 |
| Post-intervention long-acting insulin (6 mon) | 8.28 ± 4.85 | 10.67 ± 5.65 | 0.015 |
| Post- intervention long-acting insulin (9 mon) | 8.56 ± 5.06 | 10.73 ± 6.04 | 0.064 |
| Post-intervention long-acting insulin (12 mon) | 8.57 ± 5.06 | 10.77 ± 6.09 | 0.062 |
a Values are expressed as mean ± SD.
The total daily insulin dose did not significantly differ between the patients before the study (Table 3). Nevertheless, after six months of follow-up, the insulin intake in the synbiotic group dropped significantly (P < 0.05) (Figure 2). The mean pre-intervention HbA1c levels were 12.18 ± 2.33 in the synbiotic group and 11.48 ± 2.73 in the placebo group. There were no significant differences in mean HbA1c levels between the two groups before the study and three months after synbiotic consumption (P > 0.05) (Table 4). After six months and 12 months of follow-up, HbA1c levels in the synbiotic group showed a significant decrease (P < 0.05) (Figure 3).
| Variables | Synbiotic Group (n = 60) | Placebo Group (n = 60) | P-Value |
|---|---|---|---|
| Pre-intervention total daily dose of insulin/kg | 0.69 ± 0.25 | 0.78 ± 0.25 | 0.049 |
| Post-intervention total daily dose insulin/kg (3 mon) | 0.63 ± 0.27 | 0.83 ± 0.28 | 0.000 |
| Post-intervention total daily dose insulin/kg (6 mon) | 0.59 ± 0.27 | 0.81 ± 0.27 | 0.000 |
| Post-intervention total daily dose insulin/kg (9 mon) | 0.61 ± 0.31 | 0.80 ± 0.25 | 0.002 |
| Post-intervention total daily dose insulin/kg (12 mon) | 0.60 ± 0.31 | 0.80 ± 0.25 | 0.002 |
a Values are expressed as mean ± SD.

Comparison of the total daily insulin dose in the synbiotic and placebo groups
| Variables | Synbiotic Group (n = 60) | Placebo Group (n = 60) | P-Value |
|---|---|---|---|
| Pre- intervention HbA1C | 12.18 ± 2.33 | 11.48 ± 2.73 | 0.136 |
| Post-intervention HbA1C (3 mon) | 9.55 ± 1.54 | 9.35 ± 1.62 | 0.491 |
| Post-intervention HbA1C (6 mon) | 8.90 ± 1.76 | 9.54 ± 1.56 | 0.039 |
| Post-intervention HbA1C (9 mon) | 8.66 ± 1.44 | 9.25 ± 1.34 | 0.049 |
| Post-intervention HbA1C (12 mon) | 8.65 ± 1.46 | 9.26 ± 1.37 | 0.045 |
a Values are expressed as mean ± SD.

Comparison of HbA1C levels in the synbiotic and placebo groups
The mean HbA1c level before intervention in the synbiotic group was 12.18 ± 2.33 and in the placebo group was 11.48 ± 2.73. The two groups did not differ significantly in terms of mean HbA1c levels before the study and three months after synbiotic consumption (P > 0.05). After 6, 9, and 12 months of follow-up, the HbA1c levels of patients in the synbiotic group decreased, and this decrease was statistically significant (P < 0.05). In the placebo group, 3.3% of the participants were in the honeymoon phase, while 13.3% of participants in the synbiotic group were in the honeymoon phase at the end of six months, and at the end of the twelfth month, 8.5% remained in this period (Table 5).
| Variables | Placebo Group | Synbiotic Group | P-Value |
|---|---|---|---|
| The honeymoon phase at the time of diagnosis | 5 (8.3) | 9 (15.0) | 0.255 |
| Honeymoon phase (6 mon) | 2 (3.3) | 8 (13.3) | 0.048 |
| Honeymoon phase (12 mon) | 2 (4.7) | 4 (8.5) | 0.463 |
a Values are expressed as No. (%).
At the end of one year of follow-up, the C-peptide level in the patients’ blood was measured. There was no statistically significant difference in the percentage of C-peptide above 0.7 in the patients of the two groups. The mean serum C-peptide level was also measured in the two groups. It was reported as 0.13 ± 0.199 in the synbiotic group and 0.22 ± 0.24 in the placebo group. There was no statistically significant difference in the mean C-peptide level between the two groups (Table 6).
a Values are expressed as No. (%) or mean ± SD.
b Fisher’s exact test.
c Independent samples test.
5. Discussion
This study presents a randomized, triple-blind clinical trial aimed at assessing the effect of synbiotics on glycemic control and the duration of the honeymoon phase among pediatric patients with T1DM in Iran. A comparison of the synbiotic and placebo groups in terms of the average amount of short-acting insulin showed that at the beginning of the study, the two groups did not differ significantly. However, after follow-ups at 6, 9, and 12 months, the amount of short-acting insulin in the synbiotic group decreased significantly. The two groups did not differ significantly in terms of the average amount of long-acting insulin before the intervention and three months after the start of the intervention. After six months of follow-up, the amount of long-acting insulin in the synbiotic group showed a statistically significant decrease. The daily dose of insulin received was also not significantly different in the patients before the study, but after six months of follow-up, the amount of insulin received in the synbiotic group patients decreased significantly. In the follow-ups of the ninth and twelfth months, although the amount of insulin received decreased, this decrease was not statistically significant.
The comparison of the mean daily total insulin dose based on weight in the synbiotic and placebo groups also showed that although there was no significant difference before the study, after follow-up at 6, 9, and 12 months, the amount of insulin received by patients in the synbiotic group decreased significantly. The two groups were also compared in terms of mean HbA1c. The results showed that the two groups did not differ significantly in terms of mean HbA1c before the intervention and three months after synbiotic consumption, but after follow-up at 6, 9, and 12 months, the HbA1c levels of patients in the synbiotic group decreased significantly. These results are consistent with the findings of Ejtehad et al. (21), who found that the consumption of synbiotic yogurt significantly reduced fasting blood glucose and HbA1c levels among patients with type 2 diabetes. Similarly, Andreasen et al. (22) conducted a study on patients with type 2 diabetes and observed that a four-week treatment with the synbiotic strain L. acidophilus NCFM improved insulin sensitivity compared to a placebo.
These findings suggest that synbiotics hold promise as an agent for diabetes management. Our study aligns with previous research (23, 24) that supports the positive impact of synbiotics on glycemic control, thereby strengthening the hypothesis that gut dysbiosis contributes to the pathogenesis of T1DM. In children with T1DM, the gut microbiome composition displays an elevation in virulence factors, phage, prophage, and motility genes. They also have a lower count of bacteria that produce butyrate, a type of short-chain fatty acid (SCFA) known for its anti-inflammatory actions (25).
Importantly, despite the observed benefits, it is critical to consider potential confounders that may have influenced our outcomes. Variables such as baseline dietary intake, level of physical activity, socioeconomic background, genetic susceptibility, medication adherence, and the initial composition of the gut microbiota could all serve as confounding factors. These elements were not fully evaluated or adjusted for in this trial, which may have introduced bias in interpreting the true effect of synbiotics. Additional factors such as psychosocial stress, pubertal status, or concurrent infections might also have influenced insulin requirements and glycemic control. Future research should address these confounders through stratification or multivariate regression models to better isolate the impact of synbiotic interventions.
Furthermore, deeper exploration into mechanistic pathways is needed to elucidate how synbiotics might modulate glycemic outcomes. Current hypotheses include modulation of the gut microbiome to favor butyrate-producing bacteria, improvement of mucosal immunity and intestinal barrier integrity, anti-inflammatory effects through downregulation of Toll-like receptor (TLR) signaling, and enhancement of glucagon-like peptide-1 (GLP-1) secretion. Synbiotics may also affect bile acid metabolism and microbial metabolite production, contributing to improved insulin sensitivity. Experimental studies in animal models support these mechanisms by showing preserved β-cell integrity, reduced oxidative stress, and mitigation of hyperglycemia. Hence, investigating inflammatory markers, gut microbiome profiles, SCFA levels, and incretin hormones in future clinical trials may provide deeper mechanistic insight and support causality in observed clinical outcomes.
However, the precise mechanism through which synbiotics improve the glycemic profile remains unclear (19, 23). The underlying mechanisms suggested regarding the potential of synbiotics to prevent or delay the onset of T1DM include the augmentation of GLP-1 secretion to enhance carbohydrate metabolism, reduction of glucotoxicity, improvement in intestinal epithelium integrity, inhibition of the TLR pathway, attenuation of pro-inflammatory signaling, enhancement of insulin sensitivity, and consequent alterations in gene expression (23, 25). Animal experiments suggest that synbiotics reveal inhibitory effects against insulin depletion and nitrite formation, leading to the suppression of streptozotocin-induced diabetes. Furthermore, by protecting pancreatic β-cells from damage, synbiotics have the potential to delay STZ-induced alterations in glucose homeostasis by sustaining insulin levels. Additionally, synbiotics, when combined with skim milk, can enhance insulin resistance in the skeletal muscles and adipose tissues of rats subjected to a high-fructose diet, ultimately resulting in declined fasting plasma glucose (FPG) levels (19, 26, 27).
However, although Asemi et al. (25) observed a preventive effect on the elevation of FPG levels, they found no significant beneficial effect on glycemic control in diabetic patients who received multispecies synbiotic supplements. This may be linked to a notable elevation in serum insulin levels. Nevertheless, when compared to the control group, these effects were relatively less pronounced. Notably, the duration of the treatment period appears to play a more crucial role in effectiveness than the dosage of administration. In our study, although no significant difference in HbA1c levels was observed between the two groups before the study and three months after synbiotic consumption, HbA1c levels in the synbiotic group showed a significant reduction after six months. The observed disparities between our results and previous research can be attributed to several factors, including variations in the selection of synbiotics, differences in study design, and potentially the distinct characteristics of the subjects involved. Further research is warranted to establish a comprehensive understanding of the effect of synbiotic supplements on glycemic control in pediatric patients with T1DM.
In our study, the honeymoon period was defined as a total daily insulin dose of less than 0.5 units/kg and an HbA1c of less than 7%. Accordingly, the duration of this period was compared in the two groups. In the placebo group, 8.3% of patients were in the honeymoon period at the time of diagnosis, 3.3% at the end of six months, and 4.7% at the end of the twelfth month. In the synbiotic group, 15% of patients were in the honeymoon period at the beginning. In the sixth month, 13.3% remained in this period, and at the end of the twelfth month, 8.5% remained in this period. Therefore, a longer remission period was observed in the synbiotic group patients. The prevalence of the remission phase in patients with T1DM varies significantly, ranging from 30% to 80% (14, 15). The observed phenomenon of a significant proportion of children entering the honeymoon phase suggests the persistence of β-cell function despite the initiation of insulin treatment. Furthermore, it indicates an inherent attempt at islet regeneration within favorable immunomodulatory conditions (14). In our study, more children in the synbiotic group achieved a honeymoon phase compared to the placebo group, which aligns with Kumar et al.’s findings indicating higher remission rates in the synbiotic group (26.6%) compared to the placebo group (8.8%) over three months (23). However, the mechanism behind this improvement in remission rates remains unknown. Further research is necessary to elucidate these mechanisms and to fully understand the potential of synbiotic supplements for pediatric T1DM management.
Our study possesses a significant strength as it was designed as a randomized, triple-blind, placebo-controlled study. However, it is important to acknowledge some limitations within this study. Firstly, due to temporal restrictions, the follow-up period for patients was confined to a duration of six months. Secondly, the feasibility of exploring anthropometric factors was restricted.
5.1. Conclusions
The findings of our study demonstrate that the consumption of synbiotics, as compared to a placebo, over six months in newly diagnosed children with T1DM, can result in a significant reduction in insulin requirements, an enhancement in HbA1c levels, and the prolongation of the honeymoon phase. This suggests that synbiotics may have a supportive role in improving glycemic control in these children and can be utilized alongside other diabetes control treatments. However, further studies with a prolonged intervention duration are necessary to evaluate the enduring effects of synbiotics over time. Additionally, investigating the effect of synbiotic supplementation on other biomarkers associated with beta-cell damage in T1DM is essential for comprehending the mechanistic basis for the favorable glycemic effects of synbiotics.
