

1. Background
Predictive models such as the pediatric risk of mortality (PRISM III), pediatric index of mortality (PIM3), and pediatric logistic organ dysfunction (PELOD-2) are objectively used to assess the severity of illness, inter- and intra-unit comparisons based on time, evaluation and comparison of outcomes, survival rate, quality, and cost-efficacy of measures, randomization and stratification of patients to clinical trials, and decision making in clinical settings.
The PRISM III is a common instrument to assess severity of illness in terms of physiological variables and their ranges (1). The PIM3 is also a scoring system provides reliable estimates of mortality risk among children admitted to ICU (2). Also, the PELOD-2 is a valid scoring system allows assessment of severity of cases of multi organ dysfunction in the pediatric ICU (PICU) and can be used as an outcome measure tool in clinical trials (3). Since each ICU serves a different patient population, a specific predictive model should be tailored for each hospital to certify the applicability of the model (4-6). Before applying a predictive model in a particular population, its external validity should be evaluated for the generalizability of the results (7).
Leteurtre et al. (8) in a prospective, multicenter, cohort study, developed the PELOD-2 by multivariable logistic regressions and bootstrap process. A total of 3671 consecutive patients, with the mean age of 15.5 months (interquartile range (IQR) = 2.2 - 70.7) were enrolled in their study. The discrimination (areas under the receiver operating characteristic curve (AUC) = 0.934) and the calibration (chi-square test for goodness-of-fit (GOF) = 9.31, P = 0.317) powers of the PELOD-2 score were reported as good.
De Leon et al. (9) assessed the association of the PRISM III score with the outcomes in infants admitted to PICU. A total of 170 infants who were consecutively admitted to PICU were enrolled in their prospective cohort study. With a sensitivity of 0.71 and a specificity of 0.64, the PRISM III was found as a mortality predictor.
To the best of authors’ knowledge, the performance of these predictive models varies and it is still questioned that which scoring model is better in predicting outcomes in critically ill children (10-12).
2. Objectives
It is suggested that regular recalibration of predictive models should be undertaken to provide a well-validated one (13). To the best of authors’ knowledge, no studies thus far assessed the predictive value of PRISM III, PIM3, and PELOD-2 in terms of the outcomes of critically ill children admitted to PICU. The current study aimed at comparing the predictive ability of these three models in medical/ surgical ICUs (MICU or SICU).
3. Methods
The current prospective, observational cohort study was conducted on 90 consecutive pediatric patients admitted to the mixed adults/pediatric university hospital ICUs (separated units) from July 2014 to October 2015. The inclusion criterion was age ≤ 18 years and exclusion criteria were less than 24 hours ICU length of stay (LOS) and diagnosis of brain death on admission.
To find the predictive value of PRISM III, PIM3, and PELOD-2 for mortality, logistic regression test was used. In a two-tailed hypothesis with a predetermined effect size of 0.50, a significant alpha of 0.05, and a statistical power of 0.80, the desired sample size was 76 (14); however, it was increased to 90.
Demographic data (i.e., age and gender) were collected and the PIM3 on admission, the PELOD-2 within the first 24 hours of admission, and the PRISM III during the first eight hours of admission were measured for each subject and recorded by well-trained and qualified nurse. The PRISM III was developed by Pollack et al. in 1996 as a reliable and objective predictive model with 17 physiological variables (1). The PIM3 score provides an international standard based on a big contemporary dataset to compare the risk-adjusted mortality rates among children admitted to ICUs; it consists of eight variables subdivided into 26 ranges (15). The PELODS-2 evaluates dysfunctions in six organs based on 12 variables. The scores were recorded daily and the most abnormal values were used to compute daily PELOD-2 score (5).
All data were recorded initially in a standardized data sheet for PRISM III, PIM3, and PELOD-2 and then, transferred to SPSS version 22 (IBM Corp., Released 2013, IBM SPSS Statistics for Windows, Armonk, NY). The PRISM III, PIM3, and PELOD-2 scores for each patient as well as the relationship between scores and patient's outcomes were assessed. The primary outcomes of the study were attributed to survivors and nonsurvivors. Patients’ information was published anonymous to maintain confidentiality of data. There was no intervention in the study.
Based on the inclusion criteria, the patients who died or diagnosed with brain dead 24 hours after admission were assigned to nonsurvivors group and the ones transferred from MICU or SICU to other wards of the hospitals were considered as survivors. In contrast to the criteria used in previous studies for PIM3, which included only the patients aged < 16 years, the current study included patients aged < 18 years. After encoding data with SPSS, the characteristics of the study population were summarized using simple descriptive statistics. The frequencies and percentages were used for categorical data; the means with standard deviations were used for continuous variables and then, the correlation between PRISM III, PIM3, and PELOD-2 scores, and patients’ outcomes was assessed using logistic regression. Since PRISM III, PIM3, and PELOD-2 scores were independent continuous variables, P value < 0.05 was considered significant. To evaluate the predictive value of the models, standard tests to measure discrimination and calibration powers were performed. The discrimination power of a predictive model reflects the power of distinguishing between survivors and nonsurvivors, which can be obtained by calculating the AUC. An AUC of 0.5 indicates a random chance (a diagonal line); AUC > 0.7 shows a moderate prognostic value, and > 0.8 (a bulbous curve) good prognostic model (16). To generate risk estimates in accordance with the observed outcomes at different classes of risk, model calibration should be assessed; in other words, calibration power of the model represents the agreement between individual probabilities and actual outcomes. Using the Hosmer-Lemeshow goodness of fit (GOF), P value > 0.05 indicates a well-calibrated model (17). Also, the STROBE checklist was used to guide the reporting of the study.
4. Results
Overall, 90 pediatric patients admitted to MICU or SICU were enrolled in the current study. The mean age of the subjects was 7.80 ± 4.43 years (ranged 2 - 18), of which 73.3% (n = 66) were male and 26.7% (n = 24) female. The overall mortality rate was 17.8% (15). The clinical and general characteristics of the study population are shown in Table 1.
| Characteristic | Total (N = 90) | Survivors (N = 74) | Nonsurvivors (N = 16) | P Value |
|---|---|---|---|---|
| Age, y | 7.80 ± 4.43 | 8.57 ± 4.29 | 4.25 ± 3.30 | < 0.001 |
| Medical | 50 | 48 | 2 | |
| Trauma and surgical | 32 | 23 | 9 | |
| Post-resuscitation care | 8 | 3 | 5 | |
| Gender | 0.87 | |||
| Male | 66 (73.33) | 54 (72.97) | 12 (30.77) | |
| Female | 24 (26.67) | 20 (27.03) | 4 (25.48) | |
| ICU length of stay, d | 3.65 ± 3.95 | 3.06 ± 2.25 | 6.38 ± 7.65 | 0.10 |
| PRISM III | 10.88 ± 5.13 | 10.01 ± 4.93 | 14.87 ± 4.11 | < 0.001 |
| PIM3 | 1.97 ± 1.30 | 1.67 ± 1.03 | 3.35 ± 1.55 | < 0.001 |
| PELOD-2 | 9.49 ± 3.65 | 8.81 ± 3.55 | 12.62 ± 2.25 | < 0.001 |
The Demographic and Clinical Characteristics of the Study Samplesa
For the entire cohort of patients, PRISM III, PIM3, and PELOD-2 scores were significantly different between the nonsurvivors and survivors. The survivors showed significantly lower values for all the three scores than nonsurvivors (P < 0.001, P < 0.001, and P < 0.001, respectively).
The model performance can be quantified with respect to calibration and discrimination. Calibration power, or reliability, refers to the degree of agreement between predicted probabilities and observed outcome frequencies. The discrimination power refers to the model ability to distinguish patients with different outcomes. The performance of the two models is compared in Table 2.
| Variable | Cutoff Point | Sensitivity, % | Specificity, % | Positive Predictive Value, % | Negative Predictive Value, % | Accuracy, % | AUC | SE | P Value |
|---|---|---|---|---|---|---|---|---|---|
| PRISM III | 11.5 | 81.3 | 59.5 | 30.23 | 93.62 | 63.33 | 0.773 | 0.060 | 0.001 |
| PIM3 | 2.71 | 68.8 | 87.8 | 55.00 | 92.86 | 84.44 | 0.824 | 0.055 | < 001 |
| PELOD-2 | 10.5 | 87.5 | 66.2 | 35.90 | 96.08 | 70.00 | 0.803 | 0.049 | < 001 |
Comparison of the Studied Predictive Models Between Survivors and Nonsurvivors
Analyzing the AUCs showed that the discrimination power of PIM3 and PELOD-2 was good (AUC = 0.824 and 0.803, respectively); this value for PRISM III was moderate. The Youden index (sensitivity + specificity -1) was used to calculate the optimal cutoff point for the three models. By a cutoff point 11.5, PRISM III predicted the mortality risk with a sensitivity of 81%, specificity of 60%, and accuracy of 63%; for PIM3, a cutoff point of 2.71 showed a sensitivity of 69%, specificity of 88%, and accuracy of 84%; for PELOD-2 with a cutoff point of 10.5, sensitivity was 88%, specificity 66%, and accuracy 70% (Table 2).
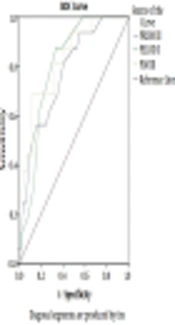
The Hosmer-Lemeshow chi-square test showed that the GOF of PRISM III, PIM3, and PELOD-2 were good (χ2 = 4.73, P = 0.79; χ2 = 3.09, P = 0.93; and χ2 = 5.01, P = 0.66, respectively). To access the predictive value of the three models, the ROC curve was drawn (Figure 1). To compare the discrimination power of the models, three AUCs were compared based on the model of DeLong et al. (18); the three predictive models had similar accuracies in predicting the prognosis of pediatric patients' outcomes. The discrimination power of PELOD-2 and PIM3 was good, but it was moderate for PRISM III. In terms of gender and ICU LOS, the survivors and nonsurvivors were homogeneous. The survivors were older than nonsurvivors and the difference was statistically significant (P < 0.001) (Table 1).

The ROC curves for pediatric risk of mortality III, pediatric index of mortality III, and pediatric logistic organ dysfunction II on the first 24 hours of admission at medical or surgical intensive care units. The AUCs respectively were 0.773, 0.824, and 0.803.
Under the logistic regression model, each point increase in the PRISM III score was accompanied by 1.25 times increase in the odds of mortality rate in ICU (odds ratio (OR): 1.251, 95% confidence interval (CI): 1.088 - 1.441; P = 0.002); also, each point increase in PIM3 and PELOD-2 scores were respectively associated with 2.86 and 1.41 times increase in the odds of mortality rate (OR: 2.859, 95% CI: 1.646 - 4.965; P < 0.001; OR: 1.412, 95% CI: 1.157 - 1.724; P = 0.001, respectively). The relationships between all the three scores and mortality rate were even unchanged after adjusting for age and gender; thus, these models were significant predictors for pediatric patients’ outcomes in the MICUs/SICUs.
5. Discussion
In the current study, the predictive ability of PRISM III, PIM3, and PELOD-2 models were evaluated in the MICUs/SICUs. The mean scores of PRISM III, PIM3, and PELOD-2 were significantly higher in nonsurvivors compared with survivors (P < 0.001, P < 0.001, and P < 0.001, respectively). Also, analysis of AUCs showed that both PIM3 and PELOD-2 were good at discriminating survivors and nonsurvivors (AUC = 0.824, P < 0.001 and AUC = 0.803, P < 0.001, respectively), and discrimination power of PRISM III was moderate (AUC = 0.773, P = 0.001). The Hosmer-Lemeshow chi-square test showed a good calibration for PRISM III, PIM3, and PELOD-2 scores (χ2 = 4.73, P = 0.79; χ2 = 3.08, P = 0.93; and χ2 = 5.01, P = 0.66, respectively). It indicated the good performance of these three scoring models in the pediatric population. Also, the survivors were significantly older than nonsurvivors (P < 0.001).
The optimal cutoff point based on the Youden index was 11.5, 2.71, and 10.5 for PRISM III, PIM3, and PELOD-2, respectively. The optimal cutoff point for PRISM III was 5.5, 7, 7.5, and 8 in four studies, with a sensitivity range of 68% - 83% and a specificity range of 82% - 87.5% (19-22). The cutoff point reported in other studies were lower than those of the current study, but the sensitivities and specificities were similar to those of the present study. The optimal cutoff point for PIM3 and PELOD-2 was not reported in other studies.
Findings of several studies were consistent with those of the current study indicating that lower scores of PRISM III, PIM3, and PELOD-2 were significantly associated with a higher mortality rate (23-26).
Inconsistent with the current study findings, several studies noted the good performance of the three predictive models in terms of discrimination and calibration power. Goncalves et al. (11) in a study compared PRISM III and PELOD-2 for the prediction of mortality in a PICU in a Portuguese population. A total of 556 patients consecutively admitted to PICU, with the mean age of 65 months (range: one month to 17 years), the male to female ratio of 1:5, and the median PICU LOS of three days were enrolled in their study. Both models had good discrimination; the AUC for the PRISM III was 0.92 and for the PELOD-2 was 0.94. The calibration power was good just for PRISM III (PRISM III: χ2 = 3.820, P = 0.282; PELOD-2: χ2 = 9.576, P = 0.022). Unlike the current study findings, they concluded that the PELOD-2 needs recalibration to be a more reliable predictor.
Straney et al. (15) in an international, multicenter, prospective cohort study evaluated the predictive ability of PIM3 for mortality risk among children admitted to an ICU. Sixty ICUs admitting pediatrics in Australia, New Zealand, Ireland, and the United Kingdom were selected. A total of 53,112 children, under 18 years old, admitted to ICU from 2010 to 2011 were enrolled in their study. Children who transferred to another ICU were not included. The PIM3 model discriminated well (AUC, 0.88, 0.88 - 0.89); however, the performance of the model in Australia and New Zealand was superior to those of the United Kingdom and Ireland (AUC 0.91, 95% CI: 0.90 - 0.93 and 0.85, 95% CI: 0.84 - 0.86, respectively).
In the current study, the age was a predictor of mortality as survivors were significantly older than nonsurvivors (P < 0.001). Unlike to the current study findings, the result of the retrospective study by Campbell et al. (23) on 83 children aged 1 to 18 years showed that the important predictors for mortality were the younger age at the time of injury, higher PRISM III score, and lower GCS score. The overall mortality rate in the present study was 17.8%, which was 3.9% and 28.7% in the studies by Wolfler et al. (27) and Qureshi et al. respectively (12).
By increasing the potential use of the scoring models through education, and standardization of assessments across different ICUs, and customizing an appropriate model, it is hoped that the role of predictive models is maintained in clinical practices and research in the future (28, 29). There are several limitations to the current study that should be addressed in further research: the first was the substantial influence of sample size on model calibration. The second was different contexts (case mix), quality of care, and policies that might cause bias. Ethical considerations were considered in the study.
5.1. Conclusions
The performance of the three predictive models was good. In terms of discrimination power, the performance of PIM3 and PELOD-2 was slightly better than that of the PRISM III. Further recalibration of predictive models in different contexts, multicenter studies, on larger sample sizes would enable the generalizability of the most validated ICU scoring systems.
