.jpg)


1. Background
Human resource management issues are an important strategy in the national primary care policy. The workforce planning process is looking for a balance between available health staff and what is really needed for health services (1, 2). Accordingly, planning is a systematic process for estimating the number of people and the skills needed to achieve the goals and prescriptive health policies in accordance with customers’ health needs. In addition, there should be attention paid to the safety of the people and health workers. This planning requires continuous control and supervision. For primary health care managers, employee planning is directly related to the national primary care policies that determine the minimum for health care workers (3, 4). The productivity of the staff is the most important concern of the managers of today's organizations and optimizing human resources is one of the most important ways to achieve sustainable development, especially in service-providing organizations (5, 6). Shortage of health workers in many developing countries is a serious threat to the quality of health services (7, 8). Definition of workload usually is not conceptually easy. On the other hand, the workload is a complex multidimensional proposition which is influenced by external, environmental, organizational and cognitive factors as well as the perceptual ability of individuals. The high workload, directly and indirectly, affects the quality of service delivery and the maintenance, displacement, and burnout of human resources (9). The attention of managers and policy makers to time management and human resources management along with attention to the quality of service delivery in comprehensive health centers can promote health indicators, increase the satisfaction of service recipients and service providers, and also improve the health behaviors of service recipients, thereby promote the health status of the community. With the implementation of the health transplant plan and also reforming the system for providing services throughout the network system (new health services) in urban areas, A set of cost-effective and priority services provided under the title of the first-level health services package as active service (10, 11). In this regard, increasing the organizational capacity by employing nutrition experts, mental health, environmental health, and occupational health in comprehensive health centers, increased the network system's scope in urban centers. Subsequently, with the completion of the services package for the first level and the change in the type and volume of services provided, as well as, changes in per capita health care workers (for each 3000, 2500 and 2000 people, one health care workers, consecutively) made it necessary to conduct an assessment of the health worker's workload at the urban Health posts.
2. Objectives
We conducted the present study to assess the workload of health care practitioners (Moraghebe Salamat) in urban Health posts of West Azarbaijan province (located in the north west of Iran) in 2017.
3. Methods
This study was a descriptive-analytic and cross-sectional study which was conducted in urban Health posts affiliated to Urmia University of Medical Sciences in 12 cities of the West Azarbaijan province in 2017. This study was conducted within 6 weeks (37 working days) between January 4 and February 12, 2017. A multi-stage sampling method was used for collecting the data. Thus, based on the Morgan formula, 280 practitioners (Moraghebe Salamat) were considered. With attention to the dispersed population coverage, Health posts were divided into equal quarters: first group with a population of 465 to 6314 people; the second group with a population of 6314 to 8800 people; third group with a population of 8800 to 10575 people and the fourth group with a population of 10575 to 16706 people. Then based on the initial distribution of Health posts at the provincial level and the number of Health posts needed in each quartile, we randomly selected the Health posts. Since there is an average of 4 practitioners per urban Health post, for 280 practitioners at least 70 Health post were selected as sample. The data collection tool was a checklist belonged to health care provider activities which it was developed based on a first-level care package in the form of age groups through an integrated health system. Practitioners completed the checklist by self-reported. This checklist designed to include information on Health post characteristics, the population was covered per practitioner, Suburb and or city resident t, attaching and non-attaching Health posts, first level service, age category, the time it takes to receive service the number of services provided. In addition to the mentioned checklist, the other tool used in this study was a timer which was installed on the computer belongs to each practitioner. In this way, the time of the delivery of services for referred people has recorded the checklist. For activities and interventions outside of Health posts such as visiting home, school education, school examinations, attending in educational classes, etc., the time spent on departure time and time to return to the Health post were calculated and recorded (11-13). In order to assess the validity of self-reported data, one observer was assigned for each of the 12 practitioners. These observers were expertise practitioners who were trained about the objective of the study and time studying. The training covered the data collection tools, how to use the stopwatch timer installed on the computer belongs to each practitioners and the tasks of the observer experts was explained. A similar educational briefing meeting was held for all practitioners those who were employed at a Health post in the selected cities. It was also assured to practitioners that the quality of services provided by them won’t be evaluated at all and the results are without mentioning the names of the individuals. Recorded data includes all activities and interventions for age groups (children, teenagers, youth, middle-aged and elderly) of the population covered by practitioners in Health posts during a work shift (7 hours and 30 minutes, excluding allowable unemployment) For a whole week (6 days) in 37 working days. All provided services by self-reported from the practitioners were recorded during the study. As well as to check the validity of data obtained through self-reporting from the health care providers, 103 people of them were randomly selected and the checklist was completed by the experts from the headquarters or coaches of the health education centers in parallel work sampling for 1 complete working day (7 hours and 30 minutes). Finally, after collecting data, data related to 61009 service recipients were evaluated. Since the number of incomplete checklists was low then the incomplete data was excluded After removing the data related to 1495 people, the remained data of 59514 people of service recipients has been entered to the SPSS software version 22 (Chicago, IL, USA) and analyzed by following standard statistical methods.
3.1. Statistical Method
Quantitative measurements were expressed as the mean and standard deviation. Qualitative variables were presented as absolute frequency and percentage. In order to check the consistency of two self-reporting and the work sample methods, the t-test used to assess the difference between the means of two methods. To calculate the average time spent for each service group, the total amount of time spent on interventions and care activities in each service group, divided by the number of days in the study, to achieve the average time taken by each practitioner to each service group. Then, the average time allocated by each health care provider was added with the average time allocated by other of them and divided it on a total number of health care provider to obtain the average time allocated to each service group. Also for practitioners7 hours and 30 minutes (7:30 a.m. to 15:00 p.m.) was considered as time on their duty. Then, in order to calculate the total hours of the practitioners in the study days, the number of hours that each of them had worked was estimated by a person-day. Finally, the total time of the provision of health care services for a health care provider in the days of study was divided by the total time and its percentage was calculated.
4. Results
Totally, 280 female practitioners who worked in 70 urban Health posts participated in this study.
Finding in Table 1 showed that of the 59,514 referred people to the selected urban Health posts within 6 weeks of work, the highest frequency was in the group of children with 16193 people (27.2%) and the lowest frequency was in the elderly group with 1754 people (2.9%). The maximum time spent on children was 4994 hours and 29 minutes (29.9%) and the minimum time spent for the elderly group was 404 hours and 07 minutes (2.4%).
| Service Groups | Individuals Referred to Urban Health Posts | Duration Time Spent for Each Service Group |
|---|---|---|
| Children care | 16193 (27.2) | 4994:29 (29.9) |
| Teenager care | 6109 (10.3) | 1778:45 (10.6) |
| Youth care | 4820 (8.1) | 1296:25 (7.8) |
| Middle age care | 12744 (21.4) | 3145:48 (18.8) |
| Elderly care | 1754 (2.9) | 404:07 (2.4) |
| pregnant mothers care | 10096 (17.0) | 3190:44 (19.1) |
| Reproductive health care | 6056 (10.2) | 1128:48 (6.7) |
| Others | 1742 (2.9) | 786:55 (4.7) |
| Total | 59514 (100.0) | 16726:04 (100.0) |
Frequency of Service Recipients Based on Service Groups Referring to The Urban Health Posts of West Azarbaijan Province in 2017 (Work-Sample of Supervisors)a
Frequency of service recipients based on service groups has been presented in Table 2. The most frequent number of referred individuals with a total of 393 (27.8%) were in the group of children. The lowest frequency of 43 (3%) belonged to the other group, Also, the maximum time spent on the group of children was 110 hours and 49 minutes (31.1%) and the minimum time spent for the other group was 7 hours 45 minutes and 26 seconds (2.2%).
| Service groups | Individuals Referred to Urban Health Posts | Duration Time Spent for Each Service Group |
|---|---|---|
| Children care | 393 (27.8) | 110:49 (31.1) |
| Teenager care | 121 (8.6) | 40:14:15 (11.3) |
| Youth care | 82 (5.8) | 18:50:04 (5.3) |
| Middle age care | 311 (22.0) | 73:47:51 (20.7) |
| Elderly care | 51 (3.6) | 11:22:35 (3.2) |
| pregnant mothers care | 241 (17.0) | 67:50:38 (19.1) |
| Reproductive health care | 173 (12.2) | 25:08:33 (7.1) |
| Others | 43 (3.0) | 7:45:26 (2.2) |
| Total | 1415 (100.0) | 355:48 (100.0) |
Frequency of Service Recipients Based on Service Groups Referring to the Urban Health Posts of West Azarbaijan Province in 2017 (Self-Reported by Health Care Providers)a
Table 3 shows that the total time of providing services by health care providers during the study, was 16,726 hours, 4 minutes, and 11 seconds. The average duration of providing services in the target groups was 16.51 ± 13.14 (16 minutes and 51 seconds with a standard deviation of 13.14). The maximum time spent for providing services was related to the other group (communicable diseases and care outside the health posts) with 7 hours. The minimum time spent on providing services was 1 minute for all target groups. This result illustrates that health care providers spent an average of 16.51 minutes to carrying out routine care of target groups based on the electronic health records and data recordings of the integrated health system.
| Service Groups | Frequency of Referred People | Total of Time Spent (h) | Average Time Spent | Median of Time Spent | Minimum | Maximum | SD | SE |
|---|---|---|---|---|---|---|---|---|
| Children care | 16193 | 4994:29 | 0:18:30 | 0:17:00 | 0:01:00 | 2:05:00 | 0:09:42 | 0:00:04 |
| Teenager care | 6109 | 1778:45 | 0:17:28 | 0:15:00 | 0:01:00 | 1:30:00 | 0:19:49 | 0:00:15 |
| Youth care | 4820 | 1296:25 | 0:16:08 | 0:15:00 | 0:01:00 | 2:00:00 | 0:10:05 | 0:00:08 |
| Middle age care | 12744 | 3145:48 | 0:14:48 | 0:13:00 | 0:01:00 | 2:23:00 | 0:09:52 | 0:00:05 |
| Elderly care | 1754 | 404:07 | 0:13:49 | 0:12:00 | 0:01:00 | 1:10:00 | 0:09:01 | 0:00:12 |
| Pregnant mothers care | 10096 | 3190:44 | 0:18:57 | 0:17:00 | 0:01:00 | 1:40:00 | 0:11:17 | 0:00:06 |
| Reproductive health care | 6056 | 1128:48 | 0:11:11 | 0:10:00 | 0:01:00 | 1:10:00 | 0:07:45 | 0:00:05 |
| Others | 1742 | 786:55 | 0:27:06 | 0:12:00 | 0:01:00 | 7:00:03 | 0:37:32 | 0:00:53 |
| Total | 59514 | 16726:04 | 0:16:51 | 0:15:00 | 0:01:00 | 7:00:03 | 0:13:14 | 0:00:03 |
Duration of Provided Services on The Basis of Service Groups in People Referring to the Urban Health Posts of the West Azerbaijan Province in 2017(Self-Reported by Health Care Providers)
To determine the validity of self-declaration method, the mean of the obtained parameters was compared to another independent sample of observers (Tables 2 and 4). Using this test, there was no statistically significant difference between the two groups. Data about the average time spent on care and workload for health care providers has been close to reality. This method is one of the strengths of this study.
| Age Group | Frequency of Referred People | Total of Time Spent (h) | Average Time Spent | Median of Time Spent | Minimum | Maximum | SD | SE |
|---|---|---|---|---|---|---|---|---|
| Children care | 393 | 110:49 | 0:16:55 | 0:15:00 | 0:01:00 | 1:00:00 | 0:09:25 | 0:00:28 |
| Teenager care | 121 | 40:14:15 | 0:19:57 | 0:16:44 | 0:01:00 | 3:00:00 | 0:19:01 | 0:01:43 |
| Youth care | 82 | 18:50:04 | 0:13:46 | 0:12:30 | 0:01:00 | 0:40:00 | 0:09:03 | 0:01:00 |
| Middle age care | 311 | 73:47:51 | 0:14:14 | 0:13:00 | 0:01:00 | 0:59:00 | 0:10:01 | 0:00:34 |
| Elderly care | 51 | 11:22:35 | 0:13:23 | 0:10:00 | 0:02:00 | 0:41:00 | 0:08:47 | 0:01:13 |
| pregnant mothers care | 241 | 67:50:38 | 0:16:53 | 0:14:50 | 0:01:00 | 1:00:00 | 0:11:52 | 0:00:45 |
| Reproductive health care | 173 | 25:08:33 | 0:08:43 | 0:07:00 | 0:01:00 | 1:00:00 | 0:07:42 | 0:00:35 |
| Others | 43 | 7:45:26 | 0:10:49 | 0:08:53 | 0:01:12 | 0:45:00 | 0:09:34 | 0:01:27 |
| Total | 1415 | 355:48 | 0:15:05 | 0:13:15 | 0:01:00 | 3:00:00 | 0:11:19 | 0:00:18 |
Duration of Provided Services on The Basis of Service Groups in People Referring to the Urban Health Posts of the West Azerbaijan Province in 2017 (Work-Sample of Supervisors)
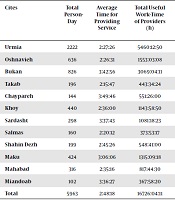
In Table 5 we showed the comparison of Time for providing service, 2017 (Self-reported by health care providers). During the course of this study, a total of 369,389 services were provided over a 37-day working day for 59,514 people at urban Health posts. The total time taken to provide this service was 16,726 hours, 4 minutes, and 11 seconds. In the 37 days of work, health care providers had 5,963 person-day activities. The total time for providing health service was 6726 hours, 4 minutes, and 11 seconds and according to the obtained results, each health care provider worked on average 2 hours 48 minutes 18 seconds per day which to calculate the total hours specified for all health care providers the following was done:
A total hour-work specified in 6 hours: 5963 person-days × 6 hours = 35778
A total hour-work specified in 30 minutes: 5963 person-days × 30 minutes = 178890 ÷ 60 = 2981.5
A total hour-work specified in 6 hours and 30 minutes was: 35778 + 2981.5 = 38759.5 hours
Total useful hours-work provided in 6 hours and 30 minutes: 16726 = 43% (percentage of work load for health care providers with allowance for one hour’s unemployment). According to the results, each health care provider worked an average of 2 hours 48 minutes 18 seconds per day that with considering only 1 hour of allowed unemployment, only they worked 43% of the total time which specified for their work and remain wasted (57%). All of the selected health care bases in the determined cities by taking into account an hour for allowable unemployment 33.33% of them had a working load above 50% and 67.66% had a working load below 50%.
| Cites | Total Person-Day | Average Time for Providing Service | Total Useful Work-Time of Providers (h) | Total Standard Time Without an Hour of Allowable Unemployment (h) | Total Standard Time with an Hour of Allowable Unemployment (h) | Percentage of the Average Workload Without an Hour of Allowable Unemployment | Percentage of the Average Workload with an Hour of Allowable Unemployment |
|---|---|---|---|---|---|---|---|
| Urmia | 2222 | 2:27:26 | 5460:12:50 | 16665:00:00 | 14443:00:00 | 31.0 | 35.7 |
| Oshnavieh | 636 | 2:26:31 | 1553:03:08 | 4770:00:00 | 4134:00:00 | 35.4 | 40.8 |
| Bukan | 826 | 3:42:56 | 3069:04:11 | 6195:00:00 | 5369:00:00 | 48.9 | 56.4 |
| Takab | 196 | 2:15:47 | 443:34:24 | 1470:00:00 | 1274:00:00 | 29.9 | 34.5 |
| Chaypareh | 144 | 3:49:46 | 551:26:00 | 1080:00:00 | 936:00:00 | 51.1 | 58.9 |
| Khoy | 440 | 2:36:00 | 1143:58:50 | 3300:00:00 | 2860:00:00 | 35.7 | 41.2 |
| Sardasht | 298 | 3:37:43 | 1081:18:23 | 2235:00:00 | 1937:00:00 | 47.7 | 55.0 |
| Salmas | 160 | 2:20:12 | 373:53:17 | 1200:00:00 | 1040:00:00 | 35.2 | 40.7 |
| Shahin Dezh | 199 | 2:45:26 | 548:41:00 | 1492:30:00 | 1293:30:00 | 36.6 | 42.2 |
| Maku | 424 | 3:06:06 | 1315:09:18 | 3180:00:00 | 2756:00:00 | 38.8 | 44.8 |
| Mahabad | 316 | 2:35:16 | 817:44:30 | 2370:00:00 | 2054:00:00 | 35.6 | 41.1 |
| Miandoab | 102 | 3:36:27 | 367:58:20 | 765:00:00 | 663:00:00 | 48.1 | 55.5 |
| Total | 5963 | 2:48:18 | 16726:04:11 | 44722:30:00 | 38759:30:00 | 37.1 | 42.8 |
Comparison of Time for Providing Service by Health Care Provider at Urban Health Posts in West Azarbaijan, 2017 (Self-Reported by Health Care Providers).
5. Discussion
This study is a novel to determine the workload of practitioners in urban Health posts and its importance as one of the most effective factors is in policy planning of the health system reform plan. Based on the findings, the average time that health care providers spend on interventions and associated activities at health posts (2 hours 48 minutes 18 seconds) are much less than the total daily duty hours (6 hours and 30 minutes with an hour’s deduction for allowable unemployment). That is, health care providers only spent 43% of their time on their duty, and 57% of their time spent on other non-duty affairs.
In a study conducted by Mæstad et al. in rural Tanzanian health centers, Health workers have less than 2 hours of their average care time for patients per day and they in line with our finding concluded that health care workers have a lot of inefficient time (7). Parvareh et al. (14) for the assessment of the timing on a working day related to 64 health workers from 30 health houses in Saqez city. They concluded that on average of 157.5 minutes would be spent on for doing their activities which include only 33% of the total daily working time (480 minutes). This result was consistent with our finding in the present study.
In the study of Fakhri and Rajabi (15) in measuring midwife workloads at a Health post with a standard population in Kashan city, the results showed that if the midwife provides only specialized services, his work volume accounts for only 3.5% of the total volume of family health services in a Health post with a population of 12500 people. If a midwife intended to provide the mothers' health service in addition to her specialized services, it will reach to 24 percent. In the study of Hoonakker et al. (9) in intensive care units, the overall workload of nurses was 71.4%. Also, in the study of Roohi et al. (16). On the nurses who had worked in the Internal Department of Gorgan Hospital, nurses’ workload was 62%. In the study of Mazloumi et al. (17) on the assembling line of the automobile industry, the workload of workers was 86.98%. In Zakerian et al. (18) research on the relationship between workload and quality of life in hospital personnel, the workload was 69.7%. The reason for differences in the workload of nurses and health care providers is due to differences in basic health care packages. On the other hand, provided care service by health care providers was more of an outpatient nature and had not an emergency status. Furthermore, in the health system, the payment system is more likely to reduce the incentive for the service provider to provide additional services. Therefore, both sides of supply and demand have little motivation for receiving and providing health services. The results of this study showed that the most reason for referring to Health posts was caring for children with 2 until 59 months were due to the population ratio of the group under 5 years old (10% of the total population in Iran based on the last census) and the high volume of routine care in the age group under 5 years old (14 times per one year). Also, the reason for the slowness of the other group is because of the low number of services performed in them such as recording and following the communicable diseases, education in schools and home, active following at home and etc. The reason for the low number of patients in the age group of elderly can also be due to the low demographic distribution of the elderly group(8.5% of the total population based on the last census in Iran) among total population and getting more specialized services in them from the private sectors (Table 1). According to the results of present study, health care providers appear to be idle for more time, although a similar study on this issue in health centers is not available for comparison, but based on the researcher view in this study, the reasons for the low workload of health care can be due to the followings:
• New implementation of health reform plan in urban areas
• Lack of demand for services in healthy people due to the lack of emergency need for preventive services, care, and screening
• Lack of awareness on the provision of new health services, such as screening services, nutrition counseling, mental health counseling in health centers
• Lack of an effective referral system in the health system and the possibility of getting direct services from the private sectors
• There is no standardized way for hiring practitioners based on the workload
• The low motivation for health care providers to provide more services due to the type of payment system (salary)
• Failure to conducting the active care of the covered population
• Lack of attention to human characteristics (19, 20)
It seems that with the implementation of the plan for the development and modernization of the service delivery system (modern health services), many changes have been made to the existing status of the providing the health services. Therefore, it is necessary that health policymakers, in addition to justifying the health care provider of the health care base for their demands, use policies to increase awareness and maintain the freedom to provide services and on the supply side of incentive schemes. These services are effective and their use can prevent future treatment costs.
Due to the low workload of health care providers, it appears that despite the improvements made to the system of providing health service, in terms of time spent working in the work environment, the conditions are unfavorable on the health posts. Tow potential reason for this status is (1) lack of need assessment for health workers, and (2) the neglecting awareness-raising policies, the maintenance of free care services and motivation schemes for all health care provider behind of managers and health policymakers.
