1. Background
In recent years, solid waste management has been one of the most challenging environmental issues in the field of urban management in Iran (1). According to the World Health Organization, one of the most important problems facing urban, rural, and industrial development is proper solid waste disposal (2). The increased demand and expansion of urbanization, especially in developing countries, and increased public awareness of health and environmental issues have led urban waste management officials and planners to design and implement optimal waste management practices based on a sustainable development approach and take a holistic approach to organize social, economic, and environmental issues (3). Designing and implementing an integrated and sustainable waste management system requires careful investigation of waste characterization in the region, including production source, quality and quantity, production rate, as well as city characteristics such as existing infrastructure, economic potential, weather conditions, urban roads, and the culture and lifestyle of the people living there (4). Waste composition can be considered as the most important factor in choosing a waste management method (5). Identifying waste composition consistently leads to the proper development of waste management plans and projects (3). Collection, transportation, and disposal of municipal waste have created many problems and challenges for cities, as these processes usually waste 30 to 50 percent of the operating budget of municipalities. In addition to the high cost of these processes, in many cities, less than half of the production waste is collected. In Karachi, a city in India, for example, waste collection is close to 33% (6). The rate of waste production and composition, including perishable materials, paper and cardboard, plastics, textiles, metals, glass and wood, depends on several factors, which are different in different regions, and that is why wastes quantity and quality are different. Factors such as geographical location, season, collection frequency, economic and social status of people, and customs are effective in the quantity and quality of waste production (7, 8). Having complete information about the physical and chemical composition of waste and production rate is inevitable and necessary for the development and implementation of dynamic waste management approaches (9). Kermanshah School of Health, with a total area of 55,000 square meters, with several office buildings, laboratories, parking and self-service, produces a significant amount of waste materials, including food waste, plastic, paper, cardboard, etc. daily. The generated solid waste is collected and disposed of without any recycling program or segregation at the source. An increase in the number of students, staff, and personnel, as well as the increase in workload, increase the amount of daily waste generated, which in turn increases management costs. As a result, predicting the amount of solid waste generated, as well as determining the waste composition and per capita production can provide sufficient and accurate information to make management decisions such as recycling programs and save waste management costs.
2. Objectives
The objective of this study was to determine the quantity of each component in the waste generated in Kermanshah School of Health, and then discuss the challenges facing the officials based on the findings. The study has some suggestions for the officials involved in solid waste management in this area, to be able to make appropriate decisions regarding waste management in the faculty, which is produced in large volumes and levels and contains different components.
3. Methods
3.1. Area of Study
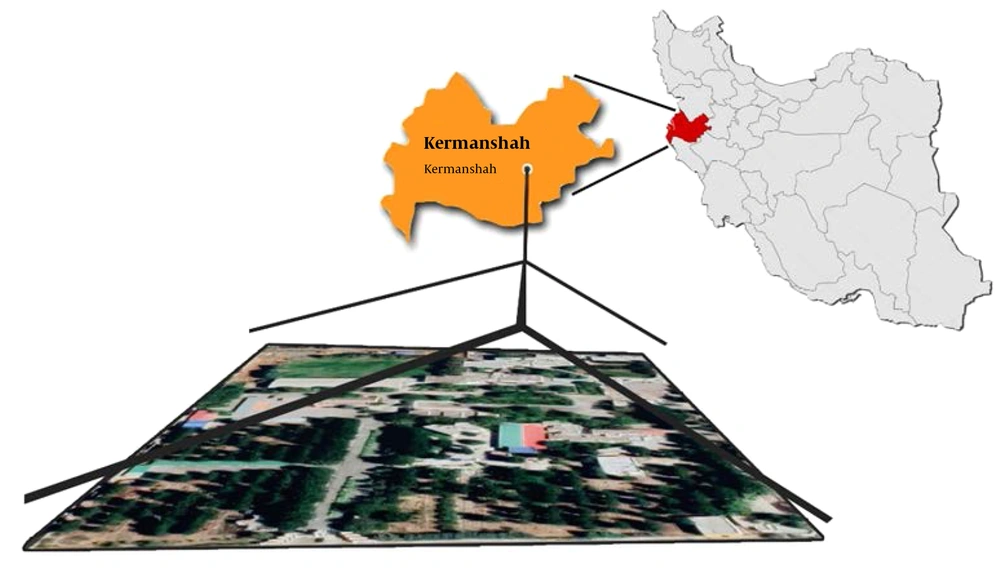
Depending on the region, activities performed, lifestyle, and climatic conditions, the quantity and quality of waste composition vary (10). The Faculty of Health, with an area of 55,000 square meters, and an infrastructure of 6,400 square meters, two hectares of green space, and 1,700 square meters of parking space, is located in the eastern part of Kermanshah (Figure 1). Also, according to official statistics, it included 330 students, staff, and professors.
3.2. Analysis Method
This cross-sectional study was conducted during the fall of 2019 in the Faculty of Health located in Kermanshah University of Medical Sciences and Health Services. For the physical separation part of the study and analysis, production waste was collected daily during a working week from Saturday to Wednesday, in six groups including food, paper, plastic, glass, metal and garden wastes (wood, branches and leaves of trees), using a physical separation method, and then the average and per capita per day waste generated were calculated and weighed. Self-service waste, which often contained food and plastic waste of beverages and side dishes, was transported by wheelbarrow to the waste weighing site near the waste laboratory. There was a flat table for physical separation operations, made of steel with an approximate area of 24 square meters, and the physical separation of waste was done on the table after emptying the waste. The waste of office buildings, laboratories, toilets, parking lots and waste bins at the campus were also collected and then each component was separated by some students and each component was weighed on a container scale, and the weight was recorded. To measure the weight of waste, a calibrated «Sun Sun» digital scale, «2003D» model with a capacity and accuracy of 180 kilograms and 100 grams respectively, and six plastic containers with a volume of 0.8 cubic meters were used to weigh the waste. The containers were placed at the bottom of the separation table. Also, after weighing the plastic containers containing separated waste on the scale, the weight of each empty plastic container was subtracted from the obtained weight. This method of separation and weighing was previously performed by Zazouli et al., in a similar study at Mazandaran University of Medical Sciences (11).
Personal protective equipment such as masks, gloves, and a cape were also used to prevent contamination during collection and weighing. Finally, the average amount, amount per capita, tables, and charts were calculated and analyzed in Excel software version 2019.
4. Results
Based on the findings of waste segregation and weighing at Kermanshah School of Health, which is shown in Table 1 approximately 34.5 kilograms of waste is produced daily in the school, which is the average amount of the waste produced daily from Saturday to Wednesday. The total waste generated per capita was 104.29 grams per person, which is almost constant due to slight changes in the waste-producing population in the faculty.
| Type (gr) | Saturday | Sunday | Monday | Tuesday | Wednesday | Average | Per Capita |
|---|---|---|---|---|---|---|---|
| Food waste | 22000 | 15000 | 12300 | 18000 | 14300 | 16320 | 49.45 |
| Paper and cardboard waste | 4500 | 6500 | 3800 | 5000 | 4650 | 4890 | 14.82 |
| Plastic waste | 13600 | 13400 | 11000 | 9000 | 8000 | 11000 | 33.33 |
| Glass waste | 0 | 200 | 50 | 0 | 130 | 76 | 0.23 |
| Metal waste | 40 | 0 | 100 | 86 | 50 | 55 | 0.17 |
| Garden waste | 1300 | 880 | 1200 | 1400 | 5600 | 2076 | 6.29 |
| Total | 41440 | 35980 | 28450 | 33486 | 32730 | 34417 | 104.29 |
| 41.44 kg | 35.98 kg | 28.45 kg | 33.49 kg | 32.73 kg | 34.42 kg | 0.10 kg |
Waste Generation of Separated Components, Total, Average and Per Capita
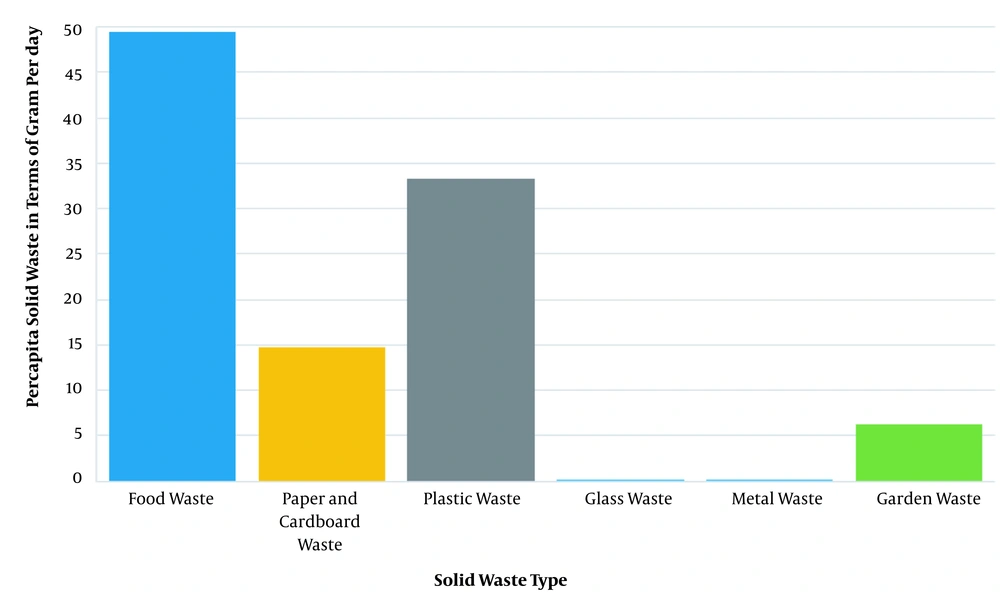
According to Figure 2, the most solid waste generated per capita belonged to food waste with 49.45 grams per day per person, followed by plastic waste with 33.33 grams per day, paper and cardboard waste with 14.82 grams per day, garden waste with 6.29 grams per day, glass waste with 0.23 grams per day, and metal waste with 0.17 grams per day. Table 1 shows that the highest amount of waste was generated during Saturday, because of an increase in administrative and educational activities and an increase in the number of students present in the faculty on Saturday.
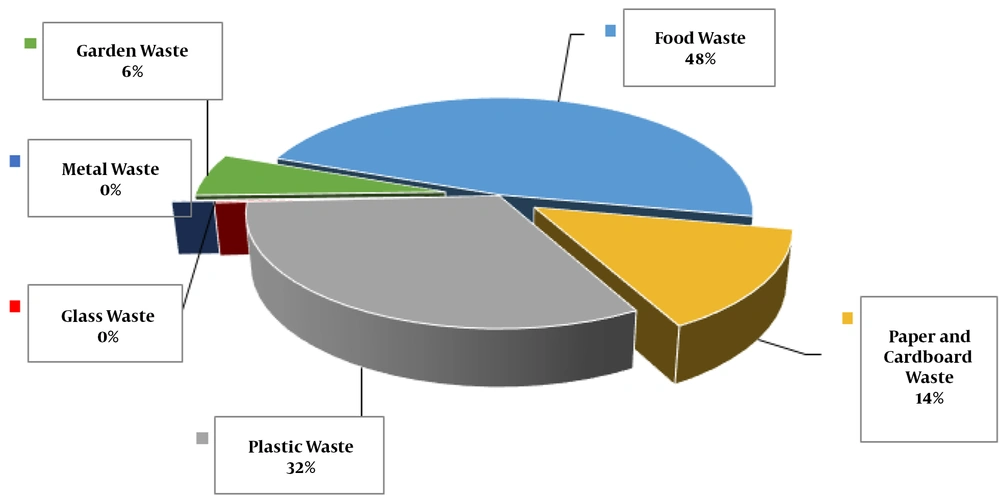
According to Figure 3 and Table 1, the highest amount of waste generated belonged to food waste with a weight of 16.32 kilograms per day, accounting for 48% of total waste, followed by plastic waste, 32%, paper and cardboard 14%, garden waste 6%, glass and metal waste each close to 0%, respectively. In general, 54% (48% food waste + 6% garden waste) of the generated waste was wet materials and the remaining 46% was dry materials, requiring high potential conditions for the implementation of the separation process at the source in the faculty, Figure 3.
5. Discussion
Determining and recognizing the waste composition can be considered as the first essential step for development planning in a region (12). In the Faculty of Health, perishable materials, including food and garden waste, account for the highest amount of waste and metals for the lowest. Therefore, it is consistent with the study of Zazouli et al. (11), which was conducted with the aim of quantifying and evaluating waste recycling at Mazandaran University of Medical Sciences, and most of the waste included perishable materials. Another study by Masoumbeigi et al. (13), which was conducted on waste management in a military university, revealed that food waste accounts for 40.15% of the waste produced.
Paper, cardboard, and plastics account for about 46% of the generated waste, and the amount of waste paper per week was 24,450kg, which is about 14% of the total waste produced in the Faculty and the average was 14.82 grams per day, which corresponds to the amount obtained in the study conducted at the military university (13). Based on a study conducted by Zazouli et al., about the potential of waste paper production in administrative departments in 2007, the per capita production of each employee in the central building of Mazandaran University of Medical Sciences was 400 grams per day (14). While according to this study, waste paper production was reduced to 14 grams per day, probably due to the use of an office automation system. Paper recycling programs are one of the simplest programs available in all universities in the world, which can be successfully done in developing countries. At Rhodes University in South Africa, for example, with the planning and awareness-raising of students and staff, 80% of used paper is recycled and returned to the consumption cycle (15).
Plastics and rubbers are synthetic polymers, and their proper recycling plays a very important role in protecting the environment. The main sources of plastics are self-service, laboratories, and office departments. The amount of plastic produced during a week is equal to 55 kg and per capita, waste production is equal to 33 grams per day and accounts for 32% of the total daily waste generated in the college. In a study conducted at the Liberal Arts Institution in the United States, the amount of plastic was estimated to be about 8 to 10% (16).
It is evident from Table 1 that on Saturday, compared to other days of the week, the highest amount of food and plastic waste was produced, which may be related to the type and composition of food served that day. Irrespective of the type of food ingredients and the number of people eating food on a particular day, it can be said that on Monday, probably due to the better food served by students, less waste and food waste were produced. And then, the foods served on Wednesdays, Sundays, Tuesdays, and Saturdays were more acceptable, respectively.
Continuous awareness of the quantity and quality of waste is the first and most important step for the successful implementation of solid waste management programs (17). In other words, knowing the quantity and waste composition is essential for evaluating and selecting equipment, designing waste system programs, achieving environmental goals, and guiding waste management plans for the sustainable development of the country (18).
The type of food, its ingredients, and the degree of its acceptance by consumers can have a significant impact on the amount of food waste generated. Side dishes, including beverages and desserts, are also influential in the production of plastic waste because the packaging is often made of plastic. However, plastic waste accounts for a small percentage in places other than self-service, such as laboratories, libraries, classrooms, and other educational facilities. Large volumes of disposable plastic containers are produced in student self-service centers, which, if not recycled, pose a serious threat to environmental pollution and create collection and disposal problems.
Due to the large amounts of organic waste in the waste compositions at the faculty, an energy production system may be economically useful. The waste incinerator is the best system for generating energy from waste, but the process of incineration due to the production of toxic gases and greenhouses demands high control and maintenance costs (11).
Today, due to the population growth and an increase in industrial and commercial activities, the need for proper and sustainable management of municipal waste systems is felt more than ever (19). At the same time, increasing awareness of environmental issues is necessary to provide practical suggestions and implement and develop waste management plans in the country (20). An integrated and comprehensive view of waste flow, collection, and disposal methods and investigating all the factors affecting it is necessary (7). In the School of Public Health, solid waste segregation is not done as desired by waste management experts. Implementing a recycling program requires the separation of waste and, consequently, practical training of students, staff, and officials about the proper collection of waste and understanding the quantity and quality of waste, which increases the participation of students and staff in separating different solid waste compositions and assists urban management services, reduces government operations, and reduces the faculty costs and responsibilities.
The presence of paper, cardboard, and plastic in the mentioned quantities warns us about the programs of recycling and separation from the source. Considering the predominant percentage of organic matter in the waste composition at Kermanshah School of Health, the use of compost production methods seems to be a justifiable and economical method for disposal of organic waste in the school. Making use of the compost production plants in the private sector due to the large space available in the faculty helps the processes of collecting and separating organic materials, improving the waste management situation. In addition, it can be effective in creating jobs, buying goods and foodstuffs as needed, improving food quality, cooking highly acceptable foods, reducing the use of disposable goods, buying and using durable goods, as all can make a significant contribution to reducing production waste and thus reducing waste management costs. Focusing on academic waste recycling programs, besides the economic and environmental dimension, is important in terms of creating a sense of responsibility and modifying the consumption patterns in students, creating a positive attitude towards waste use, and motivating segregation, production, and environmental cleaning.
5.1. Conclusion
Given that the main content of solid waste is perishable materials and the small amount of glass and metal waste in the composition of waste produced by the school, the best alternative for solid waste generated from Kermanshah Public Health School is to turn it into compost. Also, better management in the preparation and distribution of food and cooking more popular foods, buying durable goods, and educating and improving the culture of source separation, can be the main strategies for proper waste management in Kermanshah School of Public Health and similar educational centers.


