


1. Background
Every year, universities accept new and graduate students, so in this continuous cycle, paying attention to the quality of education is essential. Therefore, increasing the quality of the educational system is considered the most influential factor in developing countries (1). Successful students reach a position where they use their internal and external forces to achieve higher education goals and obtain the necessary conditions for a successful social life (2).
Lack of success in education causes many personal and social problems and deviation from achieving the goals of the educational system (3). Academic failure (AF) wastes time and costs and causes mental-psychological, family, and social problems for students (4).
According to previous studies, AF is increasing yearly, and many students cannot cope with the written educational content (university courses) or finish them on time (5). The UNESCO organization reported the factors of AF, including repetition of the primary, early school leaving, and a decrease in the educational quality of students (6). According to previous research, about 12% of students of medical sciences universities in Iran are rejected at least one academic semester during their studies. Being rejected academically causes mental-psychological issues, education deprivation, disrupted use of scientific principles for training human resources, wasted financial resources, and social dissatisfaction (7).
AF of students and their dropout creates problems for the students themselves and causes many losses for the country (8). In addition, AF or dropping out of university can lead to other negative behaviors for students (9). Previous research have shown that students with AF use drugs at an older age, and AF and dropping out of school can have negative consequences, including drug and alcohol addiction (10-12). Research on people who committed suicide in one of the American universities showed that the most common reason for suicide was a failure in education (13).
As Iran's education system is based on national income, AF can impose a significant financial burden on society. From a social point of view, the low academic performance of the student can lead to the production of inefficient expert staff and ultimately lower quality services and a lack of welfare for the people. From an individual point of view, the phenomenon of AF causes problems, including economic failure, inappropriate communication, and decreases self-confidence for students (13-16).
2. Objectives
Considering the importance of investigating the AF rate in medical students and determining the role of factors affecting it, this study aimed to evaluate the AF rate of medical students and the factors affecting it in a military medical training center.
3. Methods
The present study was conducted as a cross-sectional analytical study in 2022. A standard educational failure questionnaire with closed questions with a five-point Likert scale (between 1 and 5 points) was used to collect data. The questionnaire was designed in a semi-structured form, including both open and closed questions. The questionnaire also included a line for students to provide qualitative comments in the form of open responses. The sampling method was a census, and 184 medical students with 5 - 8 years of academic experience were selected from the educational center.
The questionnaire mentioned above was already used in Changizy Ashtyani et al. The validity was obtained by the content validity method, and the reliability is achieved by Cronbach’s alpha method (0.8) (17). This questionnaire had four general areas, including (1) demographic information, (2) intra-university factors, (3) extra-university factors, and (4) background and additional information. Basic and demographic information included factors such as the age of entering the university, gender, marital status, diploma average, national entrance exam ranking, national entrance examination level, year of entering the university, father’s education level, and mother’s education level. The intra-university factors included the ten elements of education (curriculum ideology, goals, content, teaching method, evaluation, grouping, learning activities, resources, place, and time). Extra-academic factors included housing problems, economic problems, family problems, individual problems, and community problems. The background and additional information included the presence in the virtual space, the amount of daily study, the student's employment status, the overall grade point average of basic sciences, and the number of academic probations.
The collected data were recorded in SPSS software Version 22. Then, the mean and standard deviation indices for quantitative variables and the frequency index for qualitative variables were presented. The relationship of qualitative independent variables was investigated with AF by chi-square and Fisher’s exact tests. The relationship of quantitative variables with AF was performed by one-way analysis of variance (ANOVA). Logistic regression was used to evaluate the simultaneous association of independent variables with AF. All the aforementioned statistical tests were used at a significance level of α = 0.05.
4. Results
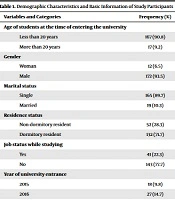
The results showed that out of 184 people evaluated in this study, 138 (75%) had AF. The age of the participants at the time of entering the university was divided into two categories, including less than 20 years (90.8%) and more than 20 years (9.2%). The frequency of studied students based on male and female gender was 93.5 and 6.5%, respectively. Table 1 presents other demographic information of evaluated students as well as their academic characteristics. Based on the results, AF had a significant relationship with some variables, including marital status (P = 0.04), place of residence (P = 0.05), and year of entering university (P = 0.01). At the same time, there was not a significant relationship between AF and father’s education (P = 0.99), mother’s education (P = 0.77), gender (P = 0.185), and students’ age at the time of entering the university (P = 0.58) (Table 2). Based on educational factors, AF had no significant relationship with the amount of daily presence in the virtual space (P = 0.3). While the significant relationship was observed between AF with basic science grade point average (GPA) (P = 0.02), content (P = 0.04), amount of daily study (P = 0.01), diploma grade GPA (P = 0.01), university entrance exam score (P = 0.001) and the national rank of the university entrance exam (P = 0.02) (Table 3). The results showed a relationship between AF and all university factors, including ideology (P = 0.98), goal (P = 0.53), teaching method (P = 0.27), evaluation (P = 0.22), learning activities (P = 0.72), sources (P = 0.77), place (P = 0.2) and time (P = 0.34) had no significant relationship (Table 4). Based on external and internal factors, AF had a significant relationship with family problems (P = 0.03), while there was no significant relationship between AF and economic (P = 0.94), housing (P = 0.28), personal (P = 0.22) and community (P = 0.82) problems (Table 5). Table 6 presents the results of multiple logistic regression to determine whether various variables were associated with AF among medical students with at least one conditional academic semester. In contrast, the results for students with a grade point average of 12 to 15 are shown in Table 7.
| Variables and Categories | No. (%) |
|---|---|
| Age of students at the time of entering the university | |
| Less than 20 years | 167 (90.8) |
| More than 20 years | 17 (9.2) |
| Gender | |
| Woman | 12 (6.5) |
| Male | 172 (93.5) |
| Marital status | |
| Single | 165 (89.7) |
| Married | 19 (10.3) |
| Residence status | |
| Non-dormitory resident | 52 (28.3) |
| Dormitory resident | 132 (71.7) |
| Job status while studying | |
| Yes | 41 (22.3) |
| No | 143 (77.7) |
| Year of university entrance | |
| 2015 | 18 (9.8) |
| 2016 | 27 (14.7) |
| 2017 | 72 (39.1) |
| 2018 | 67 (36.4) |
| GPA for basic science level | |
| Less than 12 | 46 (25) |
| 12 - 15 | 61 (33.2) |
| More than 15 | 77 (41.8) |
| Having academic failure | |
| Yes | 138 (75) |
| No | 46 (25) |
| The number academic probation semesters | |
| Zero | 138 (75) |
| 1 | 25 (13.5) |
| 2 | 14 (7.6) |
| 3 | 3 (1.6) |
| ≥ 4 | 4 (2.2) |
| Father's education level | |
| Illiterate | 4 (2.2) |
| Elementary | 11 (6) |
| High school | 13 (7.1) |
| Diploma | 48 (26.1) |
| Bachelor's degree | 63 (34.2) |
| Master’s degree and higher | 45 (24.5) |
| Mother's education level | |
| Illiterate | 5 (2.7) |
| Elementary | 26 (14.1) |
| High School | 24 (13) |
| Diploma | 58 (31.5) |
| Bachelor's degree | 54 (29.3) |
| Master’s degree and higher | 17 (9.2) |
| Total | 184 (100) |
Demographic Characteristics and Basic Information of Study Participants
| Variables and Categories | GPA of Basic Science | Students with at Least One Academic Probation Semester | P-Value | |
|---|---|---|---|---|
| 12 - 15 | ≤ 15 | |||
| Age of students at the time of entering the university | 0.58 | |||
| Less than 20 years | 56 (33.5) | 71 (42.5) | 40 (24) | |
| More than 20 years | 5 (29.4) | 6 (35.3) | 6 (35.3) | |
| Gender | 0.185 | |||
| Woman | 7 (58.3) | 4 (33.3) | 1 (8.3) | |
| Male | 54 (31.4) | 73 (42.4) | 45 (26.2) | |
| Marital status | 0.04 | |||
| Single | 50 (30.3) | 73 (44.2) | 42 (25.5) | |
| Married | 11 (58) | 4 (21) | 4 (21) | |
| Residence status | 0.05 | |||
| Non-dormitory resident | 16 (30.8) | 28 (53.8) | 8 (15.4) | |
| Dormitory resident | 45 (34.1) | 49 (37.1) | 38 (28.8) | |
| Job status while studying | 0.01 | |||
| 2015 | 6 (33.3) | 10 (55.6) | 2 (11.1) | |
| 2016 | 6 (22.2) | 13 (48.1) | 8 (29.6) | |
| 2017 | 13 (44.8) | 15 (51.7) | 1 (3.4) | |
| 2018 | 12 (27.9) | 21 (48.8) | 10 (23.3) | |
| 2015 | 24 (35.8) | 18 (26.9) | 25 (37.3) | |
| Father's education level | 0.99 | |||
| Illiterate | 1 (25) | 2 (50) | 1 (25) | |
| Elementary | 2 (18.2) | 6 (54.5) | 3 (27.3) | |
| High school | 5 (38.5) | 5 (38.5) | 3 (23.1) | |
| Diploma | 18 (37.5) | 19 (39.6) | 11 (22.9) | |
| Bachelor's degree | 20 (31.7) | 27 (42.9) | 16 (25.4) | |
| Master’s degree and higher | 15 (33.3) | 18 (40) | 12 (26.7) | |
| Mother's education level | 0.77 | |||
| Illiterate | 0 (0) | 3 (60) | 2 (40) | |
| Elementary | 9 (34.6) | 13 (50) | 4 (15.4) | |
| High school | 7 (29.2) | 10 (41.7) | 7 (29.2) | |
| Diploma | 18 (31) | 22 (38) | 18 (31) | |
| Bachelor's degree | 20 (37) | 22 (40.7) | 12 (22.3) | |
| Master’s degree and higher | 7 (41.2) | 7 (41.2) | 3 (17.6) | |
The Relationship Between Demographic Factors and Academic Failure in Medical Students a
| Variables and Different Groups of Students | Mean ± SD | P-Value |
|---|---|---|
| National ranking of university entrance exam | 0.02 | |
| Group (1) | 4509 ± 6915 | |
| Group (2) | 2896 ± 1776 | |
| Group (3) | 7406 ± 12818 | |
| Total | 4560 ± 7752 | |
| University entrance exam score | 0.001 | |
| Group (1) | 9434 ± 773 | |
| Group (2) | 9659 ± 529 | |
| Group (3) | 8731 ± 1309 | |
| Total | 9353 ± 933 | |
| Diploma GPA | 0.01 | |
| Group (1) | 19.1 ± 0.7 | |
| Group (2) | 19.4 ± 0.5 | |
| Group (3) | 18.6 ± 1.11 | |
| Total | 19.19 ± 0.8 | |
| The amount of study "daily", min | 0.01 | |
| Group (1) | 80 ± 49 | |
| Group (2) | 133 ± 101 | |
| Group (3) | 104 ± 81 | |
| Total | 108 ± 85 | |
| The amount of "daily" presence in the virtual space, min | 0.3 | |
| Group (1) | 143 ± 62 | |
| Group (2) | 138 ± 87 | |
| Group (3) | 120 ± 91 | |
| Total | 135 ± 81 | |
| Content | 0.04 | |
| Group (1) | 3.07 ± 0.76 | |
| Group (2) | 2.84 ± 0.82 | |
| Group (3) | 3.2 ± 0.83 | |
| Total | 3.1 ± 0.81 | |
| GPA of basic science | 0.02 | |
| Group (1) | 3.61 ± 0.84 | |
| Group (2) | 3.23 ± 0.93 | |
| Group (3) | 3.59 ± 1 | |
| Total | 3.45 ± 0.94 |
The Relationship of Some Academic Factors with Academic Failure in Medical Students
| Variables and Different Groups of Students | Mean ± SD | P-Value |
|---|---|---|
| Ideology | 0.98 | |
| Group (1) | 2.48 ± 0.83 | |
| Group (2) | 2.45 ± 0.82 | |
| Group (3) | 2.47 ± 0.92 | |
| Total | 2.46 ± 0.84 | |
| Goal | 0.53 | |
| Group (1) | 3.89 ± 0.61 | |
| Group (2) | 3.77 ± 0.7 | |
| Group (3) | 3.87 ± 0.72 | |
| Total | 3.83 ± 0.67 | |
| Teaching method | 0.27 | |
| Group (1) | 3.7 ± 0.47 | |
| Group (2) | 3.63 ± 0.53 | |
| Group (3) | 3.78 ± 0.51 | |
| Total | 3.69 ± 0.51 | |
| Assessment | 0.22 | |
| Group (1) | 4.01 ± 0.73 | |
| Group (2) | 3.99 ± 0.8 | |
| Group (3) | 4.22 ± 0.64 | |
| Total | 4.05 ± 0.74 | |
| Learning activities | 0.72 | |
| Group (1) | 2.50 ± 0.64 | |
| Group (2) | 2.41 ± 0.62 | |
| Group (3) | 2.50 ± 0.86 | |
| Total | 2.46 ± 0.7 | |
| Resources | 0.77 | |
| Group (1) | 4.02 ± 0.56 | |
| Group (2) | 3.97 ± 0.52 | |
| Group (3) | 3.94 ± 0.7 | |
| Total | 3.98 ± 0.58 | |
| Location | 0.2 | |
| Group (1) | 4 ± 0.76 | |
| Group (2) | 3.84 ± 0.86 | |
| Group (3) | 3.68 ± 1 | |
| Total | 3.85 ± 0.9 | |
| Time | 0.34 | |
| Group (1) | 3.80 ± 0.7 | |
| Group (2) | 3.73 ± 0.56 | |
| Group (3) | 3.61 ± 0.76 | |
| Total | 3.72 ± 0.67 |
The Relationship Between Intra-university Factors and Academic Failure in Medical Students
| Variables and Different Groups of Students | Mean ± SD | P-Value |
|---|---|---|
| Family problems | 0.03 | |
| Group (1) | 1.93 ± 0.75 | |
| Group (2) | 1.86 ± 0.74 | |
| Group (3) | 2.25 ± 0.95 | |
| Total | 1.98 ± 0.81 | |
| Economic problems | 0.94 | |
| Group (1) | 3.15 ± 1.07 | |
| Group (2) | 3.2 ± 1.08 | |
| Group (3) | 3.13 ± 1.12 | |
| Total | 3.17 ± 1.08 | |
| Residence problems | 0.28 | |
| Group (1) | 3.03 ± 0.77 | |
| Group (2) | 2.85 ± 0.73 | |
| Group (3) | 2.82 ± 0.88 | |
| Total | 2.9 ± 0.78 | |
| Personal problems | 0.22 | |
| Group (1) | 2.59 ± 0.88 | |
| Group (2) | 2.4 ± 0.83 | |
| Group (3) | 2.67 ± 0.99 | |
| Total | 2.5 ± 0.89 | |
| Society problems | 0.82 | |
| Group (1) | 3.71 ± 1.06 | |
| Group (2) | 3.61 ± 1.01 | |
| Group (3) | 3.6 ± 1.25 | |
| Total | 3.64 ± 1.1 |
The Relationship Between Some External and Internal University Factors with Academic Failure in Medical Students
| Variables and Categories | OR | P-Value |
|---|---|---|
| Age of students at the time of entering the university | ||
| Less than 20 years | 1.9 | 0.69 |
| More than 20 years | - | - |
| Gender | ||
| Woman | 0.01 | 0.4 |
| Male | - | - |
| Marital status | ||
| Single | 3.9 | 0.5 |
| Married | - | - |
| Working while studying | ||
| No | 0.04 | 0.02 |
| Yes | - | - |
| Father's education level | ||
| Illiterate | 0.009 | 0.81 |
| Elementary | 0.24 | 0.71 |
| High school | 0.28 | 0.63 |
| Diploma | 0.09 | 0.13 |
| Bachelor's degree | 0.04 | 0.4 |
| Master’s degree and higher | - | - |
| Mother's education level | ||
| Illiterate | 0.64 | 0.93 |
| Elementary | 0.05 | 0.59 |
| High school | 0.8 | 0.99 |
| Diploma | 15 | 0.21 |
| Bachelor's degree | 25 | 0.15 |
| Master’s degree and higher | - | - |
| National entrance exam ranking | 1.001 | 0.23 |
| National entrance examination level | 0.998 | 0.1 |
| Diploma's GPA | 0.17 | 0.4 |
| The amount cyberspace daily | 0.993 | 0.32 |
| The amount of daily study | 0.983 | 0.3 |
| Ideology | 0.25 | 0.1 |
| Goal | 3.3 | 0.24 |
| Content | 1.25 | 0.81 |
| Teaching method | 0.14 | 0.27 |
| Assessment | 4.77 | 0.08 |
| Grouping | 1.34 | 0.66 |
| Learning activities | 1.15 | 0.87 |
| Resources | 3.95 | 0.36 |
| Location | 0.85 | 0.86 |
| Time | 0.13 | 0.09 |
| Economic problem | 1.06 | 0.9 |
| Residence problems | 1.43 | 0.62 |
| Personal problems | 0.38 | 0.25 |
| Social problems | 0.66 | 0.49 |
The Results of Multiple Logistics Regression to Determine the Relationship of Different Variables with Academic Failure in Medical Students with at Least One Conditional Semester
| Variables | OR | P-Value |
|---|---|---|
| National entrance exam ranking | 1.0011 | 0.15 |
| National entrance examination level | 0.999 | 0.47 |
| Diploma's GPA | 0.5 | 0.3 |
| The amount cyberspace daily | 1.005 | 0.41 |
| The amount of daily study | 0.25 | 0.1 |
| Ideology | 3.3 | 0.24 |
| Goal | 1.25 | 0.81 |
| Content | 0.14 | 0.27 |
| Teaching method | 4.77 | 0.08 |
| Assessment | 1.34 | 0.66 |
| Grouping | 1.15 | 0.87 |
| Learning activities | 3.95 | 0.36 |
| Resources | 0.85 | 0.86 |
| Location | 0.13 | 0.09 |
| Time | 0.91 | 0.81 |
| Economic problem | 1.16 | 0.81 |
| Residence problems | 2.33 | 0.16 |
| Personal problems | 0.83 | 0.75 |
| Social problems | 0.71 | 0.46 |
The Results of Multiple Logistics Regression to Determine the Relationship of Different Variables with Academic Failure in Medical Students with a GPA of Basic Sciences Equal to 12 - 15
5. Discussion
The results showed that 25% of the evaluated medical students had at least one academic probation semester, indicating a high academic failure. Therefore, university officials must consider the reasons for this drop in education to prevent further decline. Hazavei and Fathi showed that about 12% of the students of Hamedan University of Medical Sciences, Iran, were suspended for at least one academic semester during their studies (8). Academic probation might cause problems for students regarding mental-psychological aspects and educational progress, exposing them to the risk of being deprived of education. In addition, academic probation disrupts the optimal use of scientific principles to train human resources, wastes human and financial resources, and causes social dissatisfaction.
The results showed a significant relationship between AF and students’ residence, and most of the students with AF (82.6%) lived in the dormitory. In addition, a significant relationship was observed between AF and marital status, and AF was higher in single students. The multiple logistic regression test showed no statistical relationship between AF and marital status. The chance of single students for AF was 3.9 times higher than married students in the group of at least academic probation semester. Tamannaifar et al., Ebrahimzadeh et al. 2016 and Bagheri et al. showed a significant relationship between residence and AF. According to the studies’ results, most students with AF lived in the dormitory. In other words, most students without AF lived in their homes and with their families (18-20). Rezaei and Kamali reported no significant relationship between marital status and AF. Meanwhile, married people are busier and are expected to spend less time studying and attending classes, and more AF can be expected in the married group. However, married students succeed more than single students due to their foresight and greater responsibility (21).
The results showed a significant relationship between the amount of AF and some variables, including the national entrance exam level, the national entrance exam ranking, and the GPA of the diploma, which are all three components of the student’s academic record before entering the university. As the level of variables related to previous education history increases, and their AF level decreases. Students with higher educational and scientific records before entering the university probably had higher motivation and ability to learn and progress academically, making them less likely to encounter the AF phenomenon in the university. Costa et al. (22) indicated that the student’s educational background affects the AF variable and the length of the study period, which is similar to the results of the present study. Further, Changizy Ashtyani et al. (17) showed that students with a higher GPA in high school showed more success in university, which was consistent with the results of the present study. In the present study, in the qualitative comments section, students stated that employment while studying is one of the main factors for AF. Moreover, in Changizy Ashtyani et al., having an extra job was one of the factors of lack of success (17). In Shakurnia et al., conditional students were more employed compared to non-conditional students. Being used during the student period causes the student not to have enough time to study and review the courses. Therefore, the academic performance drops and the student becomes probationary (23).
The results revealed a significant relationship between the year of entering the university and their AF. This significant relationship was also present in the multiple logistic regression test so that the probability of AF students will be higher for a one-year increase in the year of entering the university. In addition, there was a significant relationship between AF and the amount of daily study. However, AF had no significant relationship with the age of students when entering the university, gender, father’s education level, mother’s education level, and the amount of daily presence in cyberspace.
The results found no significant relationship between AF and all factors within the university, including ideology, goal, teaching method, evaluation, learning activities, resources, place, and time. According to external and internal factors, AF had a significant relationship with the variable of family problems. In contrast, there was no significant relationship between AF and economic, housing, personal, and community issues. Based on the results mentioned above, paying more attention to the role of family problems in students’ AF is necessary. Based on these results, it is suggested that university academic and student counselors can find the possible reasons for the issue mentioned above, especially family problems, through interviews with students with AF.
5.1. Limitations
the critical limitations of this study were the possibility of lack of honestly in students and leading causes of AF by themselves, lack of access to students’ parents to evaluate the main reasons for AF, non-uniformity of participants regarding gender and place of residence.
5.2. Conclusions
Based on the results, university administrators and academic advisors should pay more attention to issues related to single students living in dormitories and students with a longer study duration in the university to prevent AF. In addition, the university authorities should increase the level of education and learning of students by providing the necessary advice, training, and better living standards in the dormitories, especially for single students. About 72% of the students of this educational center lived in the dormitory and also of the students with AF live in the dormitory. Therefore, the cultural and student vice-chancellor of the university are suggested to increase the motivation and the level of happiness of the students with happy programs and effectiveness measures.
