


1. Background
Anxiety disorders (ADs) are highly prevalent among children and adolescents, leading to impairment in academic and social functioning (1). Among the ADs that occur mainly in childhood, separation anxiety disorder (SAD) is a condition that begins in the preschool years and may persist for years (2). The SAD is characterized by intense arousal in any situation where separation is likely and leads the individual to avoid situations that involve separation (3). The main feature of this type of anxiety is intense anxiety that appears when separated from parents, home, and other familiar places, and in these situations, the child's distress is greater than expected (4).
Children with SAD fear that someone in their family will get hurt in their absence or that something terrible will happen to them while they are away from their significant caregivers. Many children with SAD worry that they or their parents will get into a car accident or get sick. In addition, fears of being kidnapped, getting lost, and never seeing their parents again are other negative outcomes for children with SAD (5).
The ADs in childhood can develop into serious psychological disorders and often do not resolve spontaneously over time without appropriate treatment. Anxiety that begins in childhood is a significant risk factor for other emotional and behavioral disorders, including ADs in adolescence and adulthood, eating disorders, depression, and physical disorders (6).
Recent research suggests that children with SAD may be diagnosed with other psychiatric diagnoses, such as ADs and depression (7). Approximately half of children with SAD also have other ADs, such as specific phobias and generalized AD. Separation anxiety disorder has a high overlap with depression and behavioral problems (7). Some research findings suggest that there is also a high degree of overlap between anxiety in children and attention deficit-hyperactivity disorder (ADHD) (8).
Among psychological treatments, there is sufficient research evidence supporting the effectiveness of behavioral and cognitive-behavioral interventions for anxiety (9). For example, many studies have emphasized the effectiveness of cognitive-behavioral therapy, especially through group and family-based approaches and group education, in treating anxiety in children (10-13). On the other hand, children's cognitive and linguistic limitations, as well as their low motivation to participate in the therapeutic process, have made story therapy an excellent method in counseling and treatment (14).
Storytelling provides children with an opportunity to explore and deal with their problems in an imaginary, safe, and unrestricted space. In this form of therapy, the child does not have to admit his problems, but rather he/she can see the main character of the story struggling with the problem and then exploring different options and finally reaching a solution (15). The hero of the story acts as a role model and the child learns new behavior from him through observational learning and succession of conditioning (16). Many studies have been conducted on story therapy as a treatment method for treating behavioral disorders in children, including depression, stubbornness, disobedience, aggression, etc., which have shown different results (17-20).
2. Objectives
As mentioned, one of the potential issues of importance for elementary school children at the beginning of the school year is SAD. The main aim of the present study was to determine the effectiveness of problem-solving story therapy (PSST) on SAD and bilateral attachment in primary school students in the form of an intervention study.
3. Methods
3.1. Study Groups
This study was an experimental study conducted in Mashhad, Iran in 2023 using a pretest-posttest design. The statistical population of this study was primary school boys with SAD. Using purposive sampling and Cochran's formula (21), 30 students were selected and divided into a control group (n = 15) and an intervention group (n = 15). To collect the study findings, first the SAD and bilateral attachment status of both study groups were assessed, then the intervention was performed for the intervention group, and finally, after the intervention, the status of the two aforementioned variables was assessed again for both study groups.
3.2. Inclusion and Exclusion Criteria
Inclusion criteria included having SAD, not having mental retardation, not using any specific medication, not receiving any other treatment to reduce SAD, and parental consent for their child to participate in the study. Whereas, individuals who did not meet the inclusion criteria were considered as individuals with exclusion criteria (22).
3.3. Data Collection Tools
3.3.1. Separation Anxiety Scale for Children
The Separation Anxiety Scale for Children (SASC) was developed by Mendez et al. to assess the components of separation anxiety in children (23). This questionnaire consists of 26 questions and three components: Sadness from separation, worry about separation, and peace in separation. The SASC questions are based on a five-point Likert Scale that includes “strongly agree” (score 5), “agree” (score 4), “no opinion” (score 3), “disagree” (score 2), and “strongly disagree” (score 1). Questions 1, 10, 11, 17, and 24 are scored in reverse order, that is, strongly agree (score 1), agree (score 2), no opinion (score 3), disagree (score 4), and strongly disagree (score 5). Finally, according to the total scores obtained from the SASC, the level of SAD was determined, such that total scores of 26 - 52, 53 - 78 and 130 - 79 indicate weak, moderate and very high levels of SAD, respectively. The content validity of the SASC has been reported to be satisfactory by Mendez et al. (23). In addition, Mozaffari evaluated the reliability of the SASC and its components using the Cronbach's alpha method, which is presented in Table 1 (24).
| Components of SAD | Question Number | Cronbach's Alpha |
|---|---|---|
| Sadness from separation | 26, 23, 22, 19,18, 16, 15, 14, 12, 9, 7, 6, 5, 4, 3, 2 | 0.85 |
| Worry about separation | 25, 21, 20, 13, 8 | 0.78 |
| Peace in separation | 24, 17, 11, 10, 1 | 0.72 |
| Children's separation anxiety | 1 to 26 | 0.89 |
Cronbach's Alpha Coefficient for Various Separation Anxiety Scale for Children Components
3.3.2. Kinship Center Attachment Questionnaire
Kinship Center Attachment Questionnaire (KCAQ) was designed by Kappenberg and Halpern to measure attachment in children in the preschool and elementary school age (3 - 12 years) and is completed by the mother. This questionnaire consists of 20 items. For each item, a grade between zero and five (always to never) is assigned to each subject. The components of the scale include one subscale (total score) and four sub-questionnaires. The first, second, third and fourth components are related to positive adaptive development (six items), negative behaviors (six items), emotional reactions (four items) and avoidance of caregiver support (four items), respectively. Finally, the total score of KCAQ is obtained by adding up the 20 items. The initial reliability of the questionnaire in the study of the questionnaire developers was reported to be 0.85 based on internal correlation and 0.83 based on the split-half method. The Cronbach's alpha values reported by the creators of KCAQ for the first to fourth components were 0.69, 0.63, 0.65, and 0.56, respectively (25).
3.3.3. Study Implementation
After obtaining permission from the Vice Chancellor for Research and Technology and the University Ethics Committee, the desired samples were selected. Then, their parents were explained about the subject, treatment courses, and study objectives. Parents were told that participation in the treatment course was voluntary and based on the individual's consent and there was no compulsion to participate in the study. To collect data, first, the bilateral attachment and SAD pretests were completed by both study groups; then, after implementing the therapeutic intervention through PSST, the posttest was administered in the last treatment session for the intervention group. The number of treatment sessions for the intervention group included ten 45-minute sessions, which were conducted two days a week. The content of the sessions is presented in Table 2. In addition, one month after the posttest, another test called the "follow-up phase" was administered.
| Sessions | Meeting Content |
|---|---|
| 1 | Getting to know the parents and establishing initial communication with the child, conducting a semi-structured interview and administering a questionnaire |
| 2 | Group members take turns reading the story, presenting pictures, and discussing the content of the story with semi-structured questions. |
| 3 | Story reading by the therapist or a group member and practice and performance by the children |
| 4 | Group storytelling performance |
| 5 | Performing storytelling with prepared sentences |
| 6 | Performing storytelling based on images |
| 7 and 8 | Required school training, familiarization and comparison of desirable and undesirable behaviors |
| 9 and 10 | Teaching problem-solving skills and recalling material presented in previous sessions |
Problem-Solving Story Therapy Sessions Protocol
3.4. Statistical Analysis
Data analysis of this study was based on pre-test and post-test scores for all variables. In this study, data were statistically analyzed at two descriptive and inferential levels using SPSS version 24 software. At the descriptive level, central tendency and dispersion indices including frequency (number), frequency (percentage), mean and standard deviation were used. At the inferential level, analysis of variance with repeated measures and Bonferroni post hoc test were used at a significance level of α = 0.05.
4. Results
The results showed that there was a significant difference in the scores of SAD components including sadness from separation, worry about separation, and peace in separation among the three different study times including pre-test, post-test, and follow-up (P < 0.01). These results indicate the effectiveness of PSST on improving SAD components in primary school children. The findings showed that in the post-test and follow-up stages, compared to the pre-test stage, the scores of SAD components in the intervention group changed significantly. In addition, the statistical power of 0.95 indicated the significant accuracy of these effects (Table 3).
| Source of Change | Values | F | Hypothesis df | Error df | P-Value | Effect Size | Test Power |
|---|---|---|---|---|---|---|---|
| Pillai’s trace | 0.37 | 5.15 | 3 | 26 | 0.006 | 0.37 | 0.87 |
| Wilks’Lambda | 0.62 | 5.15 | 3 | 26 | 0.006 | 0.37 | 0.87 |
| Hotelling’s trace | 0.59 | 5.15 | 3 | 26 | 0.006 | 0.37 | 0.87 |
| Roy’s largest root | 0.59 | 5.15 | 3 | 26 | 0.006 | 0.37 | 0.87 |
Results of the Repeated Measures Multivariate Analysis of Variance Test for Between-Group Effects Regarding Separation Anxiety Disorder Factor
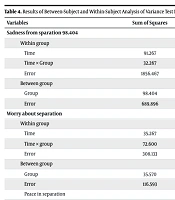
Comparison between subjects shows that there is a significant difference in the mean scores of sadness from separation (P < 0.001, F = 6.59) and peace in separation (P < 0.001, F = 6.92) between the intervention group and the control group (Table 4). In addition, the mean of SAD components in the pre-test, post-test and follow-up stages is significant (P < 0.05), but this difference is not significant between the post-test and follow-up stages (P > 0.05) (Table 5).
| Variables | Sum of Squares | df | Mean of Squares | F | P-Value | Effect Coefficient |
|---|---|---|---|---|---|---|
| Sadness from sparation 98.404 | ||||||
| Within group | ||||||
| Time | 91.267 | 1 | 91.267 | 1.37 | 0.25 | 0.04 |
| Time × group | 32.267 | 1 | 32.267 | 1.45 | 0.23 | 0.04 |
| Error | 1856.467 | 28 | 66.302 | - | - | - |
| Between group | ||||||
| Group | 98.404 | 1 | 98.404 | 3.99 | 0.05 | 0.12 |
| Error | 689.896 | 28 | 24.639 | - | - | - |
| Worry about separation | ||||||
| Within group | ||||||
| Time | 35.267 | 1 | 35.267 | 3.2 | 0.08 | 0.1 |
| Time × group | 72.600 | 1 | 72.600 | 6.59 | 0.01 | 0.19 |
| Error | 308.133 | 28 | 11.005 | - | - | - |
| Between group | ||||||
| Group | 35.570 | 1 | 35.570 | 8.54 | 0.007 | 0.23 |
| Error | 116.593 | 28 | 6.164 | - | - | - |
| Peace in separation | ||||||
| Within group | ||||||
| Time | 32.267 | 1 | 32.267 | 2.31 | 0.14 | 0.07 |
| Time × group | 45.067 | 1 | 45.067 | 3.23 | 0.08 | 0.1 |
| Error | 390.667 | 28 | 13.592 | - | - | - |
| Between group | ||||||
| Group | 43.200 | 1 | 43.200 | 6.92 | 0.014 | 0.19 |
| Error | 174.741 | 28 | 6.24 | - | - | - |
Results of Between-Subject and Within-Subject Analysis of Variance Test for Experimental and Control Groups Regarding Separation Anxiety Disorder Factor
| Variable Time (Stage) of Study | Experimental Group (Intervention Group) | |
|---|---|---|
| Mean ± SD | P-Value | |
| Sadness from separation | ||
| Pre-test and post-test | 3.23 ± 2.2 | 0.15 |
| Pre-test and follow-up | 2.46 ± 2.1 | 0.25 |
| Post-test and follow-up | 0.76 ± 1.94 | 0.69 |
| Worry about separation | ||
| Pre-test and post-test | 2.03 ± 0.84 | 0.02 |
| Pre-test and follow-up | 1.53 ± 0.85 | 0.08 |
| Post-test and follow-up | -0.5 ± 0.72 | 0.49 |
| Peace in separation | ||
| Pre-test and post-test | 2.1 ± 0.9 | 0.02 |
| Pre-test and follow-up | 1.46 ± 0.96 | 0.14 |
| Post-test and follow-up | -0.63 ± 0.9 | 0.48 |
Results of the Bonferroni Test for Pairwise Comparisons of Mean Scores of Research Variables Regarding Separation Anxiety Disorder Factor
The results showed that there was a significant difference in the scores of bilateral attachment components including positive adaptive development, negative behaviors, emotional reactions, and avoidance of personal care support among the three study times including pre-test, post-test, and follow-up (P < 0.01). The results of the mean change in the different stages of the study showed a significant trend in bilateral attachment components, and the statistical power of 0.78 indicated the significant accuracy of these effects (Table 6).
| Source of Change | Values | F | Hypothesis df | Error df | P-Value | Effect Size | Test Power |
|---|---|---|---|---|---|---|---|
| Pillai’s trace | 0.49 | 2.57 | 8 | 21 | 0.04 | 0.49 | 0.78 |
| Wilks’Lambda | 0.50 | 2.57 | 8 | 21 | 0.04 | 0.49 | 0.78 |
| Hotelling’s trace | 0.98 | 2.57 | 8 | 21 | 0.04 | 0.49 | 0.78 |
| Roy’s largest root | 0.98 | 2.57 | 8 | 21 | 0.04 | 0.49 | 0.78 |
Results of the Repeated Measures Multivariate Analysis of Variance Test for Between-Group Effects Regarding Bilateral Attachment Factor
Also, comparison between subjects shows that there is a significant difference between the intervention group and the control group in the mean scores of positive adaptive development (F = 0.001, P < 22.85), negative behaviors (F = 0.001, P < 37.13), emotional reactions (F = 0.03, P < 84.4), and avoidance of personal care support (F = 0.001, P < 56.12) (Table 7). In addition, the mean scores of bilateral attachment components in the pre-test and post-test and follow-up stages are significant (P < 0.05), but this difference is not significant between the post-test and follow-up stages (P > 0.05) (Table 8).
| Variables | Sum of Squares | df | Mean of Squares | F | P-Value | Effect Coefficient |
|---|---|---|---|---|---|---|
| Positive adaptive development | ||||||
| Within group | ||||||
| Time | 33.75 | 1 | 33.75 | 3.1 | 0.08 | 0.1 |
| Time × group | 62.017 | 1 | 62.017 | 5.69 | 0.02 | 0.16 |
| Error | 304.733 | 28 | 10.883 | |||
| Between group | ||||||
| Group | 224.044 | 1 | 224.044 | 22.85 | 0.001 | 0.44 |
| Error | 274.44 | 28 | 9.8 | |||
| Negative behaviors | ||||||
| Within group | ||||||
| Time | 72.600 | 1 | 72.600 | 4.202 | 0.05 | 0.13 |
| Time × group | 26.667 | 1 | 26.667 | 1.544 | 0.22 | 0.05 |
| Error | 230.622 | 28 | 8.237 | |||
| Between group | ||||||
| Group | 141.87 | 1 | 141.878 | 13.37 | 0.001 | 0.32 |
| Error | 297.111 | 28 | 10.61 | |||
| Emotional reactions | ||||||
| Within group | ||||||
| Time | 24.067 | 1 | 24.067 | 3.51 | 0.07 | 0.11 |
| Time × group | 11.267 | 1 | 11.267 | 1.64 | 0.21 | 0.05 |
| Error | 191.667 | 28 | 6.84 | |||
| Between group | ||||||
| Group | 46.944 | 1 | 46.944 | 4.84 | 0.03 | 0.31 |
| Error | 271.289 | 28 | 9.68 | |||
| Avoidance of personal care support | ||||||
| Within group | ||||||
| Time | 22.817 | 1 | 22.817 | 4.74 | 0.03 | 0.14 |
| Time × group | 12.150 | 1 | 12.150 | 2.52 | 0.12 | 0.08 |
| Error | 134.533 | 28 | 4.805 | |||
| Between group | ||||||
| Group | 65.878 | 1 | 65.878 | 12.56 | 0.001 | 0.31 |
| Error | 146.844 | 28 | 5.244 |
Results of Between-Subject and Within-Subject Analysis of Variance Test for Experimental and Control Groups Regarding Bilateral Attachment Factor
| Components of Bilateral Attachment and Time (Stage) of Study | Experimental Group (Intervention Group) | |
|---|---|---|
| Mean ± SD | P-Value | |
| Positive adaptive development | ||
| Pre-test and post-test | -2.53 ± 0.99 | 0.01 |
| Pre-test and follow-up | -1.5 ± 0.85 | 0.08 |
| Post-test and follow-up | 1.03 ± 0.94 | 0.28 |
| Negative behaviors | ||
| Pre-test and post-test | 1.63 ± 0.85 | 0.047 |
| Pre-test and follow-up | 2.2 ± 1.07 | 0.04 |
| Post-test and follow-up | 0.56 ± 0.81 | 0.49 |
| Emotional reactions | ||
| Pre-test and post-test | 1.53 ± 0.75 | 0.04 |
| Pre-test and follow-up | 1.26 ± 0.67 | 0.07 |
| Post-test and follow-up | -0.26 ± 0.66 | 0.69 |
| Avoidance of personal care support | ||
| Pre-test and post-test | -1.6 ± 0.74 | 0.04 |
| Pre-test and follow-up | 1.23 ± 0.56 | 0.03 |
| Post-test and follow-up | -0.36 ± 0.54 | 0.50 |
Results of the Bonferroni Test for Pairwise Comparisons of Mean Scores of Research Regarding Bilateral Attachment Factor
5. Discussion
Also, comparison between subjects shows that there is a significant difference between the intervention group and the control group in the mean scores of positive adaptive development (F = 0.001, P < 22.85), negative behaviors (F = 0.001, P < 37.13), emotional reactions (F = 0.03, P < 84.4), and avoidance of caregiver support (F = 0.001, P < 56.12) (Table 7). In addition, the mean scores of bilateral attachment components in the pre-test and post-test and follow-up stages are significant (P < 0.05), but this difference is not significant between the post-test and follow-up stages (P > 0.05) (Table 8).
In explaining this aforementioned finding, it can be said that children live in the world of stories. The most lively children listen to stories calmly, learn from them, and take lessons from them, and even follow them in their dreams. Every story has an adventure that the child follows. An adventure that has unknown points and can arouse children's curiosity and develop their imagination. The logical continuity that exists in the scenes of the story plays an important role in entertaining children and giving logical order to their thoughts and imagination. The imagination of children is sufficient to allow them to replace one of the characters in the story and, by following his failures and victories, to soften their emotions and feelings or to bring happiness and pleasure to themselves (26).
According to theorists and previous research, when a child listens to a story, they may identify with a character, a topic, or an individual in the story and, as a result, bring it into their own lives. The child's interest in the thoughts, feelings, and behaviors of the characters in the story allows them to share in the experiences of the characters in the story and generalize their beliefs, thoughts, and emotional experiences to themselves, ultimately overcoming their emotional turmoil in this way. In other words, when a child listens to a story or completes an incomplete story, they put themselves in the role of the hero of the story. The child may unconsciously borrow the skills and solutions used by the characters in the story to face their own problems. This enables the child to overcome their past and failures (27).
Therefore, story therapy is useful and effective due to its fundamental values, including facilitating education, helping to shape children's personality development, helping to shape effective behavior, and controlling emotions. Story therapy gives children the opportunity to find problem-solving strategies, and these strategies are also effective for developing social skills, controlling emotions, and learning correct behaviors. This type of intervention can be an appropriate and useful program for students and improve their life performance. In teaching using the story therapy method, the effort is to make children more aware of their feelings and thoughts and to acquire methods for solving problems and learning skills (14, 26-28).
The results of data analysis showed that the implementation of PSST for the intervention group had a significant effect on improving the components of reciprocal attachment, including improving positive adaptive development, negative behaviors, emotional reactions, and avoiding caregiver support. The results of the present study are also somewhat consistent with the results of the studies of Rasekhei Nejad and Khodabakhshi-Koolaee (29) and Mazaheri and Rezakhani (30).
Communication skills and appropriate social interactions are essential for living in society, and children and adolescents who follow appropriate communication patterns are not only more adaptable in their personal and social lives, but also more successful in interacting effectively with others due to having a wealth of necessary social skills. For example, understanding and predicting the behaviors of others leads to the stability of their interactions and social independence (31). Children with a secure attachment style and appropriate communication skills are more easily accepted in a social group, show high dynamism and self-esteem, adapt better to new environments, and act with strength and creativity in problem solving. Secure and aware attachment style and the use of communication skills play an important role in preventing social harms, and this can be considered in planning and policy-making to reduce social harms, because the emergence of some problems in society is due to the lack of development of individuals in the field of social education. Therefore, it can be concluded that story-based therapeutic methods, improving reciprocal attachment styles, teaching communication skills through storytelling and modeling and internalizing these skills through stories appropriate to the child's age, are an effective method for improving and promoting attachment style and social skills in childhood (32).
5.1. Limitations
- Since a single instrument is used as a pre-test and post-test, it is likely to affect the way people respond in the post-test.
- The effect of parental demographic variables, including gender, occupation, education level, and income, on the response variables was not assessed.
- The individual and personal characteristics of the therapist may affect the study findings. In other words, conducting this research by other therapists could probably be carried out differently, and therefore, it is not possible to expect the same results from different researchers or educators with high confidence.
5.2. Conclusions
Based on the findings of the present study, it can be concluded that implementing PSST for primary school children with SAD improves the components of SAD, including sadness from separation, worry about separation, and peace in separation. In addition, PSST can improve the components of bilateral attachment, including positive adaptive development, negative behaviors, emotional reactions, and avoidance of support. Therefore, it can be suggested that psychologists, educational counselors, and parents use PSST for children with SAD.
