

1. Background
With the increase in the world population, interest in cultivation and consequently, the consumption of mushrooms as a food source has augmented. Since 1990, the world began to focus on the mushroom industry, leading to a rapid rise in its production (1, 2). In recent years, mushrooms have become one of the most important sources of food and medicine (3, 4). Demand for edible mushrooms has elevated due to their taste and nutrient content (5, 6). Mushrooms are preferred over animal proteins, and this fact has been supported by various studies (5, 7-9). Several types of vitamins in mushrooms are responsible for improving human health by decreasing the risk of various diseases (10).
White button mushroom is considered one of the most important mushrooms based on its culinary and medicinal values (11). Production and consumption of this mushroom have been consistently increasing for the last six to seven decades. China ranks at the top with the highest production of A. bisporus, and exports mainly to Russia, Japan, Vietnam, Korea, and Thailand, and in lower amounts to Australia, as well as several European and African countries (12). One of the reasons for the low yield of white button mushroom is the successive reproduction of imported strains, and this method of reproduction has led to strain degeneration and a sharp decline in yield. For this reason, the breeding of this mushroom in Iran is of great importance (13). Preparation of pure and high-quality mycelium is one of the most important steps in spawn preparation. Development of such mycelia is usually achieved through lengthy and costly breeding processes, and the mycelium is continuously cultured to produce spawn. In fact, the main purpose of tissue culture is to preserve and produce a high-quality wild or commercial strain or isolate (14).
However, mycelium sometimes shows growth abnormalities during tissue culture. These abnormalities mainly include unwanted changes that are mostly related to the form of aerial mycelium and the composition of hyphae pigments. In this case, the so-called mycelium has degenerated, and the mycelial appearance is fluffy. These mycelial abnormalities include any deviation from the characteristics of mycelium with normal growth, including appearance, growth rate, color, and other characteristics (14). When a spawn made from abnormal mycelium is used in the production of mushrooms, low yield and poor quality are obtained. In more abnormal conditions, mushrooms may not even be produced (13).
Numerous studies have shown that edible mushrooms in nutrient-rich environments exhibit high levels of morphological and physiological diversity, which often occur in the absence of any mutagenic agent. However, little information has been reported about the genetic changes associated with this instability (14, 15). Strain stability is of great importance in both spawn and mushroom production. In morphologically-deformed edible mushrooms, changes in spore production, variability in the formation of aerial mycelium, and discoloration of hyphae might vary. Irreversible and permanent changes are called strain degeneration (14, 16). Changes due to tissue culture are generally divided into two categories, the first being genetic changes that occur during tissue culture and can be passed on to future generations, and the second is epigenetic changes inherited with no change recorded in the DNA sequence. This means that samples with the same sequence at a particular locus represent different phenotypes. Genetic alterations include chromosomal breakage, deletion, chromosomal rearrangement, polyploidy, and nucleotide replacement.
Epigenetic changes occur mainly as changes in the methylation pattern. Epigenetic effects may result from the altered acetylation pattern of histones. Gene acetylation causes gene expression, and deacetylation causes gene silencing (13, 17). Some studies have been conducted with a small sample size on methylation and its effects on the strain degeneration of white button edible mushroom strains. Some methylation was revealed in all samples, even in the normal mycelium, and it was concluded that strain degeneration was not related to methylation. However, further investigation is required in this regard (17).
Amplified fragment length polymorphism (AFLP) marker has been used in the racial differentiation of A. bitorquis. This species is related to A. bisporus. Using six combinations of primer pairs, a total of 271 fragments were produced, 91% of which had polymorphic fragments. According to previous studies, the genetic similarity of the two assessed species was 53% and was found as 18% in a similar experiment with random amplification of polymorphic DNA (RAPD), which indicates the potential of AFLP in the breeding program of mushrooms (18). The AFLP marker was used to establish the molecular identity of 12 modified strains of edible mushroom, which could be distinguished based on the exclusive pattern of fragments obtained from eight pairs of primers in each strain (19).
In another study, of homokaryon basidiospores from fusion between A. bisporus var. bisporus x and A. bisporus var. burnettii were used to evaluate recombination and genetic mapping using three markers AFLP, SSR, and CAPS. In this experiment, 290 AFLP alleles, 21 SSR alleles, and 68 CAP alleles were obtained. This is good evidence showing that the AFLP marker covers a high level of white button mushroom genome. Therefore, in this experiment, the AFLP method was used to investigate the genetic differences between normal and abnormal mycelia (20).
2. Objectives
The current study aimed to investigate the nature of stroma (strain degeneration) and to identify the causes of genetic changes. In this study, mycelial growth deviations were compared between isolates 737 and H2, and the causes of growth deviations were examined. Moreover, the phenotypic abnormalities in the mycelium of white button mushrooms were investigated.
3. Methods
3.1. Culture Media and Strains
The mother strains 737, and H2 of A. bisporus (prepared from the Research Center for Mushrooms, Mohammad Farsi, Iran) were stored on potato dextrose agar medium (pH: 6.2). Next, the strains were cultured in liquid malt extract-yeast extract-glucose medium (10 g/L malts, 4 g/L yeast extract, and 10 g/L glucose, pH: 6.2) under constant conditions for 10 - 12 days at 23 ± 1°C and in dark.
In this experiment, in order to investigate the nature of strain degeneration in H2 and 737 strains, ten successive subcultures of mycelium were taken from the mother mycelium, and genetic changes were examined. In addition, genetic differences between the mother, normal, and fluffy mycelia were evaluated. Three samples of the mother, normal, and fluffy mycelia from each strain were included in the AFLP analysis.
3.2. DNA Extraction
DNA extraction from the growing mycelia of the mother, normal, and fluffy strains from liquid cultures were used according to the cetyltrimethylammonium bromide (CTAB) method with modification in Soltis laboratory., the Florida Institute of Natural History (21). For extraction, 100 mg of milled mycelium in liquid nitrogen was transferred to a 1.5 μL microtube. Afterwards, 900 μL of extraction buffer (20 mM EDTA, 1 M NaCl, 1% CTAB, 1% β-mercaptoethanol, 100 mM Tris-HCl, 1% PVP, temperature 65°C) was added and was shaken for 15 min.
The samples were placed in a water bath of 65°C for 90 min. Next, 450 μL of chloroform: isoamyl alcohol (1.24) was added to each microtube and were shaken. The resulting emulsion was centrifuged for 15 min at 12,000 rpm and the aqueous phase was transferred to a new 1.5 mL microtube. At 8% of the aqueous layer volume, 7.5 mM ammonium acetate was added to each sample. Afterwards, cold isopropanol (-20°C) was added at 54% of each aqueous layer volume, and the microtubes were shaken. Microtubes were stored at -20°C for 24 h and were centrifuged at 12,000 rpm for 5 min. The resultant sediment was centrifuged with 700 μL of 70% alcohol at 12,000 rpm for 1 min, and alcohol was separated from microtubes. The quality and purity of DNA were verified by UV electrophoresis and spectrophotometer. Finally, 100 μL of sterile distilled water was combined with the samples and was kept at -20°C until use.
3.3. AFLP Analysis
3.3.1. Restriction Ligation
The AFLP reactions were carried out according to the Vos et al. method (22) with some modifications. First, 5 μL of the DNA of each isolate with a concentration of 100 ng/μL was added to 25 μL of TaqI enzyme solution (containing 5 U of TaqI enzyme, 6 μL of tango (2x) buffer, and 18 μL of double sterilized distilled water) and was placed in thermos cycler for 65 h at a temperature of 65°C. Next, 10 μL of EcoRI enzyme solution (containing 5 U of EcoRI enzyme, 2 μL of tango (2x) buffer, and 7 μL of twice sterilized distilled water) was added to each of the previous samples and was placed in a thermal cycler for 2 h at 37°C.
The double-stranded EcoRI and Taql adapters were formed as 1 μL through incubating 5 pmol EcoRIAF with 5 pMol EcoRIAR and 50 pMol TaqlAF with 50 pMol TaqlAR at 65°C for 10 min, 37°C for 10 min, followed by 25°C for 10 min. The ligation solution consisted of μL/5 pMol double-stranded adapters EcoRI, μL/50 pMol double-stranded adapters TaqI, 0.1 μL/10 U DNA digested with Taql, 0.1 μL/10 U DNA digested with EcoRI, μL/1 U T4 DNA polymerase, and 2 μL T4 ligase buffer (10x), and 4.8 μL of double sterilized distilled water. It was incubated at 22°C for 3 h, followed by 65°C for 15 min (10 μL final volume).
3.3.2. Nonselective PCR
In the nonselective amplification step, primers used with an additional nucleotide at the 3’ end provide the DNA patterns appropriate for the selective amplification step. For this stage, PCR was performed in a volume of 25 μL comprising 1 μL of ligation solution, 0.5 μL/10 mM dNTPs, 0.2 μL Taq DNA polymerase μL/5 U, 0.5 μL/100 mM MgCl2, 2.5 μL PCR buffer (10x), μL/30 ng EcoRIAF primer, μL/30 ng TaqIAF primer, and 18.3 μL of double sterilized distilled water. Amplifications were performed at the following conditions: 94°C for 1 min, 28 cycles of 30 sec at 94°C, 30 sec at 51°C, and 1.5 min at 72°C. The final cycle was carried out by an additional 5 min at 72°C.
3.3.3. Selective PCR
For selective amplification, the preselected amplification product was diluted 200 times and was amplified using a pair of selective primers (primers with one or two selective nucleotides added to the 3′ end) and five random primer combinations. The PCRs were carried out in 30 μL final volume which contained 2.5 μL PCR buffer (10x), 0.5 μL/10 mM dNTPs, 0.5 μL/100 mM MgCl2, 0.5 μL of Taq DNA polymerase μL/5 U, μL/30 ng of each primer (TaqI and EcoRI), 3 μL of targeted digested and ligated genomic DNA, and 21 μL of double sterilized distilled water. All amplification reactions were conducted at the following conditions: 94°C for 1 min, 30 cycles of amplification at 94°C for 30 sec, first annealing temperature decreasing 0.7°C/cycle with 12 cycles at 63°C for 30 sec (annealing temperature depends on primers Tm), and the next 18 amplification cycles at 54°C for 30 sec. The final cycle was performed with an additional 8 min at 72°C. The PCR products were kept at 4°C until the next analysis. The primers and adapters used for AFLP are shown in Table 1.
| Names | Sequence 5′ - 3′ |
|---|---|
| Adaptor | |
| EcoRIAF; EcoRIAR | CTCGTAGACTGCGTACC |
| CATCTGACGCATGGTTAA | |
| TaqIAF; TaqIAR | GACGATGAGTCCTGAG |
| TACTCAGGACTCGC | |
| Non-selective primer | |
| EcoRI | GACTGCGTACCAATTCA |
| TaqI | GATGAGTCCTGACCGA |
| Selective primer | |
| EcoRI | GACTGCGTACCAATTC + CT |
| GACTGCGTACCAATTC + GC | |
| TaqI | GATGAGTCCTGACCGA + TA |
| GATGAGTCCTGACCGA + GT | |
| GATGAGTCCTGACCGA+ AC |
List of Primers and Adapters
3.4. Electrophoresis
The amplification reaction products were mixed in equal 10 μL volumes of formamide dye. The mixtures were heated at 94°C for 4 min followed by rapid cooling on ice. The 6% polyacrylamide electrophoresis gel was prepared using 1000 mL of gel solution containing 420 g of urea, 200 mL of 5x TBE, 150 mL of 40% acrylamide solution (19: 1), up to the volume of 1000 mL of twice sterilized water, 600 μL of 10% ammonium sulfate, and 90 μL of TEMED. Electrophoresis was completed at the fixed voltage of 120 V for 2 h. Next, the gels were fixed for 30 min in 10% acetic acid. For staining, the gel was placed in a 1 g/L silver nitrate solution for 35 min (13).
3.5. Data Analysis
Fragment scoring and DNA data analysis were performed based on the images obtained from stained gels. The presence of a fragment was rated as (1) and absence as (0). The data were then entered into Excel software and transferred to POPGENE 32 software for analysis. The genetic similarity matrix obtained from this software (POPGENE 32) was used to determine the genetic distance of the samples.
4. Results
Based on the electrophoresis results, the fragment patterns of each sample were visible. Figure 1 shows the status of the bands for both H2 and 737 strains with two combinations of EcoRI + GC/TaqI + AC primer pairs.

AFLP 6% polyacrylamide gel electrophoresis with two primer combinations EcoRI + GC/TaqI + AC; L, Lader; 1, H2 mother; 2, H2 normal; 3, H2 fluffy; 4, 737 mother; 5, 737 normal; 6, 737 fluffy. Arrows indicate polymorphism in the resulting fragments.
The general results of studying the AFLP fragment patterns of each of the two strains H2 and 737 are presented separately in Tables 2 and 3. For both 737 and H2 strains, the highest percentage of polymorphic fragments was found in EcoRI primer compounds containing two additional CT nucleotides. Overall, the AFLP marker with six primers produced 137 fragments for H2 strain, of which 57 fragments had polymorphism between the mother, normal, and fluffy mycelia. For the strain 737, 149 fragments were produced, of which 73 fragments had polymorphism between the mother, normal, and fluffy mycelia. On average, the polymorphism percentage between the mother, normal, and fluffy mycelia was about 42% for the H2 strain and about 49% for the 737 strain. The degree of polymorphism among the samples confirmed the existence of genetic differences between the mother, normal, and fluffy mycelia. The results are statistically significant according to the P-value.
| EcoRI | TaqI | Number of Fragments | Number of Polymorphism | Percentage of Polymorphism | P-Value |
|---|---|---|---|---|---|
| CT | TA | 23 | 13 | 56.52 | ≤ 0.00001 |
| CT | GT | 22 | 11 | 50 | ≤ 0.00001 |
| CT | AC | 20 | 6 | 30 | ≤ 0.00001 |
| GC | TA | 24 | 9 | 37.5 | ≤ 0.00001 |
| GC | GT | 25 | 8 | 32 | ≤ 0.00001 |
| GC | AC | 23 | 10 | 43.47 | ≤ 0.00001 |
| Sum | 137 | 57 | 41.6 | ||
| Average | 22.9 | 5.9 | |||
AFLP Primers Used in the Analysis of H2 Strain, the Number of Fragments, Number of Polymorphism, Percentage of Polymorphism
| EcoRI | TaqI | Number of Fragments | Number of Polymorphism | Percentage of Polymorphism | P-Value |
|---|---|---|---|---|---|
| CT | TA | 29 | 19 | 65.51 | ≤ 0.00001 |
| CT | GT | 22 | 15 | 68.18 | ≤ 0.00001 |
| CT | AC | 26 | 11 | 42.3 | ≤ 0.00001 |
| GC | TA | 23 | 5 | 21.73 | ≤ 0.00001 |
| GC | GT | 23 | 10 | 43.47 | ≤ 0.00001 |
| GC | AC | 26 | 13 | 50 | ≤ 0.00001 |
| Sum | 149 | 73 | 48.99 | ||
| Average | 24.83 | 12.73 | |||
AFLP Primers Used in the Analysis of the Strain 737, the Number of Fragments, Number of Polymorphism, Percentage of Polymorphism
Closer inspection by POPGENE 32 software using Nei coefficient (23) revealed that the differences between mother, normal, and fluffy mycelia were expressed separately, as shown in Table 4. The difference between mother and normal mycelia was about 0.05 and between mother and fluffy mycelia was 0.49 for the strain 737. Moreover, for the H2 strain, the difference between mother and normal mycelia was the same as 0.05 and for mother and fluffy mycelia was approximately 0.4. The results were significant between mother, normal and fluffy mycelia of H2 and 737 strains (P ≤ 0.001).
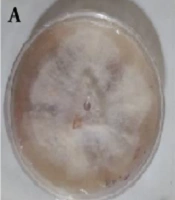
In this study, the differences observed between mother and normal mycelia indicate changes that did not affect the mycelium phenotype because no changes were observed in mycelium phenotype after ten successive subcultures (Figure 2).

A and B, Samples of successive subcultures of mycelium; C, Sample of the fluffy mycelium for DNA extraction.
5. Discussion
Strain degeneration in white button mushroom has been studied. However, accurate information is not yet available on events that are the main cause of irreversible backlash. Some speculations have been proposed for the cause of this incident. For example, maximum stress and pressure are found at the fruiting stage of white button mushroom, in which commercial cultivars A. bisporus may have an inherent tendency to degenerate (16).
In this study, the differences observed between normal and mother mycelia indicate changes that did not affect mycelium phenotype because no changes were observed in mycelium phenotype after ten successive subcultures. These genetic alterations caused a difference of about 5% in the fragments of mother and normal mycelia. Some changes, such as the removal of a number of fragments and the addition of fragments that occurred in the fragments of mother and normal mycelia. This rate of changes due to the rate of mutation in mushrooms, which is about 3.8 × 10⁻⁷ to 1.6 × 10⁻⁵ (24), indicates that a natural tendency to genetic change in edible mushrooms is the key.
As mentioned, the difference between mother and normal mycelia was 5%, while between mother and fluffy mycelia was about 50%. This difference demonstrates that the environment is not the cause of this genetic difference because the difference between fragments in normal and fluffy mycelia was not the same as mother mycelium. If the environment was the cause of these genetic changes, the degree of band differences should have been equal or at least with fewer differences in both normal and fluffy mycelia.
Both 737 and H2 strains had the highest percentage of polymorphic fragments in EcoRI primer compounds containing two additional CT nucleotides. Overall, the 50% difference between mother, normal, and fluffy mycelia can confirm the experiments that have been performed so far. In an investigation on all fluffy isolates, genetic differences with mother were observed, which are the most common differences. The loss of one of the two alleles, and in some cases the loss of one of the two homologues, was complete (25).
According to the literature, variable origins can be stated for these genetic differences. One of the effective factors, which has been mentioned in various articles, is the crossing over mechanism. Although heterocaryotic monospores, due to the migration of non-sister dual nuclei into a basidiospore, should normally resemble their parent and heterozygous, meiosis-related phenomena causes variation in the basidiospore. One of the phenomena associated with meiosis division is the crossing overs in gene loci away from the centromere, resulting in recombination or even homozygosity in some of their gene loci as two non-sister nuclei migrate into a basidiospore. Another phenomenon is that some alleles may be associated with new promoters or cis-acting regulatory regions. Finally, the re-assortment of chromosomes in new haploid nuclei creates a new regulatory environment for some genes and affects traits, such as mycelial growth rate, which is a quantitative trait (14).
One of the factors that can explain the existing genetic differences is the parasexuality process and the phenomenon of heterokaryosis disease, which is one of the genetic mechanisms of asexual recombination. In the parasexuality process, genetic recombination occurs and is transmitted to offspring without the meiosis of fused strains. After the fusion of the two strains, there are different types of nuclei with the phenomenon of heterokaryosis. This variation in nuclei may result from an induced or spontaneous genetic mutation. An unstable diploid nucleus with multiple mitosis divisions is formed. During these divisions, the rare phenomenon of crossing over during mitosis can occur, and in the last stage, the phenomenon of chromosome segregation reduces the chromosome at each turn and creates different levels from aneuploidy to haploid (26).
Research has shown that asexual recombination often takes place at the intersections of heterokaryon with homokaryon and heterokaryon with heterokaryon (27). In the mitosis process of the white button mushroom in another experiment, a high percentage of rare crossing overs (mitosis crossing over) was reported, indicating a high rate of changes caused by asexual reproduction (28). Moreover, the results of the latter experiment showed that the differences between mother and fluffy mycelia could have occurred due to genetic factors, including the phenomenon of heterokaryosis, parasexuality, and the crossing over of meiosis and mitosis. In this experiment, differences were also observed between the mother and normal mycelia, which had no influence on the mycelium phenotype in either study while showing the natural tendency of the fungus to make genetic changes during the successive subcultures of mycelium. Furthermore, it was demonstrated that the genetic difference between mother, normal, and fluffy mycelia in strain 737 was slightly greater than that of H2. Although strain 737 had more changes, however, during ten successive subcultures performed, both strains showed almost equal changes, which indicates the same level of chromosomal stability in these two strains.
5.1. Conclusion
In the present study, the genetic differences between mother, normal, and fluffy mycelia were well demonstrated by the AFLP marker, confirming the genetic background of strain degeneration as one of the biggest challenges for white button mushroom spawn growers. However, some of the observed differences might be rooted in epigenetic changes that occur due to alterations in genome methylation patterns and differences in genes expression. It is recommended to consider this approach in future research.
