


1. Background
Water treatment is a major challenge in water engineering science because of extensive contamination of surface and underground waters with chemicals (1). Halogenated hydrocarbons are widely used to synthesis pesticides and herbicides as well as for preparing detergents. Over time, they have contaminated water resources, which resulted in the production of halogenated hydrocarbons (2). Besides, the propagation of such chemicals in the water resources causes their emission into the soil and atmosphere. Hence, such contaminations are not only a great public health challenge but also can deplete the ozone layer (3). In humans, these compounds cause dizziness, heart disorder, and disorders of the nervous system (4-6). Trichloromethane (chloroform) is one of the most abundant halogenated hydrocarbons found in water resources because of the extensive use of chlorine as an antiseptic compound that can produce chloroform through reacting with humic acids (7).
One of the well-known catalysts for chloroform removal is Pt/Pd NPs., which are not cost-effective for commercial applications (8). Hydro-dechlorination is another approach to degrade chloroform; however, this method requires a high-temperature treatment (9-16), indicating that this method is not a cost-effective alternative. Moreover, this method has the drawback of producing toxic byproducts such as phosgene and furan (17, 18). Adsorption of pollutants is a favorable technique to remove hydrocarbons due to its simplicity, non-destructiveness, and being cost-effective (12, 16, 19-23). By using electromagnetic induction, the Fenton like process was applied for the removal of chloroform. Other adsorbents, such as snow, bran rice, and mud, were also applied for the remediation of chloroform from water resources (12, 16, 23-25).
Nano-adsorbents are good candidates for the adsorption of chemical species because of their large specific surface area, pore-volume, and maximum adsorption capacity (10, 26-29). Zinc oxide NPs are reported as good nano-adsorbents in this regard; hence, several studies have used these compounds as good photocatalytic material and adsorbent, but due to agglomeration of ZnO NPs, it is necessary to use substrates, such as GO, zeolites, and the other organic polymers (30-39). Meanwhile, the application of inorganic substrates is favored because of less toxicity and ease of preparation compared to the organic substrates (9). In this work, two different inorganic substrates (zeolites and GO sheets) were impregnated with zinc oxide NPs to overcome the agglomeration problem of ZnO NPs and hence to enhance its textural properties to achieve a better chloroform removal efficiency.
2. Objectives
The current study aimed to propose cheap and efficient adsorbents to remove chloroform from water.
3. Methods
3.1. Materials
Zinc sulfate, sodium hydroxide, and hydrochloric acid were obtained from Merck, Germany. HPLC grade chloroform from Fluka (Switzerland) was used without further purification. Natural zeolite NPs were purchased from Tamad-Micro Inc. Ultrapure water (Millipore) was used through the work.
To prepare chloroform samples, a 500 mg. L-1 chloroform stock solution was prepared by dissolving the appropriate volume of pure chloroform into 1L of ultrapure water in a volumetric flask. It was then used to prepare other diluter chloroform samples.
3.2. Synthesis
ZnO NPs were prepared as described in our previous work (9). The prepared ZnO NPs were used as a support for preparing the nanocomposites. ZnO/GO was prepared as described earlier (9, 38). For preparing ZnO/GO/Zeolite or GO/Zeolite nanocomposites, at first, the purchased zeolites were washed with plenty of ultra-pure water to remove ionic salts within the zeolite pores. So that 0.5 g of the zeolite weighted in a beaker, 0.5 g of ZnO NPs, and 0.1 g of GO was added to it, then 20 mL of ultrapure water was added to the mixture. The mixture was sonicated for 1 h. Afterward, it was placed over a magnetic stirrer for stirring overnight.
3.3. Experimental Procedure
Five different 100, 75, 50, 25, and 10 mg. L-1 chloroform solutions were prepared, and then 20 mL of each of them was poured into four beakers containing 20 mg of the four nano-adsorbents, ZnO, ZnO/GO, GO/zeolite, and ZnO/GO/zeolite. The nano-adsorbents/chloroform mixtures were stirred over stirrers for 30 min. Then the mixtures were filtered. After that, 1 µL of each of the filtrates were presented to the GC to measure the equilibrium concentrations of chloroform and hence to obtain adsorption isotherm models.
50 mL of 50 mg. L-1 solution was poured into the different beakers containing 20 mg of the different adsorbents. The mixtures were placed over the stirrer, and 5 mL of the samples were taken after each 10 min duration time. Each of the taken mixtures was centrifuged to remove the adsorbents, and then 1 µL of the clear solutions were presented to GC to measure the remained chloroform concentrations.
To study the effect of pH on the adsorption of chloroform, various 50 mg.dm-3 chloroform solutions were prepared in different pHs. A metrohm 780 pH/ion-meter was used to monitor pH. Adjustment of pH was performed by adding appropriate amounts of sodium hydroxide salt and/or hydrochloric acid into the chloroform solutions.
3.4. Analysis
Concentrations of chloroform were measured using a gas chromatograph (GC), Varian CP-3800, Australia, equipped with a 300 mm, 0.32 mm in diameter column #cp 8752, flame ionization detector, 1177 split injector. Helium gas was used as carrier gas. The GC column worked over-temperature ranged from 35°C to 120°C BJH and BET models, based on N2-adsorption-desorption at 77K, were performed with (BElSORP Mini (Microtrac Bel Corp CO)) to determine the pore diameter, pore volume, and active surface area of the nanocomposites. XRD patterns were obtained with X’Pert Pro (Panalytical Co.). The FESEM images were taken with Sigma VP, Zeiss, Germany.
Kinetic studies of adsorption phenomena are good keys to derive information about the adsorption mechanism. Different adsorption kinetic models, pseudo-first-order, pseudo-second-order, and inter-particle diffusion were introduced by the authors (40-44). Equilibrium adsorption capacity (qe) and instantaneous adsorption capacity (qt) were measured according to Equations 1 and 2.
Where C0, and Ce are initial and equilibrium concentrations of chloroform, respectively. To fit the pseudo-first-order kinetic model of the adsorbents, the corresponding qe and qt were fitted in Equation 3. In the following Log (qe- qt) was plotted versus t (40, 41). So that intercept of the straight-line produced log qe, and its slope presents the rate constant of the pseudo-first-order adsorption rate constant, K1:
The pseudo-second-order kinetic model was obtained by regressing
Inter-particle diffusion model was obtained by regressing qt versus
Where Kp is the inter-particle diffusion rate constant, which can be obtained from the slope of the inter-article diffusion model, and xt is a constant related to the quantity of adsorption extent.
4. Results and Discussion
4.1. Characterization of Nanocomposites
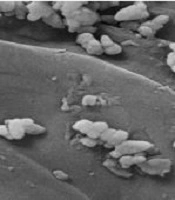
To obtain structural information of the composites, XRD patterns of the nanocomposites were taken. The results are depicted in Figure 1. Figure 1A - D indicate the XRD patterns of the pristine ZnO, ZnO/GO, ZnO/GO/zeolite, and GO/zeolite, respectively. As shown in Figure 1A, the appeared sharp peaks are attributed to ZnO NPs (JCPDS Card No. 036-1451). Comparing Figure 1A and B reveals the effect of the presence of GO on the lattice structure of the pristine ZnO NPs, and also the presence and absence of new small peaks may be due to the presence of GO. Figure 1C is related to ZnO/GO/Zeolite. It preserves the characteristic peaks related to pristine ZnO. The remained peaks are attributed to zeolite and GO. Figure 1D is related to GO/zeolite that its peaks were at 2tetah 9.89, 11.22, 13.05, 16.96, 17.36, 20.95, 21.94, 22.45, 22.8, 26.04, 26.64, 30.03, and 32.05, attributed to both of GO and zeolite. In addition, the morphology of the nanocomposites was also studied (Figure 2). As shown in Figure 2A - C, ZnO NPs revealed potato-like particles, which decorated over GO or zeolite in the case of ZnO/GO. ZnO/GO/Zeolite (Figure 2B and C). Finally, Figure 2D showed zeolite NPs that were well dispersed within the GO sheets. In order to obtain surface characteristics and porosity of nanocomposites, N2- adsorption-desorption on the nanocomposites was studied. The BET and BJH models of the nanocomposites were obtained, and then the active surface area, pore diameters, and pore volume of the adsorbents were calculated (45-47). The results of the study are depicted in Figure 3A and B as well as Table 1. As shown in Figure 3A, a hysteresis loop shape revealed that the samples had mesostructured. In addition, a greater extent of adsorption was achieved with ZnO/nanocomposites compared to the pristine ZnO NPs. This may be due to the creation of the core-shell of ZnO-NPs. with zeolite and GO-NPs, so it can cause ZnO lattice layers to be separated from each other, which in turn causes improved porosity of the nanocomposites. On the other hand, active surface areas for the ZnO/GO are extremely greater than the other nanocomposites. Based on the BJH model, pore volumes of ZnO/GO were extremely greater than pure ZnO NPs (Figure 3B and Table 1). Mean pore diameters of ZnO NPs were increased from 116.5 nm to 140.2 nm, due to the presence of GO. On the other hand, mean pore diameters were decreased in the case of ZnO/GO/zeolite and GO/zeolite, it may be due to the penetration of ZnO NPs and GO NPs into the zeolite tetrahedral frameworks. Hence, the decrease in the mean pores diameter can be justified. Meanwhile, the greater pore volume and surface area of ZnO/GO/zeolite and GO/zeolite, compared to that of ZnO NPs, can be explained by the presence of zeolite and GO sheets, which causes the spread of ZnO NPs over GO sheets to produce an extensive surface. Zeolite could not help ZnO NPs to produce more extensive surfaces than GO, because of penetration of some of ZnO NPs into the zeolite frameworks, as discussed earlier.
, ZnO/GO (B), ZnO/GO/zeolite (C), and GO/zeolite (D)")
XRD patterns of ZnO NPs (A), ZnO/GO (B), ZnO/GO/zeolite (C), and GO/zeolite (D)
, ZnO/GO (B), and ZnO/GO/zeolite (C), and GO/zeolite (D)")
FESEM images of ZnO NPs (A), ZnO/GO (B), and ZnO/GO/zeolite (C), and GO/zeolite (D)

A, BET isotherm based on Nitrogen-adsorptiondesorption on the different adsorbents; B, Pore size distribution of the different nanocomposites
| Sample | Specific Surface Area (ap) (m2. g-1) | Mean Pore Diameter (rp) (nm) | Pore Volume (Vp) (cm3. g-1) |
|---|---|---|---|
| ZnO/GO | 23.34 | 140.2 | 0.088 |
| ZnO | 8.8 | 116.5 | 0.025 |
| ZnO/GO/Zeolite | 19.2 | 80.3 | 0.046 |
| GO/Zeolite | 22.5 | 87.4 | 0.047 |
Textural Parameters of Samples of The Different Nanocomposites
4.2. Effect of Adsorbent Dosage
Different amounts of adsorbents were examined to investigate the effect of the adsorbent dosage on the removal of chloroform (Figure 4). As shown in Figure 4, about 0.3 g of the adsorbents was enough to reach the maximum chloroform removal for each of the nano-adsorbents. The figure also shows that ZnO/GO could remove a greater extent of chloroform compared to the other nanocomposites.
 ZnO/GO, (b) GO/Zeolite, (c) ZnO/GO/Zeolite, and (d) ZnO NPs")
Effect of the different nanocomposite amount on the removal percent of chloroform, (a) ZnO/GO, (b) GO/Zeolite, (c) ZnO/GO/Zeolite, and (d) ZnO NPs
4.3. Kinetic Study of Chloroform Removal
Figure 5 shows the fitted data, based on the above-mentioned adsorption kinetic models for the different adsorbents. As obvious in the figure, almost all of the adsorbents followed the inter-particle diffusion kinetic model. All of the corresponding kinetic constants of the adsorbents are summarized in Table 2. As shown in the table, ZnO/GO and GO/Zeolite showed a greater adsorption rate constant compared to the other two adsorbents. However, the results of the isotherm study, which are provided in the following sections, confirm the superiority of ZnO/GO to GO/Zeolite, because of the greater maximum capacity of the former compared to the latter.
 concentration-time profile of chloroform removal, (b1-b4) pseudo-first-order model, (c1-c4) pseudo-second-order model, and (d1-d4) inter-particle diffusion model for ZnO/GO, ZnO, ZnO/GO/Zeolite, and GO/Zeolite, respectively")
Kinetic models for the adsorption of chloroform on ZnO/GO, (a1-a4) concentration-time profile of chloroform removal, (b1-b4) pseudo-first-order model, (c1-c4) pseudo-second-order model, and (d1-d4) inter-particle diffusion model for ZnO/GO, ZnO, ZnO/GO/Zeolite, and GO/Zeolite, respectively
| Adsorbent composition | Pseudo-first order | Pseudo-second order | Interparticle diffusion | |||
|---|---|---|---|---|---|---|
| R2 | K1 | R2 | K2 | R2 | Kp | |
| ZnO | 0.859 | 0.119756 | 0.835 | 0.000555 | 0.996 | 27.63 |
| ZnO/GO | 0.763 | 0.096726 | 0.845 | 0.000281 | 0.993 | 35.5 |
| ZnO/GO/Zeolite | 0.961 | 0.156604 | 0.993 | 0.006 | 0.929 | 27.9 |
| GO/Zeolite | 0.894 | 0.175028 | 0.928 | 0.0007 | 0.996 | 45.45 |
Kinetic Parameters of the Different Adsorbents (Nanocomposites)
4.4. Maximum Capacity of the Adsorbents
The maximum capacity of an adsorbent is the maximum amounts (mg) of adsorbate that can be adsorbed on one gram of the material. Different sorbents have various adsorption mechanism or adsorption routes. Different adsorption isotherms are introduced by authors (48-51). In this work, two famous adsorption models, Langmuir (Equation 6) and Freundlich (Equation 7), were studied for the different adsorbents (48, 49). Adsorption models of the adsorbents are shown in Figure 6. As this figure shows, almost all of the nanocomposites follow the Langmuir adsorption model, which predicts a monolayer physical adsorption of the chloroform on the sorbents. This is more rational, because of the hydrophobic character of chloroform, which makes it possible to be adsorbed on the nanocomposites. Different isotherm parameters were also computed using the different isotherm models of interest (Table 3). As indicated by the results, ZnO/GO showed a greater adsorption capacity compared to the other nanocomposites. As evident from Table 3, the order of the maximum adsorption capacity of the nanocomposites was predicted as follows: (ZnO/GO) > (ZnO/GO/Zeolite) > (GO/Zeolite) > (ZnO NPs.). These results are consistent with those earlier obtained with BET and BJH models (Table 1).
 Langmuir models, and (b1-b4) Freundlich models for ZnO/GO, ZnO NPs, ZnO/GO/Zeolite, and GO/Zeolite, respectively")
Different isotherm models, (a1-a4) Langmuir models, and (b1-b4) Freundlich models for ZnO/GO, ZnO NPs, ZnO/GO/Zeolite, and GO/Zeolite, respectively
| Adsorbent composition | Langmuir | Freundlich | ||||
|---|---|---|---|---|---|---|
| qmax | KL | R2 | 1/n | KF | R2 | |
| ZnO | 43.47 | 0.025 | 0.997 | 0.651 | 1.853 | 0.983 |
| ZnO/GO | 250 | 0.1333 | 0.993 | 0.82 | 26.73 | 0.997 |
| ZnO/GO/Zeolite | 100 | 0.0125 | 0.994 | 0.803 | 1.686 | 0.994 |
| GO/Zeolite | 90.9 | 0.0257 | 0.995 | 0.692 | 3.698 | 0.975 |
Isotherm Parameters of the Different Adsorbents for the Removal of Chloroform
4.5. Effect of the pH on the Removal of Chloroform
pH is a crucial condition for all aquatic environments. It also can affect chemical, physical, and microbial properties. For this reason, the pH of water samples was changed from 3 to 10. The different adsorbents showed different trends toward the removal of chloroform in a different pH. As indicated in the inset of Figure 7, about all of the adsorbents had better adsorption of chloroform in the pH range between 7 to 8 compared to the other pHs. This is due to the solubility of ZnO in acidic and alkaline media. ZnO/GO and GO/Zeolite even had shown remarkable adsorption in acidic regions because of the presence of GO in these harsh conditions. On the other hand, in alkaline regions, the removal of chloroform was diminished remarkably for all adsorbents. This may be due to the negative charge of the nanocomposites resulted from the adsorption of hydroxide ions in high concentrations in these regions. Hence optimal pH range for the best removal percentage for all of the adsorbents was concluded to be 7 to 8.
4.6. Regenerability of the Nanocomposites
From a commercial viewpoint, using regenerable adsorbents is necessary to reduce the cost of water treatment. Hence, the regeneration of the adsorbents is highly important. For this reason, four removal cycles were performed using sixteen industrial wastewater samples that were spiked with 50 mg.dm-3 of chloroform. Afterward, four aliquots of 50 mL of the wastewater samples, containing chloroform, were treated with the different adsorbents in each removal cycle. After each chloroform-removal cycle, the nano adsorbents were regenerated by incubating in an electric oven at 150°C for 1 hour, during which the adsorbents were degassed. Then, the removal tests were performed with the rest of the wastewater samples in the same way. The results of the study are depicted in the inset of Figure 7. As shown in the figure, the approximately adsorptive character of the nano adsorbents remained intact after their repetitive usages. Indeed, the porosity of the nano adsorbents did not change during several usages, which confirms their stability and applicability.
 ZnO/GO, (b) ZnO/GO/Zeolite, (c) GO/Zeolite,(d) Zn NPs, Inset: Effect of pH on the removal of chloroform by using the different adsorbents: (a) ZnO/GO, (b) GO/Zeolite, (c) ZnO NPs and (d) ZnO/GO/Zeolite")
Regenerability of the nano adsorbents for removal of chloroform from 50 mg.dm-3 chloroform solutions after four times use (a) ZnO/GO, (b) ZnO/GO/Zeolite, (c) GO/Zeolite,(d) Zn NPs, Inset: Effect of pH on the removal of chloroform by using the different adsorbents: (a) ZnO/GO, (b) GO/Zeolite, (c) ZnO NPs and (d) ZnO/GO/Zeolite
4.7. Comparing ZnO/GO Nanocomposites with other Adsorbents
Different characteristics of the ZnO/GO nanocomposite were compared with reported adsorbents used for the removal of chloroform, and the results are summarized in Table 4 (23, 50-52). As seen, the proposed ZnO/GO had a greater maximum adsorption capacity and surface characteristics compared to the other adsorbents. The ZnO/GO showed a greater chloroform removal efficiency than the reported adsorbents. These results can be explained by the fact that both GO and ZnO have adsorption capacity toward chloroform, and GO acts as good support for dispersing ZnO NPs. Hence, the prepared nanocomposite indicated better surface characteristics and removal efficiency compared to the other adsorbents.
| Adsorbent | qmax (mg. g-1) | Specific Surface Area (m2. g-1) | Mean Pore Diameter (nm) | Pore Volume (cm3) | Chloroform Removal (%) | Ref. |
|---|---|---|---|---|---|---|
| Snow | 3.77 × 10⁻³ | - | - | - | - | (23) |
| Asf | 2.33 | 0.81 | - | - | - | (50) |
| Asf/Nitro | 9.16 | 3.11 | - | (50) | ||
| Silica loaded AC | 8.66 | - | - | - | 95 | (51) |
| AC | - | 62.348 | 61.53 | 95 | 50 | (51, 52) |
| AC/ZnO | 86.28 | 15.178 | 80.16 | 0.3 | 80.7 | (52) |
| ZnO/GO | 250 | 23.34 | 140.2 | 0.088 | 98 | This work |
Comparison of Zno/GO Characteristics with the Reported Adsorbents Used for Chloroform Removal
5. Conclusion
Different nanocomposites of ZnO-inorganic sorbents were synthesized and used for the removal of chloroform. N2-adsorption-desorption isotherms of the nanocomposites were used to essay and compare their textural properties. The results revealed that all of the synthesized nanocomposites are mesoporous. Active surface area, pore size, and pore volumes of the nanocomposites were determined using BET and BJH models. Kinetic and isotherm models of the nanocomposites also were investigated. ZnO/GO showed the best performance to remove chloroform from water samples due to its superior porosity.
