


1. Background
Organophosphates (OPPs) are toxic chemicals that can cause serious health problems through poisoning water and food. These compounds can extensively control pests; however, they also undergo fast degradation in the environment. Therefore, various types of OPPs are extensively used in agriculture (1, 2). The potential threats of increased concentration of OPPS to the environment have attracted significant attention, which has resulted in the development of sensitive and selective detection methods. OPPs are detected in real samples using various methods like gas chromatography with mass detection (GC/MS) (3, 4), high performance liquid chromatography (HPLC) (5), electrochemical techniques (6, 7), micellar electrokinetic chromatography (2), spectrophotometry (8, 9), and spectrofluorimetry (10, 11). OPPs are commonly found in real samples at low concentrations and complicated matrices. Therefore, before performing analyses, sample treatment is essential for both purification and preconcentration. In general, sample treatment and isolation of analytes from the matrix is an important step in the analytical procedure, which affects the whole analytical technique. Reduced time of sample preparation steps, the sample amount, and the consumption of hazardous reagents and solvents can increase the ease of operation and safety for the environment. Besides, it provides a green sample preparation procedure. In the past few decades, several miniaturized extraction techniques have been developed as alternatives to classical methods of sample preparation, namely liquid-liquid extraction (LLE) and solid phase extraction (SPE). However, these techniques contain disadvantages such as large consumption of time, toxic organic solvents, and sample amounts (12). The extraction strategies like solid-phase microextraction (SPME) (13) and micro solid-phase extraction (µ-SPE) (3) have been developed for sample treatment to improve the SPE method.
Besides, a number of new liquid microextraction methods are introduced as alternatives to LLE, such as dispersive liquid-liquid microextraction (DLLME) (14), hollow-fiber liquid-phase microextraction (HF-LPME) (15), and single drop microextraction (SDME) (16).
Among the different types of liquid microextraction methods, the DLLME strategy presents some appealing features such as simplicity, rapidity, and high preconcentration factor (17). In this technique, a water-immiscible organic solvent (extractant) is mixed with a dispersive solvent, which is water-miscible. The mixture is entered into an aqueous sample solution by rapid injection, forming a cloudy phase with fine droplets of the extractant (18, 19). DLLME technique has been operated via different strategies for extraction of OPPs from real matrices (4, 18, 20-26). In all of these procedures, a disperser solvent (0.5 - 1.5 mL) has been used to disperse an organic extraction solvent in the whole sample solution, which accelerates the extraction of analytes. However, the polarity of the sample solution relatively decreases in the presence of a disperser solvent, which in turn increases the solubility of lipophilic analytes in a water medium that causes decreased extraction efficiency (27). In addition, the exclusion of a disperser solvent, which is consumed in fairly larger volumes compared to an extraction solvent, will make the extraction procedure greener. Ultra-sonication (28), vortex (29), and air agitating (27) of the sample solution are proposed alternatives of the disperser solvent. Although these techniques have been successful, being time-consuming is their main drawback, particularly regarding the case of the air-agitated method.
2. Objectives
In the present study, the elimination of the disperser solvent in the DLLME procedure using a semi-soluble extraction solvent has been accomplished for the first time. Then, the proposed disperser-less DLLME (DL-LLME) technique coupled with GC/MS was exploited to separate and determine three OPPs residues, namely malathion (MT), methyl parathion (MP), and fenitrothion (FT), in various water and fruit juice samples.
3. Methods
3.1. Materials and Apparatus
All selected OPPs were purchased from Fluka, and their stock solutions in methanol (500 mg.L-1) were kept at -20°C. Deionized water was used to prepare the working solutions by step-by-step dilution of the stock solutions. All solvents, including methanol (MeOH), acetonitrile (ACN), acetone (ACT), chloroform (CLF), carbon tetrachloride (CTC), and dichloromethane (DCM), were obtained from Merck (Germany). Heidolph vortex model REAX top (Germany) and KUBOTA Centrifuge Centrifuge Model KN-70 (Japan) were used for mixing and centrifugation of the sample solutions. A Mettler TOLEDO model Seven Compact pH meter (Germany) was used to adjust the pH values.
3.2. Chromatographic Conditions
GC analysis was conducted using the Agilent 7890A instrument (Palo Alto, CA, USA) with an Agilent 5975C mass detector (electron impact (EI) mode with ionization energy of 70 eV). The temperatures of the injection port (in the splitless mode), Ion source, quadruple, and GC/MS interface were set at 250°C, 230°C, 150°C, and 280°C, respectively. An HP-5MS column (30 m × 0.32 mm) with a film thickness of 0.25 µm was used for OPPs separation. The flow rate of carrier gas helium 99.999% was 1 mL.min-1. With a solvent delay of 7 min, the total separation time was 22 min. The selected ion monitoring (SIM) mode with the m/z values of 125, 263, and 277 for MT, MP, and FT, respectively, was used for the analysis.
3.3. DL-LLME Experiments
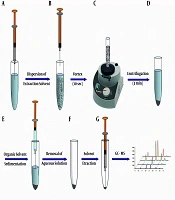
A graphical presentation of the DL-LLME strategy is displayed in Figure 1. For the extraction procedure, a 5.00 mL solution of the OPPs mixture in concentrations ranging from 0.001 to 100 µg.L-1 at pH = 2 was transferred into the conic screw-capped glass tubes. Then, 60 µL aliquots of extraction solvent (CLF) were rapidly injected into these solutions and vortexed for 5 sec to homogenize the sample solution. The obtained cloudy phase solutions were then centrifuged for 3.0 min at 5000 rpm to separate the organic phase (CLF) from the aqueous phase. The volume of the organic phase was obtained using a microsyringe. Afterward, 1 µL of the organic phase was injected into the GC/MS.

Schematic illustration of DL-DLLME procedure: A and B, injection of the extraction solvent into the aqueous sample and formation of the fine droplets of extraction solvent in the aqueous phase; C, vortexing the mixture of extraction solvent and aqueous sample for 5 sec; D, centrifugation of the mixture for 3 min; E and F, removing the aqueous phase using a syringe and obtaining the sedimented organic phase; and G, retracting the sedimented phase and injection into the GC-MS.
3.4. Real Water and Juice Samples
The tap water and the river water samples were collected from the drinking water of Ahvaz City and Karun River (Ahvaz, Khuzestan Province, Iran). Grape and apple juices were provided from local supermarkets in Ahvaz. All real samples were kept at 4°C after filtering by a 0.45 µm membrane filter. Two point five milliliter of real sample was spiked with the appropriate concentration of the standard OPPs and was diluted up to 5 mL with the deionized water. Then, the OPPs were extracted and analyzed according to the optimized procedure. Besides, non-spiked samples were subjected to the proposed method in parallel. Each experiment was carried out in triplicate.
3.5. Extraction Recovery (ER) and Enrichment Factor (EF)
The ratio of OPP concentration in the organic phase (Corg) after liquid microextraction to the initial concentration of the analyte (Caq) in sample the solution was considered as enrichment factor (EF):
It worth noting that Corg can be calculated via a standard curve, which is constructed by direct analysis of the OPPs standard solutions in CLF (0.1 - 250 µg.L-1) using GC/MS.
The percentage of the total moles of the extracted OPPs into the organic phase (norg) is called ER. This term is related to the EF via the following equation:
4. Results and Discussion
4.1. The Optimization of DL-LLME Operation Conditions
To obtain more EFs and ERs, some extraction parameters that can influence the performance of the microextraction, including pH, ionic strength, extraction solvent (type and volume), presence of disperser solvent, and centrifugation time, were investigated in details.
4.1.1. Effect of pH
The influence of the solution pH on the microextraction performance was examined in the range of 2 - 10 (5 mL of OPPs solution, 10 µg.L-1; the volume of CLF, 50 µL; 5 min centrifugation time, and without the use of disperser solvent). As shown in Figure 2A, the best value for extraction efficiency is achieved at pH = 2. The reason might be due to the existence of high concentrations of ions (H+ and Cl- ions), which increases the ionic strength of the solution leading to the extraction of target analytes into the organic extractant solvent.

Effects of: A, pH; B, type of extraction solvent; and C, volume of extraction solvent
4.1.2. Extraction Solvent: Type and Volume
An appropriate extraction solvent should have some particular properties including high density, low solubility in aqueous solution, and extraction capability for the analyte. Three solvents (namely DCM, CLF (relatively low polar solvents), and CTC (nonpolar solvent)) with high densities were chosen and compared with each other using DL-LLME (5 mL of OPPs solution, 10 µg.L-1; the volume of extraction solvent, 50 µL; pH = 2; 5 min centrifugation time, and without the use of disperser solvent). As seen in Figure 2B, the best performance was obtained with CLF. It possesses polarity index comparable with DCM (polarity index sequence: CLF (4.1) > DCM (3.5) > CTC (1.56)). However, the partial solubility of CLF (8.1 g.L-1 in 20°C) is significantly lower than DCM with 17.5 g.L-1 solubility in water, and thus, it can be dispersed in the solution, and good performance is achieved in the DL-LLME process. Cases with both more soluble solvent (DCM) and lower soluble solvent (CTC with 0.8 g.L-1 solubility) are accompanied by decreased extraction efficiency. From this observation, it can be concluded that the solubility of the extraction solvent is a more critical parameter in the DL-LLME procedure. The reason can be attributed to the lower tendency of OPPs for extraction in the presence of more soluble solvent (DCM) because of increased miscibility of the solvent with the sample solution. On the other hand, the presence of nearly insoluble solvents like CTC is associated with the immiscibility of the sample solution as well as the decreased volume of the solvent. To optimize CLF volume, further experiments were performed with various volumes (µL) within 50 - 100 range. As shown in Figure 2C, the results revealed that the best microextraction result was achieved with 60 µL CLF and this optimum volume of extraction solvent was used in subsequent experiments. In volumes lower than 50 µL, the obtained organic phase was too little. After applying larger volumes of the extractant, analytical signals were decreased, mainly due to the decreased concentrations of OPPs in the sedimented phase.
4.1.3. Presence of the Disperser on Microextraction Efficiency
The addition of 30 µL disperser solvent and its effects on the extraction performance were studied using MET, can, and ACT (as disperser) according to the optimized conditions. As displayed in Figure 3A, the best extraction efficiency was obtained in the absence of the disperser. The observations indicated that the extraction performance was considerably decreased in the presence of disperser solvent even at low volumes. This observation might be due to the decreased aqueous solution polarity. As a result, administering larger volumes of disperser (i.e., > 30 µL) was associated with considerable declines in the volume of the sedimented organic phase, which can be attributed to the increased solubility of CLF in this solution, which possesses a polarity lower than that of the solution without disperser. Consequently, when the extraction solvent contains suitable partial solubility in the aqueous sample solution, the presence of another reagent as disperser solvent causes an adverse effect on extraction efficiency, and therefore, it should be removed from the DLLME procedure.

Effects of: A, Amount of salt; B, centrifugation time; and C, type of disperser
4.1.4. Salt Addition
In some DLLME procedures, adding salt to the sample solution may enhance the efficiency of the extraction. To test the salt effect on the microextraction performance, various concentrations of NaCl in the range of 0% - 10% (w/v) were used in the DL-LLME procedure. As seen in Figure 3B, the salt addition decreased the analytical signals of OPPs. These observations can be possibly due to the increased viscosity of the sample solution and the subsequent reduction in the diffusion rate of OPPs from the aqueous solution into the organic phase (27, 30). According to the results, the subsequent experiments were carried out without adding salt (31).
4.1.5. The Centrifugation Time Effect
After injecting the extraction solvent, the mixture should be centrifuged to sediment the organic phase. Therefore, we investigated the effect of various centrifugation times (3 to 10 min) at 5000 rpm. As shown in Figure 3C, centrifugation times longer than 3 min were associated with decreased extraction efficiency as well as lower analytical signals. Moreover, in centrifugation times longer than 3 min, the sedimented organic phase volume was slightly reduced, possibly due to the higher dissolution of the organic phase in the aqueous phase in longer durations.
4.2. Method Validation
To validate the DL-LLME method, some important characteristics, including limits of quantification (LOQ) and detection (LOD), precision, accuracy, ER, EF, and linear dynamic range (LDR), were considered. The calibration curves were constructed by analyzing standard OPPs solutions at selected levels ranging from 0.001 to 100 µg.L-1. The regression coefficients (R2) were used to evaluate the linearity goodness of the standard curves. The LODs (0.0003-0.001 µg.L-1) and LOQs (0.001 - 0.003 µg.L-1) were obtained using signals of known concentrations of OPPs solutions based on signal to noise ratios of 3 and 10, respectively. Two LDRs were achieved for all selected OPPs in this method, and good linearity was observed with correlation coefficients greater than 0.9970. The features of the analytical strategy are provided in Table 1. To obtain the precision and accuracy of values, the quality control (QC) samples (0.05, 5, and 50 µg.L-1) were analyzed in five runs (on the same day) and on three consecutive days. The results (Table 2) indicated the good reproducibility of the method with the relative standard deviations (RSD %) in the ranges of 2.5% - 9.3% (intra-day precision) and 3.5% - 10.0% (inter-day precision).
| Pesticide | LOD | LOQ | LDR1A | R12B | LDR2C | R22D | EFE | ERF |
|---|---|---|---|---|---|---|---|---|
| Fenitrothion | 0.0003 | 0.0010 | 0.001 - 0.1 | 0.9992 | 0.1 - 100 | 0.9977 | 173 ± 17 | 69 ± 5 |
| Methyl parathion | 0.0010 | 0.0030 | 0.003 - 0.1 | 0.9986 | 0.1 - 100 | 0.9970 | 238 ± 10 | 95 ± 4 |
| Malathion | 0.0010 | 0.0030 | 0.003 - 1 | 0.9997 | 1 - 100 | 0.9978 | 153 ± 24 | 61 ± 6 |
| s | AddedA | FoundB | RecoveryC | RSD% | |
|---|---|---|---|---|---|
| Intra-day (N = 5) | Inter-day (N = 3) | ||||
| Fenitrothion | 0.050 | 0.045 | 90.0 | 7.4 | 9.1 |
| 5.000 | 4.730 | 94.6 | 3.2 | 5.4 | |
| 50.000 | 48.834 | 97.7 | 2.5 | 3.5 | |
| Methyl parathion | 0.050 | 0.046 | 92.0 | 9.3 | 10.0 |
| 5.000 | 5.231 | 104.6 | 4.8 | 6.1 | |
| 50.000 | 51.720 | 103.4 | 3.4 | 4.1 | |
| Malathion | 0.050 | 0.044 | 88.0 | 8.4 | 9.5 |
| 5.000 | 4.679 | 93.6 | 4.1 | 6.7 | |
| 50.000 | 49.102 | 98.2 | 3.1 | 4.9 | |
Relative Recoveries and RSDs% for QC Samples on Three Spiked Standard Levels of OPPs in Deionized Watera
4.3. Real samples Analysis
To assess the capability of the proposed method to extract and determine the OPPs in real matrices, the water and juice samples were analyzed by the optimized analytical procedure. Matrix effect can be used to compare the response of the detector signal for the analytes in real and solvent sample solutions (26). At first, the matrix-matched calibration curves were obtained in order to attain accurate results and determining the extent of matrix effects. These curves were constructed using the solutions containing the real samples fortified with standard OPPs, and their analytical features were compared to external calibration curves. According to the findings, their slopes were significantly different (> ± 20%). Therefore, the concentrations of OPPs in the spiked real sample solutions were obtained from the matrix-matched calibration curves. Afterward, the water and juice samples were spiked with OPPs at the levels of 0.5, 5, and 50 µg.L-1 to calculate the recovery data and to test the reliability of the method. The results of the analysis of the real sample (after subjection to the optimized procedure) are provided in Table 3. As shown, the recoveries (84% - 108 %) are in the acceptable range, and it can be concluded that the developed method can be successfully exploited for the real samples analysis with suitable accuracy (-20% to +20%). The typical GC/MS chromatograms obtained from water and juice samples (spiked with 5 µg.L-1 of each OPP) are illustrated in Figure 4.
| Sample | AddedA | Fenitrothion | Methyl Parathion | Malathion | |||
|---|---|---|---|---|---|---|---|
| FoundB | Recovery, %C | Found | Recovery, % | Found | Recovery, % | ||
| River water | 0 | 1.26 | - | 1.21 | - | 0.38 | - |
| 0.50 | 0.46 | 92.0 | 0.47 | 94.0 | 0.54 | 108.0 | |
| 5.00 | 5.35 | 106.4 | 4.89 | 97.8 | 4.72 | 94.4 | |
| 50.00 | 51.49 | 103.0 | 48.47 | 96.9 | 49.76 | 99.5 | |
| Tap water | 0 | 0.12 | - | 0.12 | - | 0.07 | - |
| 0.50 | 0.42 | 84.0 | 0.43 | 86.0 | 0.47 | 94.0 | |
| 5.00 | 5.15 | 103.0 | 5.11 | 102.2 | 4.91 | 98.2 | |
| 50.00 | 50.54 | 101.1 | 48.33 | 96.66 | 51.34 | 102.7 | |
| Grape juice | 0 | 0.14 | - | 0.08 | - | 0.24 | - |
| 0.50 | 0.47 | 94.3 | 0.54 | 107.4 | 0.45 | 89.8 | |
| 5.00 | 5.25 | 104.9 | 4.86 | 97.2 | 4.76 | 95.2 | |
| 50.00 | 49.61 | 99.2 | 49.35 | 98.7 | 48.71 | 97.4 | |
| Apple juice | 0 | 0.61 | - | 1.56 | - | 0.99 | - |
| 0.50 | 0.54 | 107.3 | 0.53 | 105.6 | 0.46 | 91.7 | |
| 5.00 | 4.88 | 97.6 | 4.72 | 94.3 | 5.22 | 104.3 | |
| 50.00 | 49.78 | 99.6 | 49.77 | 99.5 | 48.30 | 96.5 | |
Investigation of Matrix Effect in the Spiked Real Samples with the Proposed Method (All Real Samples Were Diluted with Deionized Water at a Ratio of 1:2)a

The typical chromatograms of: A River water; B, apple juice; C, grape juice, and tap water samples after being spiked with OPPs at 5 µg.L-1.
4.4. Comparison of DL-LLME with the Other Techniques
The analytical performances of the developed DL-LLME strategy in comparison with some published DLLME techniques for the extraction and analysis of OPPs are presented in Table 4. As mentioned before, in the present study, the LOQs, LODs, and RSDs % were better or comparable to the currently available alternatives.
| Method | Matrix | LDR, µg.L-1 | LOD, ng.L-1 | Extraction time, min | Recovery, % | References |
|---|---|---|---|---|---|---|
| DLLME-SFO/HPLC-UV a | Summer crops | 5 - 800b | 1000 - 4000b | 10 | 88 - 110 | (20) |
| NHS-DLLME/GC-MSc | Water | - | 3.3 - 8.0 | 10 | 50 - 91 | (25) |
| ET-DLLME/GC-FIDd | Water-juice | 2 - 1000 | 0.82 - 2.72 | > 9 | 75 - 99 | (4) |
| UA-DLLME/S-MEKCe | Medicinal plants | 25 - 2500b | 2000 - 8000b | > 6 | 83 - 122 | (2) |
| DLLME/UPLC-MS/MSf | Wine and beer | 0.1 - 100 | 0.48 - 18.8 | 4 | 76 - 122 | (1) |
| DLLME-GC/MS | Fruit, vegetables and herbal medicines | 0.1 - 1000 | 0.02 - 0.23 | > 9 | 70 - 119 | (21) |
| DL-DLLME-GC/MS | Water and juice | 0.001 - 100 | 0. 3 - 1 | ~3 | 84 - 108 | Present work |
Comparison of the Current Method with the Some Reported Studies in OPPs Detection
5. Conclusions
The current study presented a simple, rapid, and environment-friendly strategy with satisfactory EFs and ERs, namely DL-LLME. A highly sensitive and selective methodology was obtained by the coupling of the DL-LLME procedure by the GC/MS method. The analytical features of the presented microextraction procedure, such as LOQs, LODs, and RSDs % were found to be comparable or better than the other strategies for the analysis of OPPs. As seen, for this work, the exclusion of disperser solvent and too short extraction time (< 4 min) are two main advantages of this method over the other compared protocols, which could significantly improve EFs, rapidity, and greenness of the process.
