1. Background
Colorectal cancer (CRC) is currently second-lethal cancer and the third most common cancer, with an incidence of almost 2 million new cases in 2020, estimated to reach 3.2 million in 2040 (1, 2). Cancer is a multifactorial disease; both host genetics and environmental factors are involved in CRC development. The gut microbiome, known as the forgotten organ, makes up about 70% of the microorganisms present in the host body. The host microbiome has been shown to play a critical role in the incidence and progression of cancer (3-5). Intestinal microbiome imbalance, known as dysbiosis, can increase chronic inflammation conditions and the production of carcinogenic metabolites and lead to intestinal neoplasia. The microbial composition and diversity of the gut are formed during the first years of life. This microbial composition is affected by environmental factors such as age, sex, race, immune system, diet, antibiotic use, exposure to chemicals, and exposure to vaginal microbes during childbirth, etc. (6, 7). This microbial composition can constantly change under the influence of lifestyle and the accumulation of host mutations (8). Generally, most CRC cases (~75%) are sporadic and occur in individuals without a genetic predisposition or family history of CRC (9); thus, environmental factors play a vital role in CRC compared to genetic factors (10).
Most gut bacteria are unusual bacteria and cultivated and isolated with difficulty; thus, limited relevant knowledge is available. However, over the past decade, the advent of next-generation sequencing (NGS) methods has led to metagenomic studies using 16S ribosomal RNA (rRNA) sequencing to identify the diversity and abundance of microbes in different parts of the body without microbial culture (11, 12). Most of the studies have investigated the gut microbiome composition and diversity through the analysis of fecal samples in CRC patients. In addition, the mucosa-associated microbiome interacts directly with epithelial cells and host immunity (13). Pathogenic bacteria in the mucosal epithelium play an important role in host pathogenesis, and CRC tissue shows greater microbial diversity than fecal samples (14). Studies have shown almost different results from the colon microbiome in CRC patients due to the complexity of the intestinal microbiome (15), differences in mucosal (16, 17) or fecal samples (18-20), and geographical (21) and ethnic differences (22); therefore, further studies are required to fully understand the composition and diversity of the colon microbiome among healthy control individuals and CRC patients. Most previous studies have shown that intestinal flora is significantly less abundant in the CRC group than in the healthy control group.
In CRC patients, while beneficial bacteria decrease, pathogenic bacteria increase. For example, some pathogenic bacteria, such as Fusobacterium, Prevotella, Staphylococcus, and Leptotrichia, are detected in the gut of CRC patients, while Bifidobacterium, Lactobacillus, Ruminococcus, and Bacillus genus are poor (16, 18, 20, 23, 24). Interestingly, a new study reported an increase in microbial diversity in CRC patients compared to healthy controls, with the 2 Chao1 and Shannon indices of alpha diversity (25). We hypothesized that the number of sequencing readings could affect the results of microbial diversity between CRC patients and healthy controls. A recent study (26) compared the gut microbiome of Iranian and Finnish origin on fecal samples between CRC patients and healthy individuals. Gender is an influential factor in the composition and diversity of the gut microbiome (27), though little research has been done on the microbiome differences between male and female CRC patients. Recent studies have emphasized that geographical location (host location) (21) and ethnicity (22) have the most substantial effect on gut microbiome variations. The gut microbiome has rarely been studied in Iran, but the colon mucosal microbiome of CRC patients has not been studied. The present study can provide new information on the composition and diversity of the colon mucosal microbiome of CRC patients in Iran.
2. Objectives
This study aimed to evaluate the differences in bacterial communities between CRC patients and healthy controls based on gender through high-throughput 16S rRNA sequencing.
3. Methods
3.1. Sampling and Total DNA Extraction
A case-control study was conducted in Imam Ali Research Hospital, affiliated with Zahedan University of Medical Sciences, between June 2019 and January 2020. Biopsy samples were obtained from 17 CRC patients and 13 healthy controls who had undergone colonoscopy for other reasons and had no CRC or any pre or neoplastic lesions. The mean diameter of biopsy samples was ≥ 5 mm. Biopsy samples were then transferred to a refrigerator at -20°C for further analysis. The exclusion criteria were as follows: (1) inflammatory bowel disease, (2) irritable bowel syndrome, (3) familial or hereditary colorectal adenoma or tumor, and (4) the use of antibiotics and probiotic products within 2 months before sampling (16, 20). According to the manufacturer’s instructions, DNA from biopsy samples was extracted using the NucleoSpin Microbial DNA Mini Kit (MN, Germany). DNA quality and quantity were determined and stored at -20°C for subsequent analysis.
3.2. Amplification of 16S rRNA Gene
Microbial DNA was amplified by polymerase chain reaction (PCR) using 515F (GTGCCAGCMGCCGCGGTAA) and 806R (GGACTACHVGGGTWTCTAAT) primers (28) (metabion, Germany) to target the V4 region of 16S rRNA genes. Amplification was performed in triplicate; that is, each sample was amplified in 3 separate 25 μL reactions, and then the amplicons were mixed for each sample. PCR was performed with the following condition (29): initial denaturation at 94°C for 3 minutes, followed by 35 cycles of denaturation at 94°C for 1 minute, annealing at 55°C for 1 minute, and extension at 72°C for 1 minute, as well as a final extension at 72°C for 10 minutes. The PCR products of 3 reactions were mixed, run on 2% agarose gel electrophoresis, and then purified (Expin PCR SV-mini, Gene All); 50 μL of the PCR products in the DNAstable tubes were sent to Macrogen Company (South Korea) for high-throughput sequencing on the Illumina MiSeq platform.
3.3. Library Construction and Sequencing
Samples that passed quality control (QC) were used to construct libraries. Random fragmentation of DNA samples was used to create the sequencing library, followed by 5' and 3' adapter ligation. Following that, adapter-ligated fragments were PCR amplified and gel purified. The library was put into a flow cell, and fragments were collected on a lawn of surface-bound oligos that were complementary to the library adapters. Using bridge amplification, each fragment was amplified into different clonal clusters. The templates were prepared for Illumina sequencing technology following the completion of cluster production. For analysis, the sequence data were converted to raw data.
3.4. Bioinformatics Sequencing Data Analysis
The QIAGEN CLC Genomics Workbench version 21.0.4 with the Microbial Genomics Module plugin was used to analyze the bacterial 16S sequencing data. Raw sequence data in options of Paired-end were filtered with readings of 200 to 550 lengths. The adapter trimming process was performed on Illumina sequences. A list of samples with high coverage was prepared; then, the samples were filtered based on the number of reads less than 100 and 50, the minimum percentage from the median. The filtered reads were clustered into operational taxonomic units (OTUs) with 97% sequence similarity (30). The OTU output contains the abundance of sequences clustered with OTUs from the annotated reference database and shows the community composition of each sample at various classification levels of phylum, class, order, family, genus, and species.
3.5. Diversity Analysis
Alpha diversity estimates describe the number of species in a single group (31), while beta diversity estimates describe differences in species diversity between groups. To estimate alpha and beta diversities, a phylogenetic tree was reconstructed using a maximum likelihood approach based on a Multiple Sequence Alignment (MSA) of the OTU sequences, including the 100 most abundant OTUs, generated by MUSCLE (MUltiple Sequence Comparison by Log- Expectation). Alpha diversity was calculated using the total number, Chao1 bias-corrected, Chao1, Shannon, and Simpson indices to examine differences in bacterial diversity between groups (32). In addition, phylogenetic diversity was evaluated among all groups. Using the Kruskal-Wallis test (33), the microbial abundance and diversity were evaluated between different groups. Principal coordinate analysis (PcoA) was used for beta diversity analysis on UniFrac distances to better understand species diversity between samples. UniFrac is a beta diversity measure that uses phylogenetic information to compare environmental samples (34).
4. Results
4.1. OUT Analysis
A total of 9 119 715 high-quality 16S rRNA gene sequences were obtained from 30 samples, with a median read count of 298,480.5 (ranging from 24,8624 to 369,700) per sample. OTUs were clustered at the 97% similarity level, resulting in a total of 4322 OTUs, which remained 2708 by filtering OTUs with a frequency of less than 10. In CRC patients and healthy controls, the number of OUT was 2563 and 1839 OTUs, respectively.
4.2. Diversity in CRC and Healthy Controls
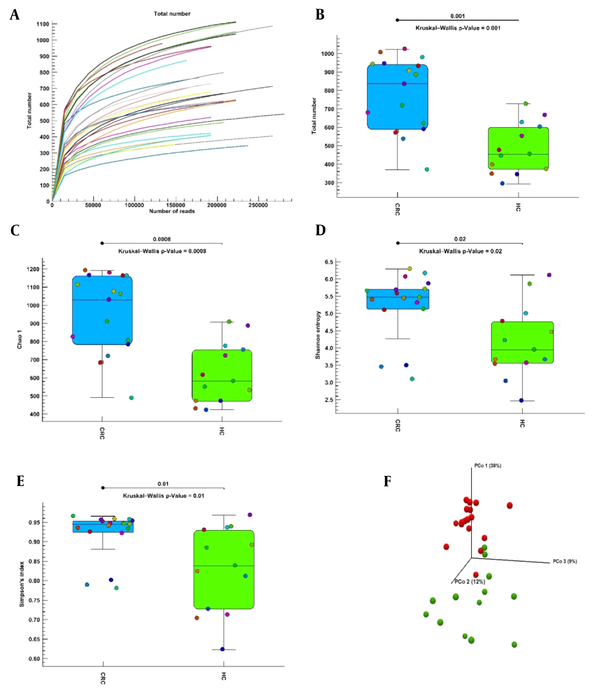
The alpha diversity curve is flattened to an acceptable value, indicating that the sample sequencing is sufficient; that is, as the number of reads increases, the total number index does not change significantly (Figure 1A). Alpha diversity was calculated with the total number, Chao1, Shannon entropy, and Simpson indices to evaluate the difference in bacterial diversity and richness between the CRC and healthy control groups. Alpha diversity showed significant differences with the total number (Figure 1B), Chao1 (Figure 1C), Shannon entropy (Figure 1D), and Simpson (Figure 1E) indices in bacterial diversity and richness between the CRC and healthy control groups. Phylogenetic measurement of alpha diversity (Figure 1E) showed a significant difference in diversity between the CRC and healthy control groups. The CRC group had more diversity than the healthy control group in all alpha diversity indices. Beta diversity of CRC and healthy control groups was calculated using unweighted UniFrac distance matrices by PcoA (35). The unweighted PCoA plots revealed a separation of the 2 groups (Figure 1F). CRC samples were clustered together; in contrast, the samples of healthy controls were scattered far from the CRC samples. Permutational multivariate analysis of variance (PERMANOVA) analysis (Unweighted UniFrac) confirmed that the colon microbiome differed significantly between the CRC and healthy control populations (P = 0.00001).
Alpha and beta diversities in colorectal cancer and healthy control groups. (A) The dilution curve of the alpha diversity based on the total number index. (B-E) Alpha diversity indices boxplot between the colorectal cancer and healthy control groups. (F) Three-dimensional diagram of principal coordinates analysis, each dot represents a sample, and each color represents a group: red for the colorectal cancer group and green for the healthy control group. Abbreviations: CRC, colorectal cancer; HC, healthy control; PcoA, principal coordinate analysis.
4.3. Microbiome Composition in the CRC and Healthy Control Groups
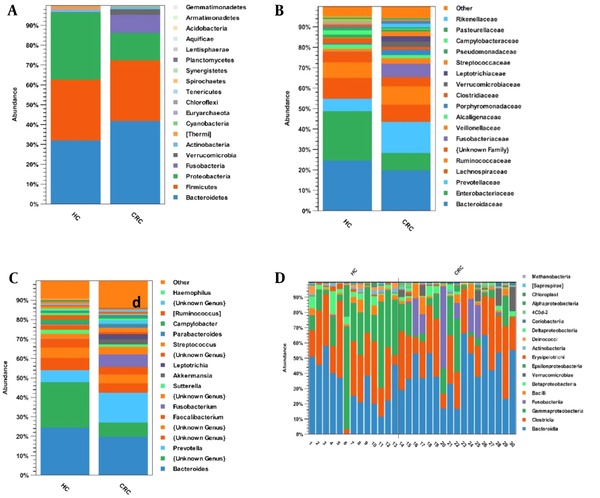
The dominant phyla in the healthy control and CRC groups were Bacteroidetes (32% and 42%), Firmicutes (31% and 31%), Proteobacteria (34% and 14%), and Fusobacteria (0.001% and 9%) (Figure 2A). At the family level, Prevotellaceae (15% vs. 6%), Fusobacteriaceae (7% vs. 0.001%), and Verrucomicrobiaceae (3% vs. 0.00005%) were significantly enriched in the CRC group compared with the healthy control group (Figure 2B). Six genera were significantly higher in the CRC group vs. the healthy control group, including Prevotella (15% vs. 6%), Fusobacterium (7% vs. 0.001%), Akkermansia (3% vs. 0.00005%), Leptotrichia (3% vs. 0.0001%), Streptococcus (2% vs. 0.004%), and Parabacteriode (2% vs. 0.005%), while 4 genera Bacteroides (20% vs. 25%), Enterobacteriaceae (unknown genus; 7% vs. 23%), Ruminococcus (0.001% vs. 2%), and Campylobacter (0.002% vs. 2%) were decreased compared with the healthy control group (Figure 2C). Figure 2D shows the relative abundance of different bacteria for 13 healthy samples and 17 CRC samples at the class level.
The relative abundance of microbial composition in the colorectal cancer and healthy control groups at 3 levels: (A) phylum, (B) family, and (C) genus. (D) The relative abundance of different bacteria for 13 healthy samples and 17 patient samples at the class level. Abbreviations: CRC, colorectal cancer; HC, healthy control.
4.4. Diversity in the CRC and Healthy Control Groups Based on Gender
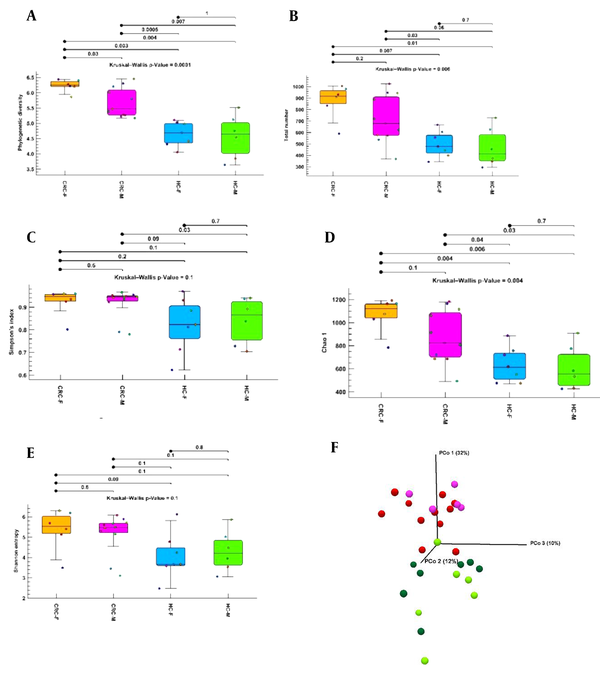
Phylogenetic diversity, total number, Chao1, Shannon entropy, and Simpson indices were evaluated between the healthy control male (healthy control-M) and healthy control female (healthy control-F), healthy control-M and CRC-M, healthy control-M and CRC-F, healthy control-F and CRC-M, healthy control-F and CRC-F, CRC-M and CRC-F groups (Figure 3A-E). Significant differences were observed between the CRC and healthy control groups in both sexes. Alpha diversity with Shannon entropy and Simpson index did not reveal a significant difference between the groups. Of course, a significant difference was not found between the 2 sexes in the CRC or healthy control groups. At the species, genus, family, and class levels, the total number index of alpha diversity was higher in the CRC-F group than in the CRC-M group. The phylogenetic diversity and Chao1 bias-corrected indexes showed that alpha diversity of the CRC-F group were significantly higher than the CRC-M group. The results indicated that the richness and diversity of group CRC-F were significantly more than other groups, especially more than the healthy control-F group. In addition, we found more diversity in the healthy control-F group than in the healthy control-M group, but the difference was not statistically significant. The results of beta diversity using unweighted UniFrac distance matrices by PCoA analysis showed a separate distribution of microbial communities among most groups (Figure 3F).
Alpha and beta diversities between the colorectal cancer female, colorectal cancer male, healthy control female, and healthy control male groups. (A-E) Phylogenetic diversity, total number, Chao1, Shannon entropy, and Simpson indices boxplot between groups. (F) Three-dimensional diagram of principal coordinate analysis; each dot represents a sample, and each color represents a group: pink for the colorectal cancer male group, red for the colorectal cancer male group, bold green for the healthy control female group, and light green for the healthy control male group. Abbreviations: CRC-F, colorectal cancer female; CRC-M, colorectal cancer male; HC-F, healthy control female; HC-M, healthy control male; PcoA, principal coordinate analysis.
4.5. Microbiome Composition in the CRC and Healthy Control Groups Based on Gender
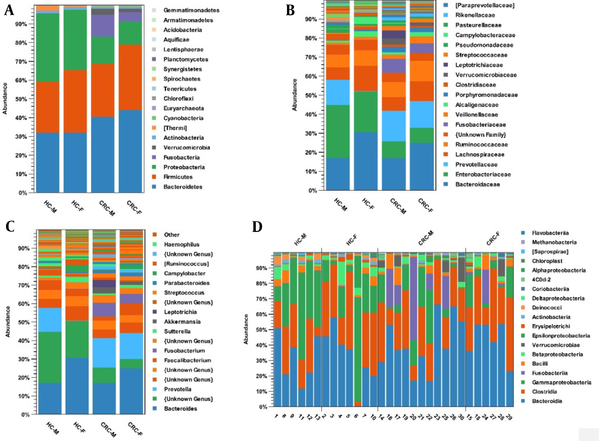
The microbial composition was compared in 4 groups: CRC-F, CRC-M, healthy control-F, and healthy control-M. Phyla Bacteroidetes (44%) and Firmicutes (35%) increased in the CRC-F group compared with the other groups. Proteobacteria (36%) and Actinobacteria (2%) phyla were more common in the healthy control-M group; Fusobacteria (12%) and Verrucomicrobia (3%) were enriched in the CRC-M group compared to the other groups (Figure 4A). At the family level, Ruminococcaceae (11%) and Veillonellaceae (14%) were overpresented in CRC-F group; while five families of Prevotellaceae (16%), Fusobacteriaceae (7%), Leptotrichiaceae (4%), Verrucomicrobiaceae (3%), and Porphyromonadaceae (3%) were enriched in the CRC-M group. Results indicate that Prevotellaceae (0.002%) in the healthy control-F group and Fusobacteriaceae (0.001%, 0.001%) in both healthy control-F and healthy control-M groups were significantly decreased (Figure 4B). Genera Faecalibacterium, Megamonas, and Klebsiella were overrepresented in the CRC-F group (Figure 4C). Figure 4D shows the relative abundance of different bacteria for 13 healthy samples and 17 patient samples based on sex at the class level.
The relative abundance of microbial composition in the colorectal cancer and healthy control groups based on gender at 3 levels: (A) phylum, (B) family, and (C) genus. (D) The relative abundance of different bacteria for 13 healthy samples and 17 patient samples based on sex at the class level. Abbreviations: CRC, colorectal cancer; HC, healthy control.
5. Discussion
Our study showed depth sequencing of 16S rRNA, providing comprehensive information on the colon microbiome. According to the results, it was found that the alpha diversity of the colon microbiome was significantly higher in the CRC group than in the healthy control group. A study (25) showed that alpha diversity, assessed by the Chao1 index or Shannon index, was higher in the CRC group than in the control group. Most available studies have reported that the alpha diversity of intestinal flora is significantly lower in the CRC group than in the healthy control group (16, 18, 20, 23, 24). In a study with a median read count of 63,475 reads per sample, Wu et al reported that they found no significant differences in alpha diversity between different groups (36). Sequencing in these studies was done with less depth; thus, the number of 16S rRNA reads was reduced to an average of less than 30 000 per sample. In contrast, the average read for the samples of this study was about 304,000 reads per sample. It is worth noting that the different reads between our study and previous studies may have led to different results.
Our results showed that Firmicutes, Proteobacteria, and Fusobacteria were the most abundant bacteria at the phylum level. Our findings indicated that the abundances of Bacteroidetes and Fusobacteria were significantly higher in the CRC group at the phylum level; on the other hand, Proteobacteria were higher in the healthy control group. Our results are similar to the study by Yang et al. They reported that Bacteroidetes and Proteobacteria were more common phyla in the CRC group (18). In addition, our findings contradict some previous studies; they have reported that Bacteroides have more relative abundance in the CRC group and Proteobacteria have less relative abundance (19, 20, 37). Proteobacteria with oxygen consumption and the reduced potential of oxidation play an important role in the gut preparation for colonization by strict anaerobic conditions for healthy gut function (38).
Our result showed that Prevotella, Fusobacterium, Akkermansia, Leptotrichia, Streptococcus, and Parabacteroides increased, while Bacteroides, Ruminococcus, and Campylobacter decreased in the CRC group compared with the healthy control group. In other studies similar to our results, Prevotella (39, 40), Fusobacterium (19, 25, 36, 39, 41), Akkermansia (19, 42, 43), Leptotrichia (39, 43, 44), Streptococcus (20, 25, 39), and Parabacteroides (19) increased relative abundance in the CRC group. According to our findings, the abundance of Fusobacterium was significantly higher in the CRC group than in the healthy control group. The association between Fusobacterium and CRC progression has been well studied (24, 45-51). Similarly, with these studies, Fusobacteria was overrepresented in our CRC group. Studies have shown that F. nucleatum can lead to the activation of Wnt/B-catenin signaling and the production of an inflammatory and carcinogenic response due to its ability to bind to E-cadherin on the surface of colon cells through FadA adhesion (49, 52).
Prevotella enrichment in the colon is linked with elevated interleukin (IL)-17 (53) and IL-9 (54), producing cells in the mucosa of CRC patients. Studies have shown that the abundance of Streptococcus in CRC tissues is higher than in adjacent non-cancerous tissues (40). Based on this evidence, it is hypothesized that Streptococcus may be involved in the development of CRC. Some bacteria are more adaptable to the microenvironment of the tumor and may be enriched to inhibit CRC (55), suggesting that these bacteria are a viable option for therapeutic purposes against CRC. A recent study in Malaysia (2021) identified A. muciniphila and F. nucleatum as 2 of the 4-bacteria biomarker panel of CRC (42). Akkermansia muciniphila has been shown to enhance immunotherapeutic therapy based on programmed death 1 (PD-1) against CRC (56). Due to the probiotic effect and enrichment of this bacterium in the colon of CRC patients, it is suggested to be further studied as an anticancer probiotic. There are no reports that Leptotrichia and Parabacteroides can promote or inhibit CRC.
In comparison between males and females, our data showed that the CRC-F group’s bacterial community richness and diversity were significantly more than other groups. In addition, we found that microbiome richness and diversity of group CRC-F were significantly more than other groups. Some human studies have shown sex-related differences in the gut microbiome (57-62). Genera Prevotella and Akkermansia were overrepresented in the CRC-M group and were underrepresented in the healthy control-F group. In 2019, a study in Japan found that Akkermansia is more common in females and Prevotella in males (62). The reason for the difference between the present results and the study mentioned is that they were taken from the fecal, and only healthy individuals were studied. The result showed that Faecalibacterium, Megamonas, and Klebsiella were overrepresented in the CRC-F group. However, these findings suggested that these types of bacteria might be associated with the clinicopathological features of CRC patients.
To the best of our knowledge, previous studies have rarely examined the sexual composition between CRC and healthy groups. In contrast to a previous study (36), it was observed a higher amount of the phylum Fusobacteria in the CRC-M group than in the CRC-F group. It is suggested that some factors, including sex hormones, drugs, diet, and body mass index, may play a role in the difference in microbiome composition between males and females (27, 57, 63, 64). In previous studies, the interaction between estrogen of sexual hormones and alpha diversity of the gut microbiome has been suggested. Drugs that affected sex hormones, for example, anti-androgen-based oral contraceptives, altered the gut microbiome (65). In addition, dietary fiber is the main source of fermentation used by the gut microbiome, which can have a specific sexual effect. Fiber can alter the gut microbiota by affecting systemic estrogen levels (59).
This is the first study on the colon microbiome associated with CRC mucosa in the Iranian population. One of the limitations of this study was the small number of samples, the lack of access to the diet of the subjects, and the uncertainty of the stage of CRC in patients; however, the advantage of this study was the 16S deep sequencing, which led to unique results on microbiome composition and diversity based on gender. It is suggested that future studies be performed with a larger study population and that various factors such as diet and stage of CRC be examined to obtain a complete view of the composition and diversity of the colon microbiome in CRC patients.
5.1. Conclusions
In conclusion, this study described differences in the diversity and composition of the colon microbiome in colon cancer based on gender, suggesting a contribution of the microbiome in the development and progression of CRC. Furthermore, our data displayed high bacterial diversity and richness in CRC patients, specifically in women with CRC. The relative abundance of A. muciniphila as a probiotic in tumor tissue in CRC patients compared with healthy individuals could possibly play a therapeutic role in controlling cancer progression.


