


1. Background
Acute Respiratory Infections (ARIs) are the major cause of morbidity and mortality in children under the age of five, with developing countries having the highest number of deaths (1, 2). Various pathogens, including bacteria and viruses, can cause ARIs. The most common viruses that cause ARI are Respiratory Syncytial Virus (RSV), adenovirus (ADV), influenza virus A/B (FluA/B), and parainfluenza viruses (1, 3, 4). Parainfluenza Viruses (PIVs) can cause various respiratory infections, ranging from mild upper respiratory illnesses in healthy adults to croup, bronchiolitis, pneumonia in infants and children, and severe lower respiratory infections in elderly and immunocompromised people (3). In China, Parainfluenza Virus type 3 (PIV3) is the most virulent of the four PIV serotypes, accounting for 60 - 70% of primary PIV infections, and the PIV3 infection frequency is approximately 2.56 – 10.9% (1, 4-6).
Bacterial and viral co-infections are becoming more widely recognized as possible causes of ARIs (7, 8). The potential pathogens are numerous, but improved detection methods have allowed for increased detection, resulting in greater epidemiological understanding. Also, PIVs were commonly co-infect with other respiratory pathogens in all PIV types, and PIV4 co-infection has been reported in previous research (6, 9). The role of PIV3 co-infection in the pathogenesis of ARIs is unknown; additionally, the possible impact of age, gender, and seasonality on the prevalence of co-infections is unknown.
2. Objectives
This study aimed to estimate the prevalence of PIV3 co-infections in hospitalized children and assess the co-infections' role in ARI patients with PIV3 infections.
3. Methods
3.1. Patient Selection
From January 2018 to December 2021, children hospitalized with ARIs in the Maternal and Child Health Hospital of Hubei Province were enrolled retrospectively in this study. Children with respiratory tract infection signs and symptoms (e.g., coughing, fever, nasal obstruction, and sneezing) or lower respiratory infection signs (e.g., tachypnea, dyspnea, or wheezing/rales upon auscultation) were classified as having ARI. Some digital clinical data were analyzed, including demographic, epidemiological, diagnostic, and laboratory data.
3.2. Laboratory Tests
3.2.1. Respiratory Virus Detection
We tested for PIV1–3 and four other common respiratory viruses, ADV, FluA/B, and RSV, using direct immunofluorescence assays (D3 Ultra DFA Respiratory Virus Screening and Identification Kit, Diagnostic Hybrids, Inc., USA). The kit comprised a DFA screening reagent that contained a mixture of Murine Monoclonal Antibodies (MAbs) directed against seven respiratory viruses. The DFA screening reagent is introduced to the specimens to assess the presence of viral antigens. The stained cells were rinsed with the diluted Wash Solution after incubation at 35°C to 37°C. A drop of the provided Mounting Fluid was poured, and the prepared cells were covered with a coverslip. The cells were inspected using a fluorescent microscope. When stained with the DFA screening reagent, virus-infected cells would show viral-specific apple-green fluorescence, whereas non-infected cells would show no fluorescence but would be stained red by the Evans Blue counter-stain.
3.2.2 Mycoplasma pneumoniae Detection
Passive particle agglutination kits (SERODIA®-MYCOII; Fujirebio Inc., Japan) were used to evaluate specific Mycoplasma pneumoniae antibodies. The kit detects a wide range of antibodies against M. pneumoniae but mostly detects IgM; therefore, its sensitivity is substantially higher than that of a single antibody test. The sera were serially diluted to 1:20, 1:40, 1:80, and 1:160, then co-incubated with sensitized gelatin particles in U-shaped 96-well microtiter plates to generate final dilutions of 1:40, 1:80, 1:160, and 1:320, mixed thoroughly, and stored at room temperature for three hours. An M. pneumoniae co-infection was defined as single titers of serum M. pneumoniae antibody ≥ 1:320 or seroconversion (increased antibody titers ≥ 4 folds) (10).
3.2.3. Microbial Culture and Identification
Evidence of bacterial co-infections was obtained from sterile or nonsterile sites, including bronchoalveolar lavage, sputum, and nasopharyngeal swabs. Microbial culture and identification were performed following routine diagnostic standard operating procedures in this hospital's clinical laboratory. Bronchoalveolar lavage and/or sputum were collected and cultured from patients with suspected ARI. A blood plate, a chocolate plate, and a MacConkey plate were used to inoculate the samples. Then, the blood plate and chocolate plate were incubated for 72 hours or until a positive result was observed in a carbon dioxide incubator with a concentration of 5%-10%, and the MacConkey plate for 24 - 48 hours in an incubator at 35 - 37°C. Bruker Matrix-assisted Laser Desorption Ionization-Time of Flight (MALDI-TOF) mass spectrometry was used to identify positive cultures to the species level (Bruker Daltonik GmbH, Leipzig, Germany).
3.3. Exclusion Criteria
Exclusion criteria were as follows: (1) patients with chronic pulmonary disease that might affect the chest X-ray results, aspiration pneumonia, or interstitial lung disease, (2) patients with compromised immune systems or those taking immunosuppressive medications, (3) patients with suspected hospital-acquired infection or fungal infection, and (4) patients with insufficient clinical information.
3.4. Statistical Analyses
We used SPSS v21.0 software for statistical analysis (SPSS, Inc., Chicago, IL, USA). Chi-square or Fisher's exact tests were used to compare frequency distributions across groups. The independent sample t-test was used to analyze quantitative data with a normal distribution. The data are expressed as the mean ± standard deviation. A P-value ≤ 0.05 was considered statistically significant.
4. Results
4.1. Frequency and Constituent Ratios for Parainfluenza Virus Type 3 Co-infections
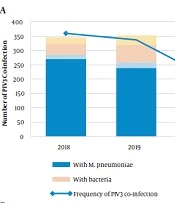
During the study period from 2018 to 2021, 2,539 patients were hospitalized with ARI caused by PIV3. Of them, 34.0% (864/2539) had co-infections with other pathogens, and 2.4% (62/2539) were co-infected with more than two pathogens. Also, M. pneumoniae was the most common co-infecting pathogen (71.3%, 616/864), followed by other bacteria (13.3%, 115/864) and viruses (8.2%, 71/864). Figure 1 shows the co-infection rate for PIV3 and the constituent ratio of co-infecting pathogens for each year. The co-infection rate for viruses increased from 4.3% in 2018 to 5.4% in 2019, 18.2% in 2020, and 24.0% in 2021.
 Frequency of PIV3 co-infection; (B) Constituent ratio of PIV3 co-infection")
(A) Frequency of PIV3 co-infection; (B) Constituent ratio of PIV3 co-infection
4.2. Respiratory Pathogens Co-infected with Parainfluenza Virus Type 3
In the viral co-infection cohort, the most frequently co-detected virus was RSV (60.6%), followed by PIV1 (25.4%), ADV (9.9%), FluB (2.8%), and PIV2 (1.4%). In the bacterial co-infection cohort, the most frequently co-detected bacteria were Streptococcus pneumoniae (51.3%), followed by Haemophilus influenzae (20.9%), Staphylococcus aureus (20.9%), Klebsiella pneumoniae (6.1%), and Legionella pneumophila (0.8%). The three most common co-infections with more than two pathogens were M. pneumoniae + S. pneumoniae (35.5%), M. pneumoniae + RSV (14.5%), and M. pneumoniae + S. aureus (11.3%) (Table 1).
| Variables | No. (%) |
|---|---|
| With Mycoplasma pneumoniae (n = 616) | |
| M. pneumoniae | 616 (100) |
| With virus (n = 71) | |
| PIV1 | 18 (25.4) |
| PIV2 | 1 (1.4) |
| RSV | 43 (60.6) |
| ADV | 7 (9.9) |
| FluB | 2 (2.8) |
| With bacteria (n = 115) | |
| Staphylococcus aureus | 24 (20.9) |
| Haemophilus influenzae | 24 (20.9) |
| Streptococcus pneumoniae | 59 (51.3) |
| Klebsiella pneumoniae | 7 (6.1) |
| Legionella pneumophila | 1 (0.8) |
| With more than two pathogens (n = 62) | |
| M. pneumoniae + PIV1 | 2 (3.2) |
| M. pneumoniae + ADV | 1 (1.6) |
| M. pneumoniae + FluA | 4 (6.5) |
| M. pneumoniae + FluB | 1 (1.6) |
| M. pneumoniae + RSV | 9 (14.5) |
| M. pneumoniae + S. pneumoniae | 22 (35.5) |
| M. pneumoniae + K. pneumoniae | 1 (1.6) |
| M. pneumoniae + S. aureus | 7 (11.3) |
| M. pneumoniae + H. influenzae | 3 (4.8) |
| M. pneumoniae + RSV + S. pneumoniae | 1 (1.6) |
| M. pneumoniae + PIV1 + S. pneumoniae | 1 (1.6) |
| M. pneumoniae + RSV + ADV | 2 (3.2) |
| M. pneumoniae + H. influenzae + K. pneumoniae | 1 (1.6) |
| ADV + S. pneumoniae | 1 (1.6) |
| ADV + S. aureus | 1 1.6) |
| RSV + H. influenzae | 2 (3.2) |
| RSV + K. pneumoniae | 2 (3.2) |
| H. influenzae+S. pneumoniae | 1 (1.6) |
4.3. Gender and Age Distribution of Parainfluenza Virus Type 3 Co-infections
As shown in Table 2, there were 1,061 boys and 614 girls in 1,675 cases of PIV3 single infections (male-to-female ratio = 1.73:1), and 328 boys and 288 girls in 616 cases of M. pneumoniae co-infections (male-to-female ratio = 1.14:1). A significantly higher proportion of girls with M. pneumoniae co-infection was observed than PIV3 mono-infection patients (χ2 = 19.233, P < 0.001). Compared with the PIV3 mono-infection group, M. pneumoniae co-infections were found mainly in patients 1 – 2 years of age (χ2 = 202.130, P < 0.001). Co-infections with more than two pathogens also predominated in patients 1 – 2 years of age (χ2 = 7.903, P = 0.056), although not statistically significant. As observed in the mono-infection group, viral (56.3%) and bacterial (66.1%) co-infections occurred mainly in children younger than one year.
| Variables | With Mycoplasma pneumoniae | With Virus | With Bacteria | With More Than Two Pathogens | Total | PIV3 Mono-infection |
|---|---|---|---|---|---|---|
| Gender | ||||||
| Male | 328 (53.2) | 53 (74.6) | 79 (68.7) | 33 (53.2) | 493 (57.1) | 1061 (63.3) |
| Female | 288 (46.8) | 18 (25.4) | 36 (31.3) | 29 (46.8) | 371 (42.9) | 614 (36.7) |
| χ2 | 19.233 | 3.797 | 1.333 | 2.625 | 9.477 | |
| P-value | < 0.001 | 0.052 | 0.248 | 0.105 | 0.002 | |
| Age, y | ||||||
| < 1 | 133 (21.6) | 40 (56.3) | 76 (66.1) | 25 (40.3) | 274 (31.7) | 917 (54.7) |
| 1 - 2 | 378 (61.4) | 25 (35.2) | 33 (28.7) | 31 (50.0) | 467 (54.1) | 591 (35.3) |
| 3 - 5 | 96 (15.6) | 5 (7.0) | 6 (5.2) | 5 (8.1) | 112 (13.0) | 160 (9.6) |
| ≥ 6 | 9 (1.5) | 1 (1.4) | 0 (0.0) | 1 (1.6) | 11 (1.3) | 7 (0.4) |
| χ2 | 202.130 | 1.944 | 6.496 | 7.903 | 124.714 | |
| P-value | < 0.001 | 0.561 | 0.098 | 0.056 | < 0.001 |
a Values are expressed as No. (%).
4.4. Comparison of Clinical Characteristics of Patients with Parainfluenza Virus Type 3 Mono-infections and Co-infections
As shown in Table 3, PIV3 co-infections with any pathogen were not associated with ICU admissions and ventilator support. However, the mean length of stay of children with M. pneumoniae co-infections (t = 2.367, P = 0.018), bacterial co-infections (t = 2.402, P = 0.016), and co-infections with more than two pathogens (t = 2.827, P = 0.006) was significantly higher than that in children infected with a single PIV3 infection. Children with M. pneumoniae co-infections had a higher percentage of segmented neutrophils (t = 2.437, P = 0.015), band neutrophils (t = 5.009, P < 0.001), and monocytes (t = 2.090, P = 0.037), and a lower percentage of lymphocytes (t = 4.637, P < 0.001) than children with a single PIV3 infection. Similarly, bacterial co-infections and co-infections with more than two pathogens were presented with more segmented neutrophils and a lower percentage of lymphocytes. Bacterial co-infections also produced significantly higher white blood cell counts (t = 2.510, P = 0.012).
| With Mycoplasma pneumoniae (n = 616) | χ2/t | P-Value | With Virus (n = 71) | χ2/t | P-Value | With Bacteria (n = 115) | χ2/t | P-Value | With More Than Two Pathogens (n = 62) | χ2/t | P-Value | Total (n = 864) | χ2/t | P-Value | PIV3 Mono-infection (n = 1675) | |
|---|---|---|---|---|---|---|---|---|---|---|---|---|---|---|---|---|
| PICU admission | 4 (0.6%) | 1.288 | 0.355 | 1 (1.4%) | 0.026 | 1.000 | 2 (1.7%) | 0.263 | 0.648 | 1 (1.6%) | 0.088 | 1.000 | 8 (0.9%) | 0.376 | 0.559 | 20 (1.2%) |
| Ventilator use | 3 (0.5%) | 0.364 | 0.587 | 1 (1.4%) | 0.441 | 1.000 | 2 (1.7%) | 1.450 | 0.226 | 1 (1.6%) | 0.646 | 0.378 | 7 (0.8%) | 0.067 | 0.795 | 12 (0.7%) |
| Hospitalization length of stay (d) | 2.367 | 0.018 | 1.623 | 0.109 | 2.402 | 0.016 | 2.827 | 0.006 | 3.778 | < 0.001 | ||||||
| Median (range) | 7 (3 - 31) | 6 (2 - 32) | 7 (3 - 32) | 7 (1 - 17) | 7 (3 - 32) | 6 (1 - 50) | ||||||||||
| Mean ± SD | 7.07 ± 2.70 | 7.56 ± 4.23 | 7.45 ± 3.75 | 7.90 ± 3.19 | 7.22 ± 3.05 | 6.74 ± 3.02 | ||||||||||
| Laboratory Data | ||||||||||||||||
| With M. pneumoniae (n = 374) | t | P-Value | With Virus (n = 44) | t | P-Value | With Bacteria (n = 75) | t | P-Value | Multiple Co-infection (n = 45) | t | P-Value | Total (n = 538) | t | P-Value | PIV3 Mono-infection (n = 1003) | |
| White blood cell counts (109/L) | 8.56 ± 3.23 | 0.297 | 0.766 | 8.89 ± 2.99 | 0.534 | 0.593 | 9.64 ± 3.55 | 2.510 | 0.012 | 9.09 ± 3.76 | 0.922 | 0.357 | 8.78 ± 3.31 | 0.909 | 0.364 | 8.62 ± 3.39 |
| Segmented neutrophils (%) | 24.93 ± 13.53 | 2.437 | 0.015 | 25.70 ± 13.79 | 1.316 | 0.189 | 26.85 ± 11.66 | 2.408 | 0.016 | 28.40 ± 14.53 | 2.598 | 0.010 | 25.55 ± 13.40 | 3.626 | < 0.001 | 22.89 ± 13.89 |
| Banded neutrophils (%) | 10.06 ± 7.22 | 5.009 | < 0.001 | 7.45 ± 6.26 | 0.473 | 0.636 | 7.68 ± 6.73 | 0.331 | 0.740 | 9.47 ± 7.53 | 1.447 | 0.148 | 9.46 ± 7.16 | 4.073 | < 0.001 | 7.95 ± 6.84 |
| LyM. pneumoniaehocytes (%) | 54.25 ± 17.19 | 4.637 | < 0.001 | 58.70 ± 18.32 | 0.900 | 0.368 | 54.97 ± 15.01 | 2.012 | 0.044 | 52.31 ± 18.56 | 2.567 | 0.010 | 54.39 ± 17.10 | 5.121 | < 0.001 | 59.11 ± 17.34 |
| Monocytes (%) | 6.91 ± 3.76 | 2.090 | 0.037 | 7.05 ± 3.02 | 1.074 | 0.283 | 6.97 ± 4.13 | 1.199 | 0.231 | 6.67 ± 4.15 | 0.402 | 0.688 | 6.91 ± 3.79 | 2.360 | 0.018 | 6.44 ± 3.69 |
| C-reactive protein (mg/L) | 4.02 ± 8.07 | 1.600 | 0.111 | 1.17 ± 3.00 | 2.97 | 0.004 | 4.54 ± 9.60 | 1.350 | 0.177 | 4.86 ± 12.59 | 1.29 | 0.197 | 3.97 ± 8.50 | 1.672 | 0.095 | 3.25 ± 7.93 |
4.5. Comparison of Clinical Diagnosis of Patients with Parainfluenza Virus Type 3 Mono-infections and Co-infections
The clinical diagnoses for the six groups are shown in Table 4. The common diagnosis for PIV3 single infections were pneumonia (41.2%), bronchitis (39.9%), and upper respiratory tract infections (15.0%), which were distinguished from those with bacterial co-infections (χ2 = 16.424, P = 0.001) and co-infections with more than two pathogens (χ2 = 11.687, P = 0.010).
| Clinical Diagnosis | With Mycoplasma pneumoniae | With Virus | With Bacteria | With More Than Two Pathogens | Total | PIV3 Mono-infection |
|---|---|---|---|---|---|---|
| Pneumonia | 278 (45.1) | 33 (46.5) | 47 (40.9) | 38 (61.3) | 396 (45.8) | 690 (41.2) |
| Laryngitis | 32 (5.2) | 2 (2.8) | 1 (0.9) | 1 (1.6) | 36 (4.2) | 66 (3.9) |
| Bronchitis | 211 (34.3) | 31 (43.7) | 62 (53.9) | 20 (32.3) | 324 (37.5) | 668 (39.9) |
| Upper respiratory tract infection | 95 (15.4) | 5 (7.0) | 5 (4.3) | 3 (4.8) | 108 (12.5) | 251 (15.0) |
| χ2 | 7.082 | 3.854 | 16.424 | 11.687 | 6.257 | |
| P-value | 0.069 | 0.274 | 0.001 | 0.010 | 0.100 |
a Values are expressed as No. (%).
5. Discussion
The prevalence of PIV3 co-infections varies greatly across populations. Previously, PIV3 co-infections were observed in approximately 76% of children in Beijing, 43% in Changsha, 40.4% in Guangzhou, and 6.58% in Wenzhou (6, 9, 11, 12). Our findings revealed that among the 2539 ARI patients infected with PIV3, 34% had co-infections with other pathogens, and 2.4% had co-infections with more than two pathogens. The age group, comorbidities, disease severity of patients, antibiotic exposure, detection methods used, and spatiotemporal variations all contributed to the variability in the overall proportions of co-infections in the current study. It is worth noting that in 2018 and 2019, the co-infection rates of PIV3 were 40.5% and 37.9%, respectively, while in 2020 and 2021, after the outbreak of COVID-19 in Wuhan, the co-infection rate of PIV3 decreased to 23.5% and then to 21.3%.
Mycoplasma pneumoniae was found to be the most common co-infecting pathogen (71.3%), followed by other bacteria (13.3%) and viruses (8.2%). Infections with M. pneumoniae may be more common in China than in other countries (13-15). An investigation conducted in China found that the M. pneumoniae infection rate in 593 hospitalized children with segmental/lobar pattern pneumonia was 72.34%, while another study found that M. pneumoniae infections were responsible for 32.4% of community-acquired pneumonias (14, 15). Notably, the co-infection rate with viruses increased to 14.2% in 2020, while the co-infection rate with bacteria decreased from 17.6% in 2019 to 2.3%. This could be due to a shift in the co-infection pattern caused by the COVID-19 epidemic in 2020, reduced personnel movement, and increased personal protection measures. These measures may have a greater impact on the spread of bacteria than viruses.
As known, RSV and PIV3 are the most prevalent viruses in patients with ARI in China (1, 4-6, 16). In the viral co-infection cohort, the most frequently co-detected virus was RSV (60.6%). Consistent with previous reports, in the bacterial co-infection cohort, we found that S. pneumoniae (51.3%) was the most frequent bacterial co-infection; however, both S. aureus (20.9%) and H. influenzae (20.9%) co-infections were also quite common (7, 17). The epidemiological characteristics of an illness can aid in determining the disease's etiological factors (13, 18, 19). Further research is required in the epidemiology of viral and bacterial co-infections, including information regarding gender, age, seasonality, appropriate diagnostic testing and methodologies, and biomarker utilization.
A significantly higher proportion of M. pneumoniae co-infections was observed in girls than in PIV3 mono-infection patients. As literature supports our findings, it is inferred that girls are more susceptible to M. pneumoniae infection, but more data and theoretical support are needed (13). It has been reported that PIV3 co-infection with a respiratory virus is most common in children under the age of one year (67.39%), which is consistent with our findings (9). Conversely, children with M. pneumoniae infections and co-infections with more than two pathogens occur mainly in children 1 – 3 years of age. This could be because M. pneumoniae infection is uncommon in children under one year (13). In addition, the co-infection rate of any pathogen in children over six years of age is less than 2%. The impact of co-infection on the severity of ARI remains questionable (11, 12, 17). Like earlier studies, the current investigation found no evidence that PIV3 co-infections with any pathogen are linked to ventilator support and ICU hospitalizations (11, 12). However, the mean length of stay for children with M. pneumoniae, bacterial co-infection, and co-infections with more than two pathogens was significantly higher than that for children infected with a single PIV3 infection.
We discovered that the lower respiratory tract infection rate in these cases is much higher than that for PIV3 infections alone, regardless of whether the cohort is a bacterial co-infection or a co-infection of more than two pathogens. Furthermore, among children with co-infections with more than two pathogens, the incidence of pneumonia was the highest in the five cohorts. Our findings suggest that bacterial co-infections and co-infections with more than two pathogens may impact the severity of ARI and result in worse symptoms. This contradicts previous reports' conclusion (12, 20). However, these reports do not explicitly cover cases of upper respiratory tract infections or specifically classify the pathogens involved in co-infection. Inconsistencies in the conclusions could be caused by variations in the cohort settings and case sources. These associations need to be confirmed by additional research.
In our study, children with M. pneumoniae co-infections had a higher percentage of monocytes, segmented and banded neutrophils, and a lower percentage of lymphocytes than children with PIV3 alone. Similarly, bacterial and multi-pathogen co-infections resulted in more segmented neutrophils and fewer lymphocytes. Bacterial co-infections also produced a significant increase in the white blood cell count. Common inflammatory markers may be useful in distinguishing infections caused by PIV3 alone from infections caused by other pathogens (21, 22). Our research has several limitations. One significant limitation is that this was a retrospective study, and not all of the data was available, which may have influenced the outcome of the analysis. Second, pathogen detection methods and pathogen detection ranges are limited, and detection does not completely cover all respiratory pathogens. Finally, severe cases are more likely to be tested for PIV3 and other respiratory pathogen infections, while milder cases may be overlooked.
5.1. Conclusions
In conclusion, co-infection of PIV3 with other pathogens is common, and co-infection with different pathogens exhibits different epidemic and clinical characteristics. Our findings suggest that PIV3 co-infections may be associated with a longer hospital stay and support the link between PIV3 co-infections with bacterial or multiple pathogens and the severity of ARI with worse symptoms.
