


1. Background
2. Objectives
3. Methods
3.1. Ethics
3.2. Inclusion and Exclusion Criteria
3.3. Patients
3.4. Study Design
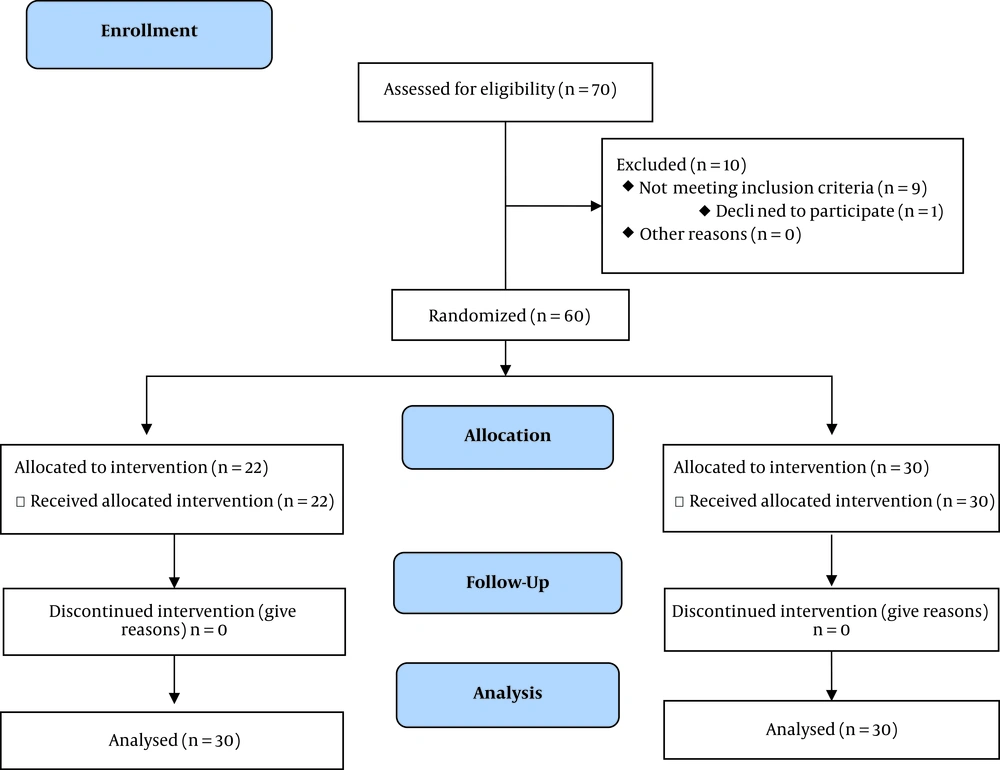
Trial profile and design
3.5. Laboratory Methods
3.6. Sample Size
3.7. Statistical Analyses
4. Results
| Feature | Tarragon (N = 30) | Placebo (N = 30) | P-Value |
|---|---|---|---|
| Age, y | 54.36 ± 4.27 | 51.07 ± 5.5 | 0.47 |
| Sex | 0.691b | ||
| Male | 17 (56.66) | 16 (53.33) | |
| Female | 13 (43.33) | 14 (46.66) | |
| Weight, kg | |||
| Initial | 70.19 ± 10.2 | 71.09 ± 8.45 | 0.71 |
| End | 69.05 ± 9.13 | 70.73 ± 8.07 | 0.74 |
| BMI, kg/m2 | |||
| Initial | 26.42 ± 4.1 | 27.13 ± 4.25 | 0.75 |
| End | 26.05 ± 3.14 | 26.99 ± 3.83 | 0.84 |
| Metformin dose, mg | 1523.37 ± 394.1 | 1513.17 ± 409.04 | 0.88 |
| Diabetes duration, y | 6.04 ± 2.13 | 6.51 ± 2.03 | 0.81 |
aValues are expressed as No. (%) or mean ± SD.
bComparison of mean baseline features by independent samples t-test.
| Variables | Tarragon (N = 30) | Placebo (N = 30) | P1 |
|---|---|---|---|
| FBS, mg/dL | |||
| Baseline | 163.1 ± 19 | 159.07 ± 21.06 | 0.74 |
| End | 123.07 ± 19.3 | 160.11 ± 31.15 | 0.021 |
| P2 | 0.019 | 0.872 | |
| 2-hp, mg/dL | |||
| Baseline | 196.02 ± 73.11 | 199.13 ± 80.19 | 0.66 |
| End | 159.14 ± 61.2 | 199.27 ± 78.3 | 0.037 |
| P2 | 0.04 | 0.82 | |
| Insulin, µU/mL | |||
| Baseline | 12.07 ± 3.42 | 12.39 ± 3.09 | 0.301 |
| End | 10.01 ± 2.17 | 12.69 ± 3.4 | 0.01 |
| P2 | 0.024 | 0.56 | |
| HOMA-IR | |||
| Baseline | 4.86 ± 0.16 | 4.84 ± 0.21 | 0.9 |
| End | 3.04 ± 0.1 | 5.01 ± 0.26 | 0.017 |
| P2 | 0.034 | 0.19 | |
| HbA1c, % | |||
| Baseline | 8.07 ± 1.3 | 7.9 ± 1.41 | 0.42 |
| End | 6.6 ± 1.02 | 7.85 ± 1.39 | 0.029 |
| P2 | 0.033 | 0.7 |
Abbreviations: FBS, fasting blood sugar; HbA1c (%), hemoglobin A1c (%); HOMA-IR, homeostasis model assessment of insulin resistance; SD, standard deviation; 2-hp, two-hour postprandial glucose.
aValues are expressed as No. (%) or mean ± SD.
bP < 0.05, compared with the control group.
cP1, Comparing the mean of variables between the two groups (the statistical analyzes independent samples t-test); P2, comparing the mean of variables in each group at the baseline and end of the study (the statistical analysis paired samples t-test).
| Variables | Tarragon (N = 30) | Placebo (N = 30) | P1 |
|---|---|---|---|
| TC, mg/dL | |||
| Baseline | 252.01 ± 50.37 | 242.11 ± 46.22 | 0.501 |
| End | 184.5 ± 45.13 | 239.07 ± 50.01 | 0.036 |
| P2 | 0.001 | 0.711 | |
| TG, mg/dL | |||
| Baseline | 239.31 ± 67.01 | 248.13 ± 65.21 | 0.671 |
| End | 209.02 ± 49.14 | 242.41 ± 64.05 | 0.042 |
| P2 | 0.035 | 0.7 | |
| HDL-c, mg/dL | |||
| Baseline | 42.07 ± 4.36 | 41.9 ± 3.08 | 0.4 |
| End | 44.21 ± 4.09 | 42.11 ± 5.1 | 0.43 |
| P2 | 0.12 | 0.37 | |
| LDL-c, mg/dL | |||
| Baseline | 129.94 ± 33.01 | 149.11 ± 30.14 | 0.061 |
| End | 98.29 ± 31.02 | 148.47 ± 32.1 | 0.023 |
| P2 | 0.042 | 0.83 |
Abbreviations: HDL-c, high-density lipoprotein-cholesterol; LDL-c, low-density lipoprotein-cholesterol; SD, standard deviation; TC, Total cholesterol; TG, triglyceride.
aValues are expressed as No. (%) or mean ± SD.
bP < 0.05, compared with the control group.
cP1, Comparing the mean of parameters between the two groups (the statistical analyzes independent samples t-test); P2, comparing the mean of parameters in each group at the baseline and end of the study (the statistical analysis paired samples t-test).
| Variables | Tarragon (N = 30) | Placebo (N = 30) | P1 |
|---|---|---|---|
| TAC, mg/dL | |||
| Baseline | 0.89 ± 0.17 | 0.98 ± 0.71 | 0.518 |
| End | 1.34 ± 0.27 | 0.83 ± 0.22 | 0.039 |
| P2 | 0.021 | 0.491 | |
| SOD, µU/mL | |||
| Baseline | 1611.03 ± 219.23 | 1647.35 ± 254.01 | 0.604 |
| End | 1841 ± 309.4 | 1621.61 ± 229.3 | 0.027 |
| P2 | 0.02 | 0.564 | |
| GSH-Px, mg/dL | |||
| Baseline | 40.73 ± 8.61 | 38.11 ± 7.39 | 0.601 |
| End | 47.49 ± 9.27 | 37.63 ± 8.09 | 0.027 |
| P2 | 0.033 | 0.404 |
Abbreviations: GSH-Px, glutathione peroxidase; SD, standard deviation; SOD, Super oxide dismutase; TAC, total antioxidant capacity.
aValues are expressed as No. (%) or mean ± SD.
bP < 0.05, compared with the control group.
cP1, Comparing the mean of variables between the two groups (the statistical analyzes independent samples t-test); P2, comparing the mean of variables in each group at the baseline and end of the study (the statistical analysis paired samples t-test).


