1. Background
Seaweeds are classified into the three groups of red (Rhodophyta), brown (Phaeophyta), and green (Chlorophyta). Brown seaweeds, as the second largest group in marine organisms, include about 2000 identified species (1). Numerous studies have shown that these seaweeds have a wide range of biological activities, such as anticoagulant, anti-tumor, antiviral, and anti-cancer effects (1, 2). They contain polysaccharides, minerals, proteins, pigments, polyphenols, and fatty acids. Alginate is a polysaccharide generally is used in drug delivery systems, cell immobilization applications, and food ingredients, because of its gel-forming ability and viscosity (2).
The viscosity and gel strength of alginates primarily depend on their structure. These copolymers are composed of β-D-mannuronic (M) and α-L-guluronic (G) acids; they have the three blocks of MM, GG, and MG based on their monomers. The polymer chains of alginates predominantly containing GG blocks are stiffer than those containing MM blocks, which are stiffer than MG or GM blocks. The M/G ratio in alginates plays a vital role in their biological activities, such as anticoagulation and lipid blood regulation activities. Among all techniques used to describe alginates, nuclear magnetic resonance (NMR) spectroscopy is the most accurate method to determine both the composition and sequential structure of alginates (3, 4).
The natural contents of alginate in seaweeds consist of sodium, calcium, and magnesium alginate (1). The standard neutral extraction method requires high temperature leading to alginate destruction (4). Also, the current industrial extraction of alginates often suffers from low purity efficiency and loss of valuable compounds. The development of integrated biorefinery processes for the production of multiple products from the starting material may mitigate these issues while also improving the economic viability of the seaweed processing industry. Several analytical studies have employed acidic treatment for the sequential extraction of fucoidan and alginate, but the side effects of this extraction procedure on alginate remain unknown (3).
In this study, in continuation of our previous studies on marine polysaccharides (5), we exclusively analyzed the sequential extraction side effects and optimized the precise conditions necessary to achieve an adequate yield of products based on the other studies' results. Finally, the characterization of alginate was done by the Fourier transform infrared spectroscopy (FT-IR), FT-NMR, energy dispersive X-ray (EDX), and florescent spectrophotometry methods.
2. Objectives
The present study aimed to investigate the sequential extraction and novel characterization of alginate after this procedure from Persian Gulf Sargassum angustifolium seaweeds.
3. Methods
3.1. Collection and Preparation of the Seaweed
S. angustifolium samples were collected during December 2017 from the northern coasts of the Persian Gulf (Bushehr coasts) with the geographic coordinates of 28,55'96''470 N 51,07'29''074 E. They were washed thoroughly with fresh water and dried at room temperature in the laboratory. The scientific identification of seaweeds was carried out by a specialist at Khorramshahr University of Marine Sciences and Technology using the standard literature and Taylor´s taxonomic key (1979) (3).
3.2. Alginate Extraction and Isolation
Dried seaweeds were milled into particle size from 0.250 to 2 mm (test sieve No. 60). The extraction was carried out by acidic and alkaline solutions with slight modifications (4, 6). Briefly, for defatting and de-pigmenting, 300 g of dried seaweeds was treated with 1500 mL of water-chloroform-methanol mixture at a ratio of 1: 2: 4 (v/v/v) overnight at room temperature. The seaweeds were then filtered and retreated similarly with 1500 mL of 80% ethanol. To extracted fucoidan and the defatted seaweeds were treated with 1500 mL of 0.1 M HCl for 3 h at 60°C in an ultrasonic bath at a frequency of 24 kHz twice. Then, the residual seaweeds were treated twice with 1500 mL of 2% (w/v) Na2CO3 solution in an ultrasonic bath for 4 h at 60°C. After filtration, sodium alginate was precipitated by adding absolute ethanol.
Sodium alginate was purified by dissolving in deionized water and then precipitated by adding absolute ethanol. The purified sodium alginate was washed with acetone, and then it was centrifuged, dialyzed, and lyophilized.
3.3. Purification Monitoring by Fluorescence Spectroscopy and EDX
The purity of sodium alginate was investigated based on the amount of phenol impurities by fluorescence spectroscopy (7). The alginate fractions were dissolved in distilled water (1% w/v) filtered through disposable membrane syringe filters (0.2 μm) directly to sample vials. The excitation wavelength was 370 nm, and the emission signals were observed in the 400 - 900 nm range with Thermo Scientific Fluorescence Spectrophotometer Luminous Software.
The elemental analysis of alginate was carried out using EDX spectra and FESEM (MIRA III, TESCAN) with EDS DETECTOR: OXFORD-XMAX-80.
3.4. Structural Characterization
The FT-IR spectrum of sodium alginate was recorded using Bruker Vertex70 FT-IR spectrophotometer in the 4000 - 400 cm−1 region. To perform NMR analysis and achieve better 1H-NMR spectra and reduce the viscosity of alginate, we de-polymerized it according to the procedure provided by Grasdalen (8). The spectra were recorded on a Bruker Avance 400 MHz spectrometer.
3.5. Capillary Viscometer
Alginate viscosity was measured using Ostwald viscometer size D and applying the Torres method (9). Briefly, alginate solutions in 0.1-M NaCl were prepared with the concentrations of 0.3, 0.6, and 1 %w, and then their viscosities were estimated at 25°C.
4. Results
4.1. Extraction Yields
The amount of alginate obtained from 300 g of defatted S. angustifolium seaweeds was 44.77 g.
4.2. Impurity Monitoring of Alginate by Fluorescence Spectroscopy
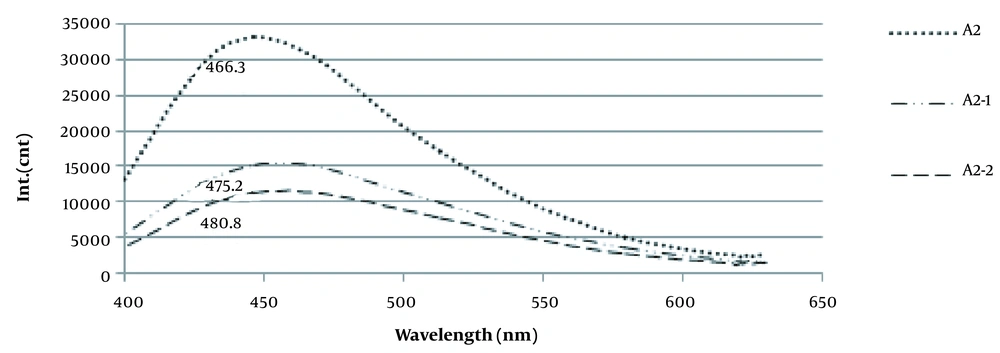
Phenolic content was determined as impurities in sodium alginate (Figure 1).
4.3. The Results of EDX Spectra
4.3.1. Determination of the Molecular Formula
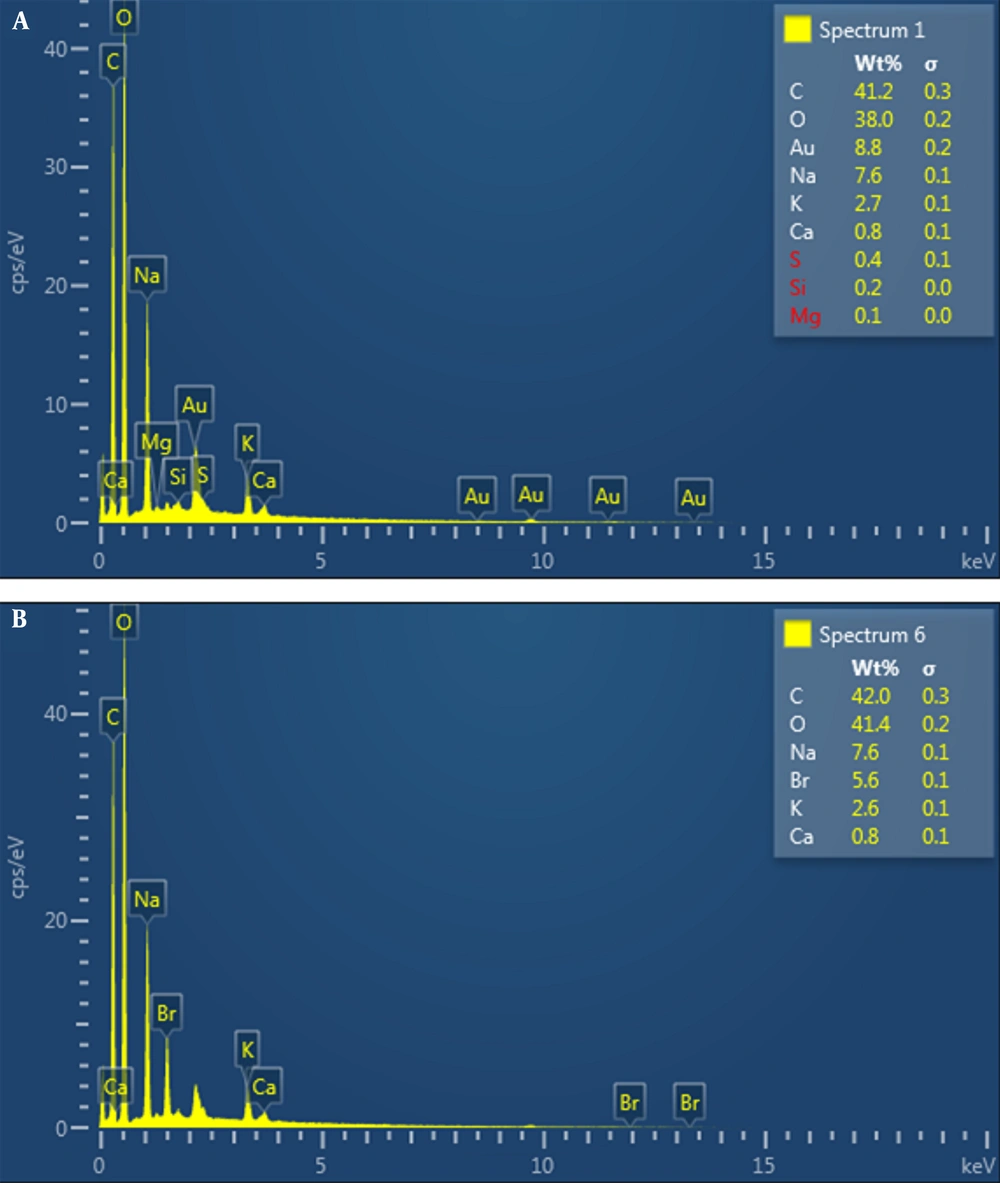
After alginate was hydrolyzed by HCl in several steps, the monomeric formula of alginate was determined as C6H9O5 using the EDX spectrum (Figure 2).
4.3.2. Impurity Monitoring Using EDX Spectrum
EDX graphs of the unpurified alginate showed the presence of K, Ca, Na, and Au with some negligible elements such as S, Si, and Mg, which are common elements for seaweeds, as presented in Figure 2A.
4.4. FT-IR Spectral Analysis of Alginate
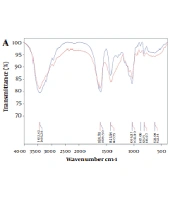
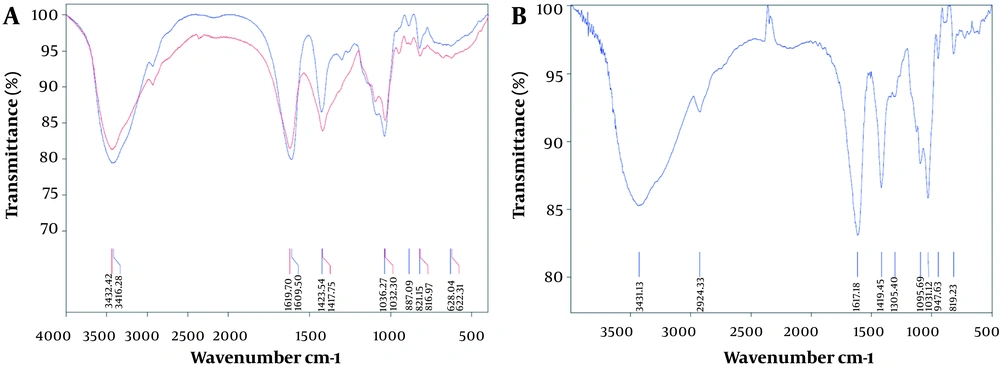
For the characterization of sodium alginate, the specific absorption bands were subjected to FT-IR analysis as shown in Figure 3.
4.5. 1H-NMR Spectral Analysis of Alginate
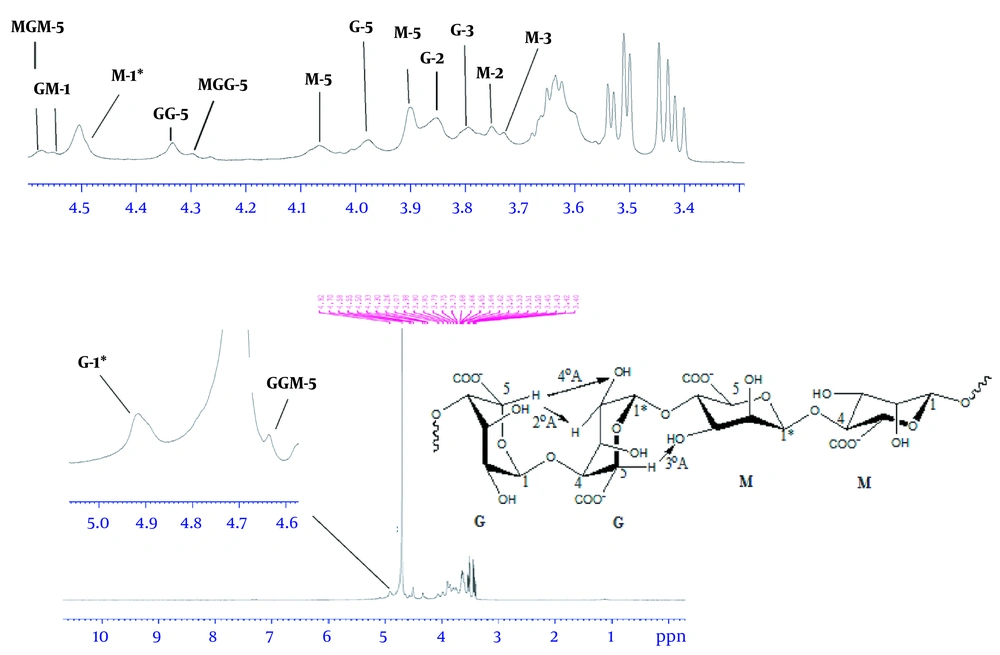
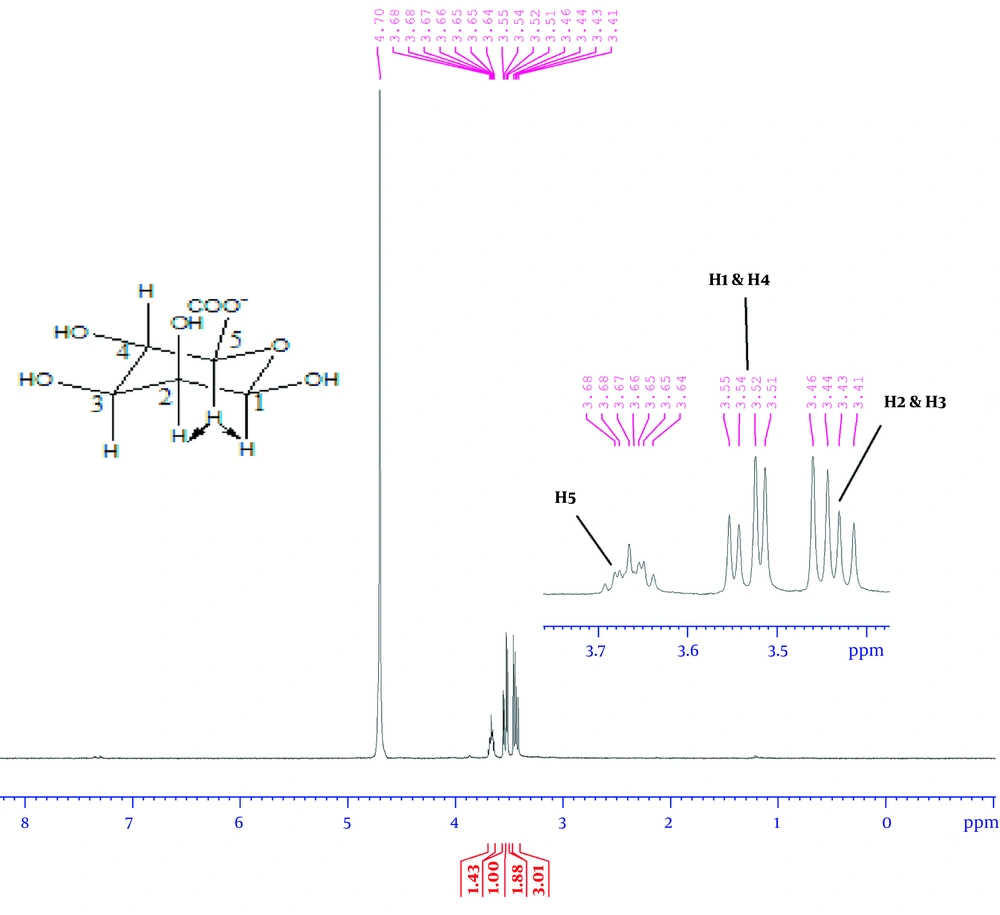
According to Figure 4, the 1H-NMR spectrum revealed two strong signals at 4.92 and 4.50 ppm belonging to anomeric hydrocarbons of glucuronic acid, G-1, and mannuronic acid, M-1, respectively. The 1H-NMR spectrum for monomeric alginate demonstrated three signals in Figure 5. Accordingly, the signals were assigned as: δ 3.66 (ddd, 1H, H-5), 3.54 (dd, 2H, H-2 and H-4), and 3.44 (dd, 2H, H-2 and H-3).
4.5.1. The Characterization of Alginate By M/G Ratio
As shown in Table 1, the M/G ratio of alginate S. angustifolium from Sargassum was determined as 0.61.
| Species | Origin | M/G | FM | FG | FMM | FMG | FGG | References |
|---|---|---|---|---|---|---|---|---|
| S. turbinarioidesGrunow | Madagascar | 0.94 | 0.48 | 0.52 | 0.36 | 0.25 | 0.39 | (10) |
| S. vulgare | Brazil | 1.56 | 0.61 | 0.39 | 0.58 | 0.06 | 0.36 | (9) |
| S. latifolium | Egypt | 0.82 | 0.45 | 0.55 | 0.41 | 0.08 | 0.51 | (11) |
| S. fluitans | Florida | 1.18 | 0.54 | 0.46 | 0.36 | 0.36 | 0.28 | (12) |
| S. oligocystum | Australia | 0.62 | 0.38 | 0.62 | 0.31 | 0.14 | 0.55 | (13) |
| S. muticum | England | 0.31 | 0.24 | 0.76 | 0.07 | 0.34 | 0.59 | (14) |
| S. filipendula | Not given | 0.19 | 0.16 | 0.84 | 0.07 | 0.16 | 0.76 | (14) |
| S. angustifolium | Persian Gulf | 0.61 | 0.38 | 0.62 | 0.07 | 0.31 | 0.31 | PS |
Abbreviations: M/G, the integration ratio of M to G; FM, integration M block fraction; FG, integration G block fraction; FMM, integration MM block fraction; FMG, integration MG block fraction; FGG, integration GG block fraction.
4.6. Intrinsic Viscosity and Molecular Weight
The viscosity of alginate in NaCl 0.1 M, for three values, including 0.3, 0.6, and 1% of alginates, was examined. The intrinsic viscosity of the alginate from S. angustifolium in the present study was determined as 0.9 dL/g.
The average molar weight (Mv) of alginate was determined using intrinsic viscosity. The average molar weight of the alginate from S. angustifolium was determined to be 41.53 kDa.
5. Discussion
5.1. Extraction Yields
The total amount of sodium alginate was obtained in the present study was lower than that reported by Ardalan et al. 2018 from S. angustifolium in both winter and summer (20.9 - 22.4%, of dried seaweed) (2). The extraction methods and the collection season can affect the amount of alginate; thus, the reduction in the present study could be due to either of these factors (1, 3). It is unlikely for the sampling season to be the sole cause for this difference. We assume that the sequential extraction method provides maximal alginate yields, because it is the standard commercial exploitation protocol. As indicated by our results, the amount of alginate is comparable with that of other Sargassum species. Although the reported amount by Ardalan et al. (2018) from S. angustifolium was slightly higher, they did not distinguish between its ingredients such as fucoidan and alginate. Therefore, it is not possible to make a valid comparison between the efficiency of these extraction methods.
5.2. Impurity Monitoring of Alginate by Fluorescence Spectroscopy
The purity of sodium alginate is quite essential for medical applications. Unrefined alginate can cause the overgrowth of fibrotic cells around alginate microcapsules (9). Polyphenols, endotoxins, and proteins are the most common impurities in alginate products. Hence, to evaluate the efficiency of alginate extraction and purification method in this study, the purity of the extracted alginate was monitored by the fluorescence spectroscopy method. As shown in Figure 1, unpurified alginates displayed the presence of residues emitting at 370 nm, which is above the alginate from Sigma-Aldrich. After dissolution and re-precipitation with ethanol, the fluorescence intensity was reduced by 66.54%, which corresponded with 52.7% reported by Torres (2007).
5.3. The Result of EDX Spectra
5.3.1. Determination of the Molecular Formula
Alginate is a linear anionic copolymer of β-D-mannuronic acid (M) and α-L-guluronic acid (G). After alginate was hydrolyzed by HCl in several steps, the monomeric formula of alginate was determined as C6H9O5 using the EDX spectrum, as shown in Figure 2.
5.3.2. Impurity Monitoring Using EDX Spectrum
The EDX is an analytical technique used for the elemental analysis or chemical characterization of a sample (15). Therefore, in the present study, the EDX was used to verify the impurity of the heavy metals and other elements before and after the purifying method. The EDX graphs of the unpurified alginate showed the presence of K, Ca, Na, and Au with some negligible elements such as S, Si, and Mg, which are common elements for seaweeds, as presented in Figure 2A. Sulfuric acid is an indicator of the presence of fucoidan. Accordingly, sulfur’s presence indicated this polysaccharide is present in the alginate extraction as an impurity. Brown seaweed and its residue have a high affinity for heavy metals (16). However, there was no trace of heavy metals. After re-precipitation purification treatment, the number of components decreased, indicating that some elements were replaced by H+. A few elements, such as S, Si, and Mg, were eliminated (Figure 2B). This result illustrates the success of the re-precipitation treatment in removing some of the routine alginate impurities, such as fucoidan.
5.4. FT-IR Spectral Analysis of Alginate
As shown in Figure 3A, the purified and unpurified alginate spectra both showed typical absorption bands of alginate, including the stretching vibrations of O–H at 3000 - 3800 cm-1, C–H at 2932 cm-1, and carboxylate group at 1700 - 1610 cm-1. Vibrational bands at 1304, 1103, and 1095 cm-1 were assigned to bending C–H and C–O stretching, respectively. Also, the band at 1032 cm-1 maybe because of C–O stretching vibrations, and the one at 947 cm-1 maybe because of the C–O stretching vibration of uranic acid residues. A band at 817 cm-1 can be assigned to the mannuronic acid residues. Ultimately, the comparison between the sodium alginate and alginate from Sigma-Aldrich displayed a remarkable agreement, as presented in Figure 3B.
5.5. 1H-NMR Spectral Analysis of Alginate
The anomeric protons in both the mannuronic acid and the glucuronic acid were identified using the peaks assigned by Grasdalen (8). Two strong signals are shown at 4.92 and 4.50 ppm in Figure 4, which correspond to the anomeric hydrocarbons of glucuronic acid, G-1, and mannuronic acid, M-1, respectively. Because of the electronegativity of the carboxyl group, these two protons were located in a high field, and as a result G-1 was placed at the higher part. Moreover, the two peaks of 4.50 and 4.55 ppm refer to the anomeric proton of M neighboring another anomeric proton of M and G, respectively.
The chemical shifts of signals at 4.30, 4.58, and 4.64 ppm were assigned as the H-5 of G adjacent to M. Moreover, the chemical shift of signal at 4.33 ppm refers to the residues of anomeric proton of G and G-5 in G blocks. Due to its proximity to oxygen and being less shielded, G-5 also resonates in the same region as the anomeric protons (9).
Furthermore, other guluronic acid protons were located at a lower field than mannuronic acid due to their geometrical form. In comparison with other studies, because of the electron cloud density around protons and electronegativity of oxygen, the signals observed at 3.98, 3.85, and 3.79 ppm belonged to G-4, G-2, and G-3, respectively. Likewise, the protons of mannuronic acid, such as M-5, M-4, M-2, and M-3, showed signals with chemical shifts at 4.07, 3.90, 3.75, and 3.75 ppm, as shown in Figure 4. The residual up-field chemical shifts belonging to the monomers of alginate, especially M, showed the impact of acidic treatment.
Through 1H-NMR analysis, all the monomeric signals of alginate were assigned in CDCl3 as a solvent at chemical shifts (ppm) 3.66 (ddd, 1H, H-5), 3.54 (dd, 2H, H-2, and H-4), 3.44 (dd, 2H, H-2 and H-3), as shown in Figure 5. After the complete hydrolysis of alginate to its constituent monomers, they fell to the region of linear hydrocarbons. Both guluronic acid and mannuronic acid contents of alginate resonated in the same region. Therefore, the chemical shifts of all monomeric protons were found in up-field, from 3.3 to 3.7 ppm. The location of each proton was determined through the electronegativity of oxygen and coupling effect.
5.5.1. The Characterization of Alginate
One of the most critical properties of alginates is its ability to form gels. This ability is described in terms of the divalent captions embedded into cavities formed by two adjacent polymer chains containing GG blocks (1). The fact of G-5 being less shielded is sequence-dependent. G-5 resonates differently, depending on whether its neighbor is another G or an M. Therefore, the M/G ratio was achieved by the combination of three areas, including the anomeric protons G-1, M-1, and G-5. The gel-forming ability in alginate is significantly affected by the combination of M/G ratio; brittle strong gels are produced from low M/G alginate. In contrast, soft flexible gels are formed from the alginate with a high M/G ratio (17).
As shown in Table 1, the range of M/G ratio of alginate is demonstrated from 0.19 to 1.56, belonging to S. fluitans and S. vulgare, respectively. The value of M/G in S. angustifolium in this study was determined as 0.61. This property is considered for the ability of gel production with balanced hardness and flexibility.
The value of MM blocks in PS was quite low compared to other Sargassum species. For instance, the amount of these blocks in S. oligocystum with a similar value of M/G (0.62) was reported in the range of 0.24 to 0.31, which is extremely higher compared than our result (0.07). The low value of MM blocks in this study can be attributed to two factors, the inherent property of the algae and the effect of the extraction method. Since the results in this study are not consistent with other Sargassum species using the standard neutral extraction method, this sharp decrease in MM blocks should be attributed to the sequential extraction process. Furthermore, to demonstrate that the effect of the sequential extraction process on MM blocks does not only belong to S. angustifolium, other studies using the standard neutral and sequential extraction methods were also analyzed. Therefore, the amount of MM and GG blocks in Saccharina longicruris were studied. Alginate was extracted from S. longicruris using the standard neutral method, and the amount of FMM and FGG blocks were achieved 0.57 and 0.23, respectively (18). However, in another study extracting alginate from the same algae using the sequential extraction method, these values were obtained 0.07 and 0.25 for MM and GG blocks, respectively (19).
The results show the direct effect of the sequential extraction method using acidic treatment on reducing MM blocks in alginate. Thus, the remarkable reduction in MM blocks in the present study, which is compatible with this result, is also due to using diluted acid in the sequential extraction process. From another point of view, it indicates the high sensitivity of MM blocks to acidic environments. On the other hand, there are GG blocks that do not show any decrease or sensitivity to acidic environment. The value of GG blocks in our study was obtained 0.31, which was compatible with the results from other Sargassum species. The alternating blocks (GM and MG) in Sargassum spp. were reported in the range of 0.02 to 0.36, which is in compliance with our study (0.31). Finally, it demonstrated that S. angustifolium is an algae with a high level of alternating blocks.
5.6. Intrinsic Viscosity and Molecular Weight
The viscosity of alginate was examined for three values, including 0.3, 0.6, and 1% of alginate in NaCl 0.1 M. The result exhibited an increase in alginate concentration and the flow velocity in extracts with a gentle gradient. Dynamic viscosities for all extracts were determined using Newton’s law. Finally, intrinsic viscosity (Ƞ) was determined by extrapolating to the alginate concentration in standard curves using the Huggins equation as (12):
Where, C is the concentration, and Ƞrel is the relative viscosity of solutions.
The intrinsic viscosity of the alginate from S. angustifolium in the present study was obtained 0.9 dL/g, which is quite low as compared with the other species of this family. The viscosity of alginate in Sargassum spp. was reported in the range of 6.3 - 15.2 dL/g.
Alginate viscosity can be influenced by various factors, such as alginate concentration, composition, pH, temperature M/G ratio, molecular weight, and the level of MM blocks (4). The possible effect of each of these factors on the reduction of alginate viscosity was investigated in the present study. Firstly, the temperature did not interfere with the results, since it was strictly controlled (60°C). Secondly, mineral compositions were obtained in the same range as other studies. Therefore, the cause of low viscosity obtained in alginate in the present study can be attributed to pH and characterization of alginate.
However, the results of other studies were not consistent with our results. Previous studies on the properties of alginates and their effect on viscosity showed the high level of MM blocks, the low ratio of M/G, and the low viscosity of alginate (4, 20). Although the M/G ratio of alginate from S. angustifolium corresponded to its low viscosity, the low amount of MM blocks in this alginate was in contradiction with its low viscosity. This is feasible because alginate was treated in an acidic medium during the extraction process (6).
The fucoidan and alginate of S. longicruris have been extracted with the sequential extraction process similar to the current study (4, 20). S. longicruris alginate showed a low proportion of MM blocks compared with other studies using the standard neutral extraction method (18). Therefore, the low viscosity of alginate in the present study could be caused by the de-polymerization of MM blocks during the extraction procedure.
The average molar weight (Mv) of alginate was determined using intrinsic viscosity, with the Mark-Houwink equation:
With k = 0.023 and a = 0.984 (9). The average molar weight of alginate from S. angustifolium was determined as 41.53 kDa. The molecular weights of alginates extracted from Ascophyllum nodosum and Fucus vesiculosus with sequential extraction were obtained 154.9 and 177.3 kDa (20). In comparison with alginate from other species in one-step extraction, their molecular weight was obtained considerably low. Molecular weight and viscosity have a direct relationship. Therefore, it can be concluded that alginates extracted by the sequential extraction method using acidic media have a lower molecular weight and viscosity in comparison with those obtained from the same sources but using the single-stage extraction of alginate.
5.7. Conclusions
The total alginate content of residual S. angustifolium was obtained 17% of dried seaweed. As indicated by our results the sequential extraction process provides a comparable yield and alginate quality (M/G, FGG) with the standard neutral extraction. The use of the sequential extraction method in the present study significantly reduced alginate viscosity. However, based on the results obtained from M/G and GG blocks' amounts, they did not show any inhibition against its gel formation property. The sequential extraction procedure, therefore, offers a viable alternative to the standard neutral extraction protocol, especially when rapid structural characterization is required, thus eliminating the de-polymerization pre-treatment step required for 1H-NMR work. The structure of alginate was identified with monomeric formula C6H9O5. Alginate structural elucidations were carried out using the FT-IR, FT-NMR, EDX, and florescent spectrophotometry methods. The molecular weight of alginate was determined as 41.53 kDa.
