


1. Background
Polycystic ovary syndrome (PCOS) is a multifactorial reproductive and metabolic disorder affecting 5.5% to 19.9% of reproductive-age women worldwide (1). The hallmarks of this prevalent condition are hyperandrogenism, numerous preantral cystic ovarian follicles, and anovulation (2). Anovulation in PCOS results from the disruption of the synchronized hormonal signals responsible for normal follicular maturation. Hypersecretion of luteinizing hormone (LH), insulin-like growth factor 1 (IGF1), and anti-Müllerian hormone (AMH) culminate in follicular arrest and higher conversion of progesterone precursors to androgens (3). The increased ovarian androgen production by follicular theca cells may manifest as weight gain, excess fat deposition, hirsutism, clitoromegaly, oily skin, and acne (4).
PCOS is associated with an increased risk of metabolic abnormalities, type II diabetes, cardiovascular diseases, and ovarian cancer (1). Intriguingly, two-thirds of women with PCOS are found to have insulin resistance (IR) independent of obesity (5). IR is suspected to play a major role in the pathogenesis of PCOS, although the exact pathophysiologic association between IR and PCOS remains undetermined (6). Hyperinsulinemia in PCOS women may be a consequence of the frequently increased basal insulin secretion (7), the decreased hepatic clearance of insulin reported in these patients (8), or a combination of both processes. Hyperinsulinemia further aggravates the hyperandrogenic phenotype in PCOS by inhibiting the hepatic synthesis of sex hormone binding globulin (SHBG) (9); thus, increasing the availability of free testosterone in circulation (10). SHBG normally controls the levels of sex hormones in circulation by regulating their metabolic clearance rates (11). Whether PCOS is the manifestation of IR in the ovaries remains debatable. Nonetheless, several studies have reported a potential therapeutic role for insulin sensitizing agents, such as metformin and thiazolidinediones (TZDs), in ameliorating many of the symptoms of PCOS (12).
TZDs, such as rosiglitazone and pioglitazone, act via activating the peroxisome proliferator-activated receptor gamma (PPARγ). PPARγ regulates ovarian granulosa cell steroid hormone synthesis, angiogenesis, and proliferation (13). Since PPARγ is downregulated in the ovarian granulosa cells by the high levels of LH (14), the direct ovarian PPARγ activation may be, in part, responsible for the improvement in PCOS symptoms seen with TZD treatment (12). Furthermore, PPARγ inhibits the mammalian target of rapamycin (mTOR) signaling, a pathway implicated in the pathogenesis of PCOS (15). Insulin, on the other hand, activates mTOR via the PI3K/Akt pathway, and a normal insulin signaling is important for ovarian steroid hormone synthesis (16). Conversely, a hyperactive mTOR signal, as seen in PCOS, may contribute to a negative feedback inhibition of the insulin signal and lead to IR (17).
The main concern about TZD therapy is the major and potentially lethal side effects (18); hence, it is necessary to investigate the therapeutic role of other natural PPARγ agonists. The Magnolia officinalis plant has long been used as an herbal remedy for diabetes mellitus (DM). Magnolol and honokiol are the two active ingredients documented to reduce fasting blood glucose, insulin, and adiposity while enhancing glucose uptake in experimental animal models of diabetes (19). Honokiol and magnolol enhance the phosphoinositide-3-kinase/Akt insulin signaling pathway, influence cholesterol metabolisms, and activate PPARγ (20, 21).
In this study, using a rat model of dehydroepiandrosterone (DHEA)-induced PCOS and IR, we aimed to explore both the potential beneficial effect and the molecular mechanism of action of Magnolia officinalis extract (MOE). To our knowledge, the remedial effects of MOE in PCOS have not been studied. We hypothesize that MOE will activate PPARγ, downregulating the mTOR signal, resulting in an improvement in the PCOS phenotype. It is hoped that the current study enhances our understanding of the possible link between IR and PCOS.
2. Methods
2.1. Animals
A total of 42 female Sprague-Dawley rats (8 - 9 weeks old) with free access to commercial rat chow and water were housed at the University of Balamand animal facility set at a temperature of 22°C with a 12-hour dark/light cycle. The animal experimental protocols were approved by the Institutional Animal Care and Use Committee of the University of Balamand and carried out in compliance with the Committee’s guidelines.
2.2. Materials and Chemicals
Dehydroepiandrosterone (DHEA) was purchased from Sigma-Aldrich (# D4000-10G), Magnolia officinalis extract from Bulksupplements.com ® (lot# 1803306), dimethyl sulfoxide (DMSO) from Honeywell (#41640-1L), sesame oil from local market, thiopental from Rotexmedica, Insulin ELISA kit from Merck Millipore (#EZRMI-13K), luteinizing hormone ELISA kit from Mybiosource (#MBS4500762), PVDF membrane from GE healthcare (#10600023), enhanced chemiluminescence (ECL) from Biorad (#170-5060), anti-IRS1 from Abcam (#ab131487), anti-Akt from Abcam (#ab8805), anti-phospho mTOR from Abcam (#ab84400), anti-PPARγ from Abcam (#209350), and anti-beta-actin from Abcam (#ab8229).
2.3. Experimental Models
To chemically induce the PCOS phenotype in the experimental group, we used daily subcutaneous injection of DHEA in post-pubertal female rats for 28 days (22, 23). First, a set of 21 post-pubertal age- and weight-matched female Sprague-Dawley rats were randomly divided into two groups of control (n = 5) and PCOS (n = 16). The PCOS group received daily subcutaneous injections of DHEA (6 mg/100 g body weight; Sigma) dissolved in 0.1 mL sesame oil for 28 days, and the control group received daily subcutaneous injections of sesame oil (0.1 mL/100 g body weight) for 28 days. After 28 days, all the rats were fasted overnight, then anesthetized at 9 am the following day, and sacrificed for blood and tissue collection.
Then a second set of 21 post-pubertal age- and weight-matched female Sprague-Dawley rats were divided into two groups of control (n = 7) and PCOS (n = 14); both groups received identical treatments in the first run for 28 days. However, after 28 days, the rats that received DHEA treatment were randomly divided into two groups: one group (n = 7) received daily oral administration of MOE (500 mg/kg; BulkSupplements.com) dissolved in DMSO for 30 days, and the other group (n = 7) received only oral DMSO for 30 days (24). Also, the control rats continued to receive daily oral DMSO for 30 days. At the end of the treatment, all the rats were fasted overnight, then anesthetized 9 am the following day, and sacrificed for blood and tissue collection.
2.4. Body Weight and Ovary Weight Measurement
Individual rat body weight from each group was recorded every 3 - 4 days from the first until the end of the experiment. Upon sacrifice, the weight of the ovaries from each group was also measured.
2.5. Sample Collection
Serum and ovarian tissue samples were collected in compliance with the guidelines of the Institutional Animal Care and Use Committee of the University of Balamand. After sedation, using intraperitoneal injection of 200 µL of thiopental, an incision was made in the diaphragm, and rat blood samples were withdrawn with a needle and syringe from the right ventricle. The blood samples were transferred into the serum separator tubes, centrifuged at 2000 rpm for 10 minutes, and the serum was collected, aliquoted, and stored at -80°C. Both ovaries were dissected out from each rat and either fixed in formalin for histological analysis or frozen in liquid nitrogen for protein extraction and Western blot analysis.
2.6. Polycystic Ovarian Morphology (PCOM)
Ovaries of the rats in all experimental groups were fixed in formalin and embedded in paraffin. Slides mounted with 10 µm thickness sections were then stained with hematoxylin and eosin (H&E) and blindly assessed by an independent specialized pathologist.
2.7. Serum Luteinizing Hormone (LH)
Luteinizing hormone (LH) was measured in the serum of all rats, using the rat luteinizing hormone ELISA kit (Mybiosource) as per manufacturer protocol, and the absorbance was measured at 450 nm using the microplate reader synergy HTX multimode reader (Bioteck).
2.8. Fasting Blood Glucose, Fasting Serum Insulin, and HOMA-IR
Fasting blood glucose was measured using the human ACCU-CHECK Performa machine. Fasting serum insulin was measured by the Rat/Mouse Insulin ELISA kit (Merck Millipore). The homeostatic model assessment index of insulin resistance (HOMA-IR) was calculated according to the following equation: HOMA-IR= fasting glucose (mmol/L) x fasting insulin (mIU/L)/ 22.5. A HOMA-IR value greater than 2.8 was considered indicative of IR (25, 26).
2.9. Western Blot Analysis
Ovarian protein expression of PPARγ, IRS1, phospho-mTOR, total mTOR, phospho-Akt, and total Akt was measured by Western blot. Upon sacrifice, ovaries were collected from all experimental rats. The tissue was homogenized, total protein samples were extracted, and their concentrations determined using the colorimetric Biuret assay. Samples were loaded and resolved on either 6, 8, or 10% polyacrylamide gel. The proteins were transferred to polyvinylidene fluoride (PVDF) membranes (GE healthcare) at 100 volts for 1 hour. The membranes were blocked with 5% bovine serum albumin (BSA) blocking solution and incubated overnight with the following primary antibodies: anti-IRS1 (Abcam, Cat#ab131487), anti-Akt (Abcam, Cat#ab8805), anti-phospho-mTOR (Abcam, Cat#ab84400), anti-mTOR (Cell signaling cat#2983), anti-PPARγ (Abcam, Cat#209350), and beta-actin (Abcam, Cat#ab8229). Membranes were washed with tris-buffered saline with tween (TBST), and the species specific secondary antibody was added for 1.5 hours. After washing, enhanced chemiluminescence (ECL) kit (Biorad, Cat#170-5060) was used to visualize the bands using the Chemidoc system (Biorad). The bands were analyzed using the Image lab software (version 5.2.1). Beta-actin was used as a loading control.
2.10. Statistical Analysis
Quantitative data was presented as the mean ± SEM. Student-t test was used to compare the means of the control and the PCOS group. One-way analysis of variance (ANOVA) followed by post-hoc Tukey’s test were used when there were three experimental groups to compare with a statistically significant difference (P < 0.05).
3. Results
3.1. Polycystic Ovarian Morphology is Noted in the DHEA-treated Rats
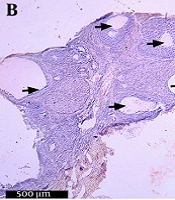
In order to confirm PCOS induction after 28 days, H&E stained ovarian sections from both groups were examined under light microscopy at 40X magnification. On average, the DHEA-injected rats showed three or more cystically dilated follicles per longitudinal ovarian section, with thickened granulosa (Figure 1B). The control rats showed normal follicle morphology, although an occasional dilated follicle was observed (Figure 1A).
 the control rats and of (B) the DHEA-induced PCOS rats under 40X magnification (scale bar = 500 μm). Arrows indicate the abnormally dilated follicles with thickened granulosa.")
DHEA-injection induces cystically dilated ovarian follicles. H&E stain of the ovaries of (A) the control rats and of (B) the DHEA-induced PCOS rats under 40X magnification (scale bar = 500 μm). Arrows indicate the abnormally dilated follicles with thickened granulosa.
3.2. DHEA Induces Weight Gain
PCOS was induced in rats injected with DHEA for 28 days. Our data showed a significant increase in the weights of the DHEA-treated rats starting after the third week compared to the controls. After 28 days, the DHEA-treated rats continued to show an increase in weight (242.5 ± 11.97 g) compared to the control rats (226.8 ± 4.71 g) (P < 0.05) (Figure 2A).
 Body weights (B) Serum LH, (C) Fasting blood glucose, (D) Fasting serum insulin, and (E) HOMA-IR in control versus DHEA-treated PCOS rats after 28 days. Values are presented as mean ± SEM (* represents a significant difference from the control group P < 0.05).")
DHEA-injection induces weight gain, increases luteinizing hormone and insulin resistance. (A) Body weights (B) Serum LH, (C) Fasting blood glucose, (D) Fasting serum insulin, and (E) HOMA-IR in control versus DHEA-treated PCOS rats after 28 days. Values are presented as mean ± SEM (* represents a significant difference from the control group P < 0.05).
3.3. DHEA Increases the Serum Levels of Luteinizing Hormone
The serum levels of LH were measured in all rats using an LH ELISA kit. Our data showed a significant increase in the levels of serum LH in PCOS rats (10 ± 2.7) compared to the controls (6.3 ± 0.227) (P < 0.05) (Figure 2B).
3.4. DHEA-induced PCOS Rats Developed Insulin Resistance
Our data showed a slight but statistically insignificant increase in the levels of fasting blood glucose in PCOS rats (134 mg/dL ± 21.63) compared to the controls (107 mg/dL ± 36.9) (Figure 2C). However, insulin levels significantly increased in the DHEA-treated rats at day 28 (2.18 ng/mL ± 0.94) as compared to the control group (0.66 ng/mL ± 0.26) (Figure 2D). Upon calculating the HOMA-IR, we found it to be significantly high in the DHEA-treated rats (9.98 ± 4.19) compared to the controls (2.72 ± 3.96) (Figure 2E).
3.5. DHEA Decreased PPARγ, Akt, and IRS1 but Increased the mTOR Protein Expression
Western blot analysis was performed to determine the ovarian protein expression levels of PPARγ, p-mTOR, Akt, and IRS1 after 28 days of DHEA treatment, as compared to controls. We found that DHEA-injected PCOS rats had a significantly lower protein expression of PPARγ, Akt, and IRS1 in their ovaries compared to the controls (Figures 3A, C, and D, respectively). Conversely, Western blot analysis of phospho-mTOR revealed a significant 3-fold increase in the protein levels of phospho-mTOR in the ovaries of DHEA-induced PCOS rats as compared to the controls (Figure 3B).
 PPARγ, (B) p-mTOR, (C) Akt and (D) IRS1. Values are presented as the mean ± SEM (* represents a significant difference from the control group P < 0.05).")
DHEA decreases PPARγ, Akt, and IRS1, while increasing mTOR protein expression. Typical western blots of control versus PCOS rats, along with the corresponding β-actin, and graphical representation of the protein expression normalized to β-actin and expressed as fold of control for (A) PPARγ, (B) p-mTOR, (C) Akt and (D) IRS1. Values are presented as the mean ± SEM (* represents a significant difference from the control group P < 0.05).
3.6. Improved Polycystic Ovarian Morphology in the MOE-treated Rats
Microscopic examination of H&E stains of the longitudinal ovarian sections revealed that the MOE-treated DHEA/PCOS rats showed a significantly lower number of dilated follicular cysts (Figure 4C), compared to the non-treated DHEA/PCOS (Figure 4B) that showed on the average three or more cystically dilated follicles per longitudinal ovarian section. Indeed, the MOE-treated PCOS rats have shown many sections completely devoid of any cystic follicles similar to control group (Figure 4A).
 control, (B) DHEA/PCOS and (C) PCOS rats treated with MOE (PCOS/MOE). Scale bar is 500 μm. Arrows indicate the abnormally dilated follicles with thickened granulosa.")
Improved polycystic ovarian morphology in the MOE-treated rats. Micrograph of H&E stained sections of rat ovaries from (A) control, (B) DHEA/PCOS and (C) PCOS rats treated with MOE (PCOS/MOE). Scale bar is 500 μm. Arrows indicate the abnormally dilated follicles with thickened granulosa.
3.7. The MOE Decreased Body Weights of DHEA-treated PCOS Rats
The rats receiving 28 days of DHEA followed by oral MOE for 30 days had a significant decrease in their average body weight (231.66 ± 13.06 g) at the end of the experiment as compared to the DHEA/PCOS rats that did not receive MOE (250.3 ± 16.97 g) and to the controls (246.2 ± 6.18 g). Furthermore, the average body weight of the MOE-treated rats was less at the end of treatment (231.66 ± 13.06 g) than their own average weight at the start of treatment (243.16 ± 13.81 g). Thus, MOE treatment resulted in a decrease in the rats’ absolute body weights, not only a decrease in body weight gain, while the control and DHEA/PCOS continued to gain weight (Figure 5A). The average rat ovary weight, however, showed no significant difference between controls (60 ± 6 mg), DHEA without MOE treatment (62 ± 16.8 mg), and the DHEA rats treated with MOE (63.7 ± 13 mg) (Figure 5B).
 Average body weights of the control, PCOS, and the MOE-treated PCOS rats were measured every 3 to 4 days until day 59. (B) Ovary weights and (C) Serum LH in controls, PCOS, and PCOS rats treated with MOE (PCOS/MOE). All Values are presented as mean ± SEM (* represents a significant difference from the control group p < 0.05; # represents a significant difference between PCOS and PCOS/MOE P < 0.05).")
MOE-treatment decreases body weight and serum LH of DHEA-induced PCOS rats. (A) Average body weights of the control, PCOS, and the MOE-treated PCOS rats were measured every 3 to 4 days until day 59. (B) Ovary weights and (C) Serum LH in controls, PCOS, and PCOS rats treated with MOE (PCOS/MOE). All Values are presented as mean ± SEM (* represents a significant difference from the control group p < 0.05; # represents a significant difference between PCOS and PCOS/MOE P < 0.05).
3.8. MOE Decreased Serum LH in the DHEA-induced PCOS Rats
We measured the serum LH levels in DHEA/PCOS rats and MOE-treated rats, as well as in controls. As seen at 28 days, the DHEA-treated rats retained a significant elevation in their average serum levels of LH (9.54 ± 5.75 ng/mL) at 59 days as compared to the controls (5.04 ± 0.72 ng/mL). However, when treated with MOE, the PCOS rats showed a statistically significant decrease in the levels of serum LH (3.9 ± 1.83 ng/mL) as compared to the non-treated PCOS rats (Figure 5C).
3.9. PPARγ, Akt, and IRS1 Levels Increased in the MOE-treated PCOS Rats
Western blot analysis of the total protein extract from the ovaries of all three groups was performed. As seen at 28 days, the DHEA-treated PCOS rats showed a statistically significant decrease in the expression of PPARγ, Akt, and IRS1 at 59 days as compared to controls. However, when the PCOS rats were treated with MOE, there was a significant increase in the ovarian expression of PPARγ, Akt, and IRS1 compared to non-treated PCOS rats (Figures 6A, C, and D, respectively).
, and PCOS rats treated with MOE (PCOS/MOE), along with the corresponding β-actin, and graphical representation of the protein expression normalized to β-actin and expressed as fold of control for (A) PPARγ, (B) p-mTOR and mTOR, (C) Akt and (D) IRS1. Values are presented as the mean ± SEM (* represents a significant difference from the control group P < 0.05; # represents a significant difference between PCOS and PCOS/MOE P < 0.05).")
MOE-treatment increases PPARγ, Akt, and IRS1, while decreasing mTOR protein expression in DHEA-induced PCOS rats. Typical western blots of control, DHEA-treated rats (PCOS), and PCOS rats treated with MOE (PCOS/MOE), along with the corresponding β-actin, and graphical representation of the protein expression normalized to β-actin and expressed as fold of control for (A) PPARγ, (B) p-mTOR and mTOR, (C) Akt and (D) IRS1. Values are presented as the mean ± SEM (* represents a significant difference from the control group P < 0.05; # represents a significant difference between PCOS and PCOS/MOE P < 0.05).
3.10. The p-mTOR Expression Decreased in the MOE-treated PCOS Rats
As seen at 28 days, DHEA treatment induced a significant increase in p-mTOR levels in the rat ovaries compared to the control group. However, when followed by MOE treatment, there was a decrease in p-mTOR expression in the ovaries of DHEA/PCOS rats compared to the non-treated rats and controls (Figure 6B).
4. Discussion
PCOS is a multifactorial endocrine, reproductive, and metabolic disorder that affects women in their reproductive years (27). Among the various experimental animal models established for the induction of PCOS, the DHEA model implemented in our study has been shown to generate both PCOS traits and IR (28). We confirmed that DHEA exposure of post-pubertal Sprague Dawley rats resulted in an increase in body weight, number of cystically dilated follicles, serum LH, fasting serum insulin, and HOMA-IR, as compared to age- and weight-matched controls. Compared to the control group, PCOS rats had a significantly lower ovarian protein expression of PPARγ, IRS1, and Akt. Conversely, the PCOS group showed an increased mTOR pathway activity as evident by an increased protein expression of phosphorylated mTOR as compared to controls. When treated with oral MOE, the DHEA-induced PCOS rats showed a statistically significant decrease in body weight, LH serum levels, and the number of cystically dilated follicles compared to the non-treated PCOS rats, but not to control rats. In the MOE-treated rats, the protein expression of PPARγ, IRS1, and Akt was increased, while the mTOR activity was decreased compared to the non-treated PCOS group. Thus, MOE activates PPARγ in the ovaries and ameliorates the DHEA-induced PCOS phenotype. The effects of MOE may be, in part, due to the activation of the PI3K pathway and/or inhibition of the mTOR pathway.
In the current study, there was a significant increase in the rats’ body weight gain compared to controls around the third week after starting DHEA injections. Kim et al. noted a similar pattern of body weight increase with DHEA injections of Sprague Dawley rats that also developed PCOS (29). Moreover, PCOS and obesity have long been linked in many human studies. In a recent meta-analysis, obesity was found to be more prevalent in women with PCOS than in non-PCOS age-matched women (30). However, in 2013, it was suggested that the higher rate of obesity in PCOS women compared to control may be a bias of increased self-referral of overweight women (31). Indeed, PCOS is seen in both lean and obese females (30). Furthermore, the global differences in body mass index (BMI) of various populations do not relate to the prevalence of PCOS in these populations; hence, a causal role of obesity in PCOS is unlikely (32). The exact link between obesity and PCOS remains unclear. Our experimental model mimics many of the symptoms of PCOS. The weight gain we detected in the DHEA-injected rats may be part of the PCOS phenotype or an effect of the androgen injection (4). MOE treatment of the DHEA/PCOS rats in our work resulted in a decrease in average body weight compared to the non-treated PCOS rats and even to control rats. Regardless of the mechanism of weight loss seen, this finding may suggest an anti-obesity utility for MOE.
We have confirmed that DHEA injections resulted in an increased serum LH level and in the number of cystically dilated follicles on ovarian histology. The histological findings were consistent with those used in the literature to diagnose PCOS (33). The elevated LH, on the other hand, has been linked to premature luteinization of the granulosa cells, hypertrophy, and post-ovulatory follicular changes, and follicular arrest (3). Therefore, the follicular arrest seen in the PCOS groups might be due to excess serum LH. In PCOS, a disrupted hypothalamic GnRH secretion may lead to elevated serum LH, resulting in hyperandrogenic theca cells, follicular arrest, and increased number of pre-antral follicles (34, 35). In this study, the serum LH levels normalized when the PCOS rats were treated with MOE. This may possibly explain the reversal of the phenotype with a significantly reduced number of cystic follicles in the ovaries compared to non-treated PCOS rats.
We have noted that injection of rats with DHEA resulted in metabolic derangement, namely the development of IR as measured by HOMA-IR. PCOS is known to be associated with an increased risk of metabolic abnormalities, including IR and type II diabetes (5). IR is suspected to play a major role in the pathogenesis of PCOS, although the exact pathophysiologic association between IR and PCOS remains undetermined (6). The DHEA-injected rats in our study had normal fasting glucose but developed hyperinsulinemia as compared to controls. Hyperinsulinemia further aggravates the hyperandrogenic phenotype in PCOS by inhibiting the hepatic synthesis of SHBG (9), thus increasing the availability of free testosterone in circulation (10).
Insulinomimetic peptides such as IGF1 are integral to the normal female body growth, patterning, and metabolism during puberty (36). IGF1 regulates oocyte and follicular development, with strong evidence suggesting its possible involvement in the pathogenesis of metabolic syndrome and PCOS (37). IGF1 and its binding protein IGFBP1 are secreted by the ovary and the liver. The highest rates of IGF-1 production occur during the pubertal growth spurt. IGF1 levels are increased in PCOS women, while IGFBP1 levels decrease, leading to an arrest in the development and the growth of the follicles (38). Even among healthy females, a state of transient IR, associated with the increased activity of the IGF1, occurs mid-puberty followed generally by a return of insulin sensitivity (39). It may be during this time that PCOS develops in genetically susceptible females.
There is an apparent overlap between the pathogenesis of IR and PCOS. In recent years, insulin sensitizing agents have been successfully utilized in managing symptoms of PCOS (12, 40). TZD treatment has demonstrated increased induction of ovulation and increased rate of pregnancy in PCOS patients (41). TZDs act via activating the PPARγ. PPARγ regulates ovarian functions and is downregulated by increased LH levels (14) as those seen in PCOS. In this study, the DHEA/PCOS rats treated with MOE showed an increase in the ovarian expression of PPARγ compared to the PCOS group. Therefore, it is possible that direct ovarian PPARγ activation may be, in part, responsible for the improvement in PCOS symptoms seen with MOE, as is the case with TZDs.
MOE treatment of the DHEA/PCOS rats in our work showed an inhibition of the mTOR pathway in the ovary. This was evident by a decrease in the expression of the phosphorylated form of mTOR. Magnolol has been previously shown to inhibit mTOR in vitro (20, 42). Additionally, studies have shown that in PCOS, mTORC1 is hyperactivated, while the insulin signal via the PI3 kinase/Akt pathway is attenuated (43-45). It has been postulated that the mTORC1 hyperactivation, triggered by elevated LH or androgens, generates a negative feedback loop on the insulin signaling pathway resulting in IR (43-45). We observed the same findings in our DHEA/PCOS rats, where p-mTOR was increased, while Akt and IRS1 expression was decreased, potentially contributing to the IR. However, upon our treatment of the DHEA/PCOS rats with MOE, the Akt and IRS-1 expression increased, supporting a potential insulin sensitizing effect of the extract on the ovaries.
TZDs and metformin improve insulin sensitivity by activating, directly or indirectly, the cellular energy sensor AMP-activated protein kinase (AMPK) (46). PPARγ agonists are known activators of the AMPK pathway (47). AMPK has a plethora of metabolic and proliferative effects, including negatively regulating mTORC1 (46, 48). Thus, PPARγ agonist may, at least in part, improve insulin sensitivity through an AMPK-dependent signal. As a PPARγ agonist, MOE may exert an inhibitory effect on the mTOR pathway via activation of the AMPK pathway. In doing so, MOE removes the negative feedback loop on the insulin signaling pathway and restores insulin sensitivity.
Insulin-induced mTORC1 activity increases the expression of sterol regulatory element binding protein-1 (SREBP-1), a conserved lipogenic transcription factor that regulates cholesterol synthesis and ovarian steroidogenesis (49). Interestingly, both SREBP-1 and mTOR activity are upregulated in animal models of type II diabetes (50), and the expression level of SREBP1 is increased in the ovary of PCOS mice (51) and in the serum of women with PCOS (52). Therefore, it is possible that elevated SREBP1 activity may contribute to abnormal ovarian hormone production characteristics of PCOS.
4.1. Conclusions
In this study, the treatment of DHEA-induced PCOS insulin resistant rats with MOE normalized the polycystic ovarian morphology, LH levels, and molecular parameters. This effect may possibly be attributed to the PPARγ agonist properties of MOE and its ability to inhibit mTOR and activate the PI3k pathway, restoring insulin sensitivity. This study increased our understanding of the pathophysiological link between IR and PCOS. Finally, our results advocate the potential role of natural PPARγ agonists in the treatment of PCOS, where synthetic agonists have shown benefit yet, at the same time, serious and potentially fatal side effects.
