1. Background
Olive oil originates from the fruit of the olive tree (Olea europaea L.) (1, 2). This oil, a significant and profitable product in the Mediterranean region, is prized for its excellent flavor and aroma. Its nutritional value and health benefits are recognized worldwide (3, 4).
The International Olive Oil Council (IOOC) categorizes olive oils into extra virgin, virgin, lampante, refined, and pomace oils (5). The European Union Commission also classifies olive oils based on quality, distinguishing between extra virgin olive oil (EVOO), lampante olive oil (LOO), and refined olive oil (ROO). Olive oil quality ranges from extra virgin to pomace olive oil (6).
Edible vegetable oils, which are higher in nutritional value compared to animal oils and cholesterol-free, are healthier and more popular. They provide essential unsaturated fatty acids and bioactive compounds crucial for human health, offering protection against various diseases (7, 8). Virgin olive oil contains beneficial substances such as monounsaturated fatty acids (particularly oleic acid), tocopherols, carotenoids, and phenolic compounds, contributing to its antioxidant effects (9). Due to its high antioxidant content, olive oil has several beneficial effects on human health, including positive impacts on the cardiovascular system and cholesterol balance. However, despite these positive attributes, olive oil quality can be compromised by expiration, fraud, and degradation (10).
The lack of authenticity in oil, a global concern, poses potential health risks for consumers (11). In the 1980s, adulterated oils led to over 400 deaths and 20,000 fatalities (12). Oil authenticity can be compromised in two ways: Mixing virgin olive oil with lower-quality oils like olive pomace oil or blending inexpensive vegetable oils with olive oil (11). Due to the higher cost of olive oil compared to other vegetable oils, adulteration with cheaper alternatives is common (13, 14). The elevated cost of olive oil is attributed to the labor-intensive and time-consuming processes involved in its cultivation, harvesting, and extraction, making it a target for fraud. In addition to economic impacts, olive oil adulteration poses significant health risks for consumers (4).
Since high-quality olive oil is often mixed with inexpensive oils like corn, sunflower, sesame, and nuts (15, 16), it is crucial to assess olive oil authenticity (15). Various methods have been established for evaluating olive oil authenticity (12). High-performance liquid chromatography (HPLC) and gas chromatography (GC) have traditionally been used to detect adulteration in olive oil. However, due to their complex extraction processes, substantial use of organic solvents, and time-consuming analyses, there is a recommendation to replace these methods with faster, cheaper, simpler, and non-destructive techniques like near-infrared spectroscopy (NIRS). The eco-friendliness of NIR makes it appealing to industrial, control, and research laboratories (1). This method is commonly used in the pharmaceutical and food industries for quality control (2). NIR data can be analyzed using chemometrics for multivariate screening and data analysis (17).
While data collection is time-consuming, the conversion of raw data into information is crucial for analysis. Chemometrics offers several advantages, including the ability to extract real-time information from raw data faster, derive high-quality information, improve measurements, and reduce the need for additional capital (18).
2. Objectives
In this study, the adulteration of olive oil with cheaper vegetable oils such as sunflower oil, soybean oil, corn oil, and canola oil was investigated using the NIR technique, a novel alternative to traditional analytical methods, coupled with chemometrics analysis. Spectroscopic techniques offer cost-effectiveness and prompt information presentation and do not necessitate specific sample pretreatment.
3. Methods
3.1. Sampling
A total of 100 olive oil samples were gathered from the markets of Tehran and Roudbar. Out of these, 34 samples were directly acquired from growers in the olive-rich region of Roudbar, Iran. Roudbar's favorable geographical conditions, resembling those of olive-producing countries like Italy, which have Mediterranean climates, yield high-quality olives and exceptionally flavorful oil. Hence, locally sourced oils from Roudbar were obtained, ensuring authenticity through verified oil extraction processes. Additionally, 66 samples from seven different brands were procured from the local market in Tehran, Iran, under consistent storage conditions, ensuring the representation of various batches between April and December 2021.
Standards of olive, soybean, corn, canola, and sunflower oils were obtained from Sigma Company (Sigma, St. Louis). These oils served as the adulterants in the study.
To examine various mixtures of olive oil and the mentioned adulterants, binary and ternary blends were prepared. For binary mixtures, different percentages of olive oil standard along with the specified adulterants (ranging from 0 to 100 with intervals of 20) were prepared for investigation (e.g., a mixture containing 20% olive oil and 80% corn oil). Additionally, various percentages of two adulterant types (5 - 15%, 10 - 10%, and 15 - 5%) were added to the olive oil standard to better assess adulteration (e.g., a mixture containing 5% corn oil, 15% sunflower oil, and 80% olive oil). Furthermore, certain samples were randomly selected and mixed with 10%, 20%, 30%, and 40% of olive, soybean, corn, and sunflower oil standards. These mixtures were then analyzed using NIR.
3.2. Determination of Adulteration by NIR
To acquire spectra, a Perkin Elmer NIR instrument equipped with a tungsten halogen source and an InGaAs detector was utilized. The signals were recorded within the range of 12,000 to 4000 cm-1, with 64 scans collected at a nominal resolution of 8 cm-1. All spectra were obtained at room temperature, without any additional sample treatments, using reflectance mode on individual olive oil samples. Prior to NIR spectral data acquisition, background spectra were obtained from an empty cell, which included peaks from dissolved gases, H2O, and CO2 in the air. These background spectra were used to correct the sample spectrum. Three replicates of each olive oil sample were measured and averaged prior to data preprocessing. The acquired data were exported from Spectrum Quant software as ASCII files and then imported into Unscrambler software (version 9.0 by Camo) for subsequent chemometrics analysis.
3.3. Chemometrics Analysis
Due to the significant number of variables generated in this method, along with the physical characteristics and particle size present in olive oil samples, certain issues, such as changes in path length, light scattering, overlapping bands, and baseline shifts, commonly arise. Therefore, the utilization of preprocessing methods becomes necessary to extract meaningful and valuable information from this extensive dataset. Various preprocessing methods are employed for NIR data, which can be categorized into two main groups: Spectral derivatives and scattering correlation methods. Among the scattering correlation preprocessing methods, the most commonly used techniques include standard normal variate (SNV), detrending (DT), and multiplicative scattering correction (MSC). These methods are applied to mitigate the additive effects caused by scattering, particle size variations, and differences.
SNV preprocessing is applied to NIRS data to eliminate undesired systematic variations, such as baseline shifts and multiplicative effects resulting from instrumental or environmental factors. The SNV algorithm calculates the mean and standard deviation of each spectrum and then normalizes the data by subtracting the mean and dividing by the standard deviation. By implementing SNV preprocessing, the spectral data are centered and scaled, which enhances the relevant spectral features while reducing unwanted variations.
In this research, various preprocessing methods were employed, and upon evaluating the outcomes, the SNV and Detrend methods proved to be the most suitable for the olive oil data. Data preprocessing and analysis were conducted using Unscrambler X 14 software (CAMO software, Norway).
In this study, a PCA algorithm was applied to the average spectra of the collected samples using different preprocessing techniques to examine potential clustering and outliers. Principal Component Analysis (PCA) is an unsupervised multivariate statistical technique utilized for data analysis and pattern recognition. It involves transforming a set of correlated variables, such as spectral intensities or chromatographic peaks, into a new set of uncorrelated variables known as principal components. These components are linear combinations of the original variables and are arranged based on the variance they explain in the data. By reducing the dimensionality of the data, PCA simplifies complex datasets and emphasizes significant variations. It aids in outlier detection, grouping similar samples, and identifying important variables contributing to observed patterns.
4. Results and Discussion
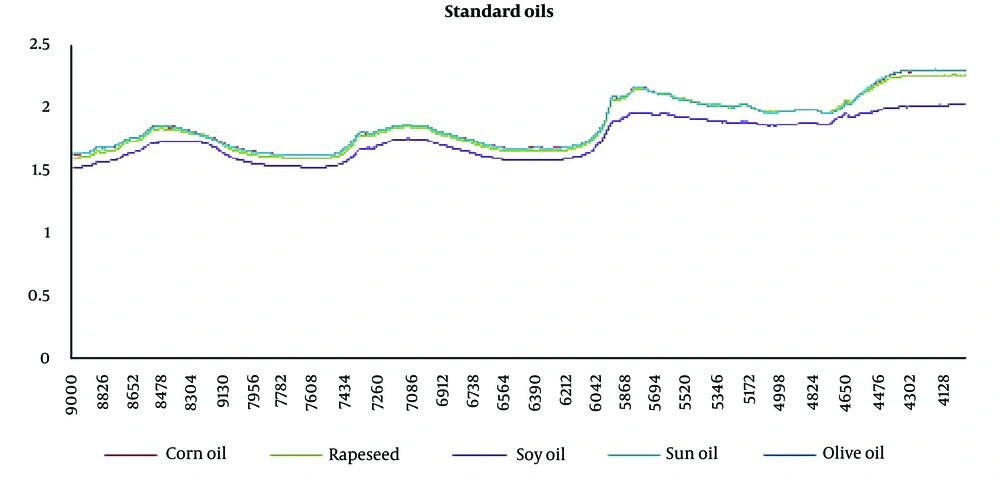
In the present study, the assessment of olive oil fraud was performed using the NIR method. Since interpreting data achieved by NIR is difficult, chemometrics helps us to analyze it better. The combination of NIR and chemometrics is one of the strongest tools for quantitative and qualitative food analysis (19). For this purpose, the adulteration of olive oil with other edible oils was evaluated. The edible oils considered include soybean, sunflower, corn, and canola oils as the most common adulterants. First, NIR was used to obtain spectra, and then PCA was used for further data analysis. The NIR spectra achieved from oil standards, including olive, soybean, sunflower, corn, and canola oils, are shown in Figure 1.
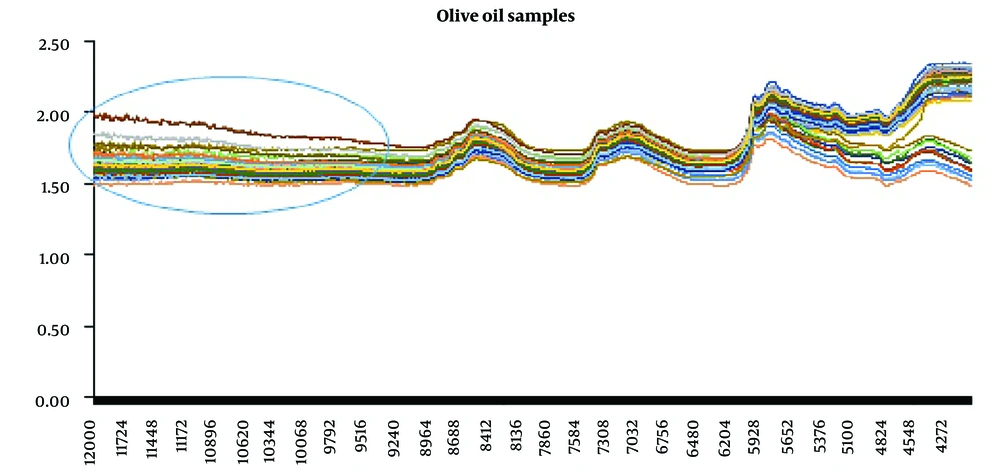
The obtained spectra from all samples (standard oils, binary and ternary mixtures, and market samples) are illustrated in Figure 2.
As seen in Figure 2, the range of 12,000 – 9000 cm-1 did not provide beneficial information, so it was excluded from the analysis. Therefore, the analysis area used was 9000 - 4000 cm-1.
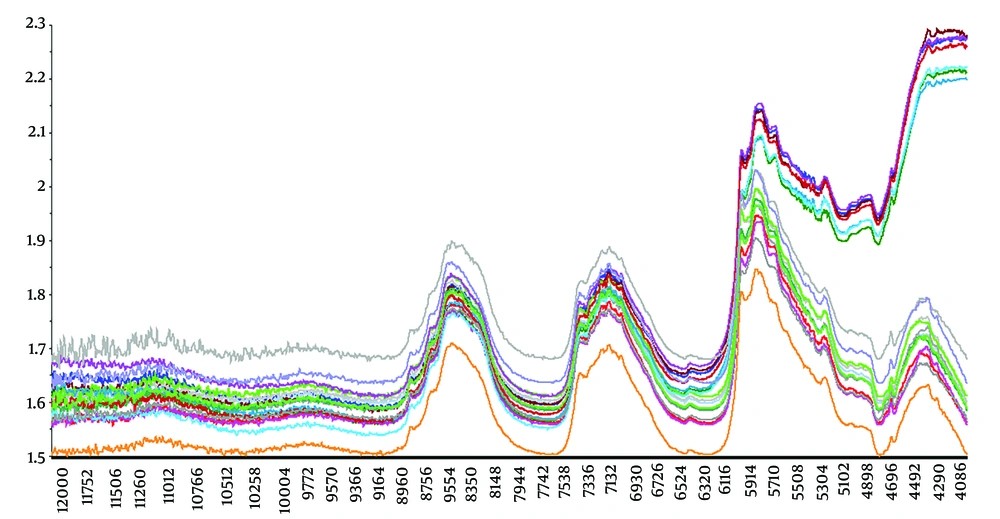
After applying various preprocessing methods, it was concluded that SNV and detrend were the most effective methods for better preprocessing. The SNV transformation of NIRS data effectively separated the three groups in PCA. The spectra of the samples after applying the mentioned preprocessing methods are presented in Figure 3.
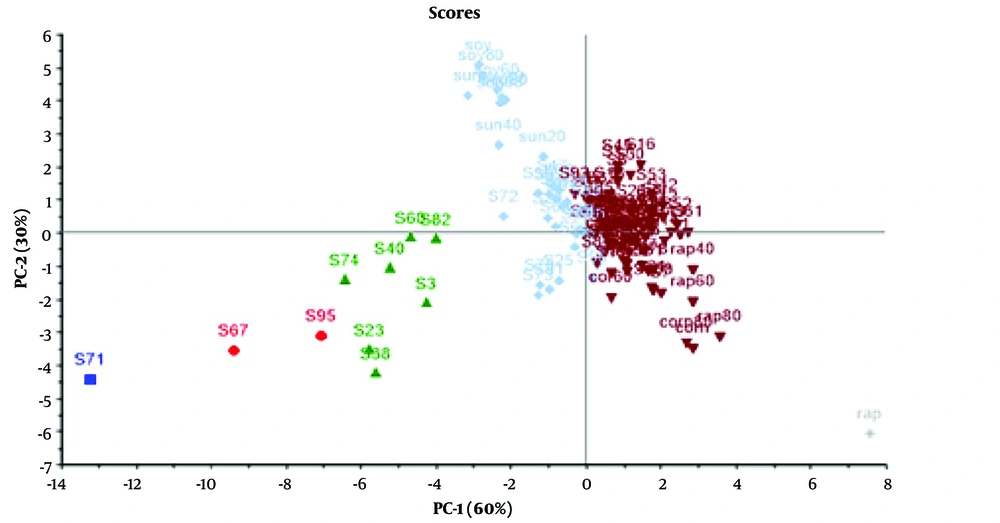
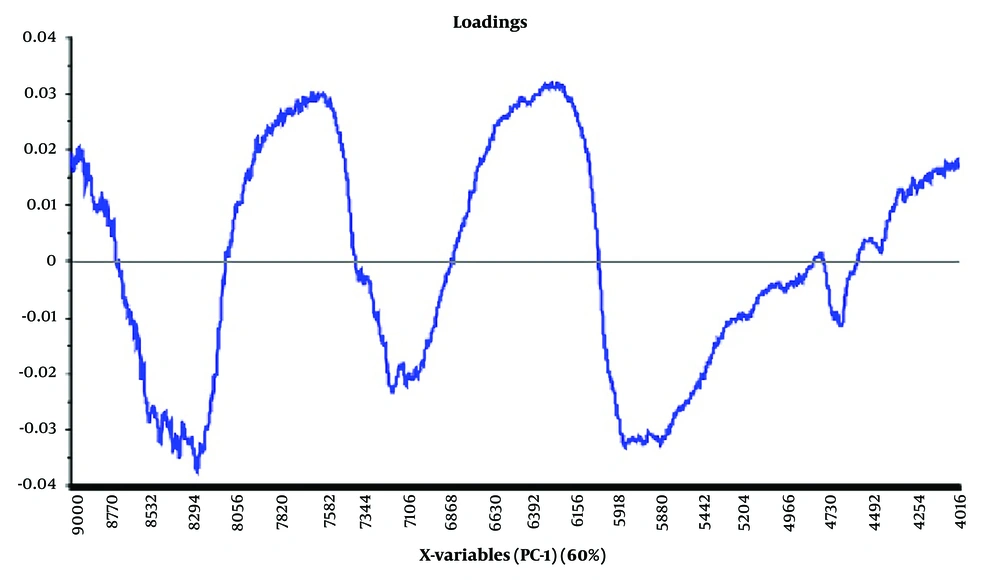
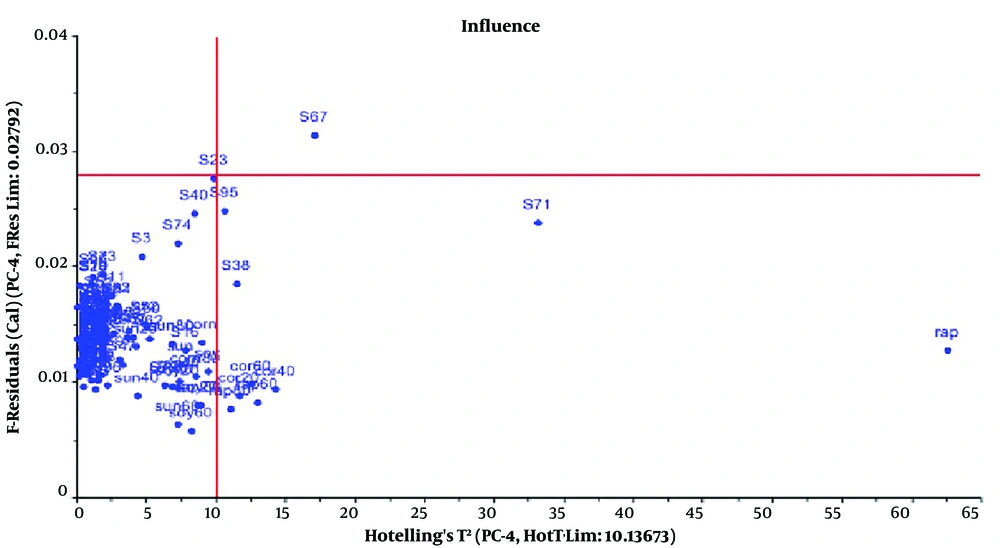
The PCA method was utilized to analyze the preprocessed data. The PCA output containing score, loading, and T2 Hotelling plots are displayed in Figures 4 - 6, respectively.
According to the score plot shown in Figure 4, the samples were completely separated from each other in different directions and divided into three groups: Brown points (representing samples containing olive, corn, and canola oils), blue points (representing samples containing soybean and sunflower oils), and green points (representing samples not falling into any of the categories used in our study, possibly indicating the use of other oils as fraud). The highest adulteration rate was observed in samples containing around 40% corn and canola oils. The prevalence of these types of adulteration could be attributed to the lower price and greater availability of corn and canola oils compared to olive oil in Iran.
Regarding the loading plot, which depicts the variance of the variables, the area with the highest variance (the highest peak) is the best area for separation due to the greatest difference between the peaks. In olive oil samples, this area was observed at points 8294, 7582, 6392, and 5918.
To identify outliers, Hotelling T2 distances were calculated per variable and per sample. Two adulterated samples from NIR surpassed their respective 95% threshold, thus qualifying as outliers (Figure 6). Therefore, they were excluded from the study. A summary of some studies on the adulteration of olive oil is presented in Table 1.
| Authors | Year | Considered Adulterants | Used Technique |
|---|---|---|---|
| Jiménez-Carvelo et al. (1) | 2019 | Soybean oil, corn oil, sunflower oil | Near-infrared and fluorescence spectroscopy |
| Li et al. (15) | 2019 | Canola oil | Near-infrared and mid-infrared spectroscopy |
| Vanstone et al. (20) | 2018 | Corn oil, sunflower oil, soybean oil, canola oil | Near-infrared spectroscopy |
| Jiang and Chen (21) | 2019 | Peanut oil, sunflower seed oil, soybean oil, sesame oil, maize oil | Fourier transform near-infrared spectroscopy |
| Mendes et al. (22) | 2015 | Soybean oil | Near-infrared, mid-infrared, and Raman spectrophotometry |
| Kasemsumran et al. (23) | 2005 | corn oil, hazelnut oil, soya oil, sunflower oil | Near-infrared spectroscopy |
| Duraipandian et al. (24) | 2019 | Corn, soybean, and rapeseed oil | Raman spectrophotometry |
| Vieira et al. (25) | 2021 | soybean oil, corn oil, canola oil, sunflower oil | Fourier transform near-infrared spectroscopy |
In the current study, olive oil authentication was evaluated with adulterants such as corn oil, canola oil, soybean oil, and sunflower oil. These oils were chosen as fraudulent due to their low cost and availability in Iran's market, and they are commonly used to adulterate olive oil samples.
Considering that olive oil samples in the market may contain multiple fraudulent components, it is important to assess mixtures of several adulterant oils. Therefore, in this study, mixtures of olive oil with one and two adulterants were evaluated for better assessment. This approach extends beyond previous studies, which typically investigated only binary mixtures of olive oil.
NIRS presents both strengths and weaknesses when applied to food adulteration detection. The strengths of this method include:
(1) Non-destructive and rapid analysis: NIRS is a non-destructive technique that allows for the analysis of intact samples without extensive sample preparation. It provides quick results, facilitating high-throughput analysis.
(2) Versatility: NIRS can be applied to a wide range of samples, including solid, liquid, and powder forms, making it suitable for various industries such as agriculture, pharmaceuticals, and food processing.
(3) Quantitative and qualitative analysis: NIRS can be used for both quantitative and qualitative analysis, enabling the determination of specific component concentrations and the identification of unknown substances.
(4) Real-time monitoring: NIRS allows for real-time process monitoring, making it valuable for quality control and process optimization in industries.
However, this method also has certain limitations, including:
(1) Limited penetration depth: NIR light has limited penetration depth, making it less suitable for samples with significant thickness or opacity. This limitation can restrict its applicability in certain scenarios.
(2) Sensitivity to sample variability: NIRS is sensitive to variations in sample composition, such as moisture content, particle size, and sample homogeneity. These variations can affect the accuracy and reliability of the analysis.
(3) Calibration requirements: NIRS necessitates the development and validation of calibration models using reference methods or data. This process can be time-consuming and requires expertise to ensure accurate and reliable results.
(4) Equipment cost and complexity: Acquiring and maintaining NIRS equipment can be costly. Furthermore, data analysis and interpretation may require specialized knowledge and expertise.
When considering the suitability of NIRS for a specific analysis, it is crucial to take into account the particular application and sample characteristics. The investigation of food fraud involves the identification and prevention of intentional adulteration, mislabeling, or misrepresentation of food products for economic gain. NIRS can be a valuable tool in these kinds of investigations. Due to its ability to provide quick results, NIRS is particularly suitable for the rapid screening of a large number of samples in fraud investigations, including online analysis. Consequently, this method can assist in prioritizing further research on suspicious samples and saving time. Additionally, the utilization of portable devices available in the market enables swift initial screening of samples (26, 27).
5. Conclusions
In the current study, it is demonstrated that using the NIR technique along with chemometrics methods can be a beneficial and concise method for detecting adulteration in foods with complex matrices, such as olive oil. It can be concluded that corn oil and canola oil were dominant adulterants in olive oil samples due to their cheapness and availability in Iran. Since more than one type of fraud was found in the examined samples in this study, it is recommended that other types of fraud be investigated simultaneously in future studies.
