1. Background
Arteriosclerosis is a life-threatening illness affecting the cardiovascular system and promoting coronary heart disorders. Increased serum cholesterol has been proven to be a primary risk factor in atherosclerosis progression. Recently, numerous therapeutic agents have been developed to reduce serum cholesterol in the treatment of hypercholesterolemia, with statins being the most commonly used drug. However, undesirable side effects of these drugs, such as liver dysfunction, rhabdomyolysis, cognitive impairment, and myositis, have raised concerns about their long-term use (1).
Currently, atherosclerosis and fatty liver disease lack effective treatments. Hyperlipidemia treatments often require high daily doses, leading to complications in patients. While statins are among the most effective drugs for reducing LDL, they have serious side effects, including liver failure, liver enzyme damage, myopathy, myositis, and rhabdomyolysis. Second-line drugs for hyperlipidemia treatment, such as fibrates, can cause serious side effects like increased creatinine and kidney damage. Bile acid-binding agents also increase patient complications (2). Due to these drawbacks, several non-pharmacological approaches, including dietary modifications, have been developed to significantly reduce elevated blood cholesterol levels (3).
Reports indicate that changes in lifestyle, including diet, behavioral therapies, and natural medicines such as medicinal plants, could prevent the progression of this condition. Recent studies have demonstrated the important role of acidophilic bacteria in reducing cholesterol levels. This reduction shows the dramatic effect of probiotics in lowering cholesterol. However, many questions remain regarding the mechanism of probiotics' effects in the treatment process (4).
Probiotics are friendly living microorganisms that have beneficial effects on host health and immune responses. They do this by modulating the intestinal microbial flora, acidifying the microenvironment, and limiting inflammatory cytokine production and the progression of the inflammatory cascade. They are generally non-pathogenic microorganisms, with most studies focusing on lactic acid-producing bacteria (5). The exact mechanism of probiotics' effects is not clearly understood, but several mechanisms have been suggested, including the production of bacterial inhibitory compounds, modification of intestinal pH, blocking of bacterial binding sites, competition for material and nutrient absorption, and enhancement of the immune system (6). Recent research indicates that the administration of probiotics decreases LDL-C levels, improves the LDL-C/HDL ratio, and reduces blood pressure. Furthermore, a primary lipid-lowering property was observed with the administration of lactobacilli probiotics (7). These studies suggest the lipid-lowering beneficial effects of Lactobacillus casei extract. However, future studies are needed to determine the optimal dose of this extract and explore methods like lyophilization to increase stability, reproducibility, and patient acceptance (8).
2. Objectives
The initial stages of this study involved selecting and evaluating the effective oral dosage of a lyophilized powder containing probiotics and prebiotic compounds for better control of hyperlipidemia. The results from the in vivo testing showed that this new treatment approach had a significant effect on managing lipid levels and liver enzymes such as ALP and AST. Additionally, a histopathological study showed that the lyophilized probiotic extract positively impacted liver tissue protection. These findings suggest that the probiotic lyophilized extract can be developed as a new supplementary and complementary approach in treating hyperlipidemia.
3. Methods
3.1. Microorganisms and Culture Media
The probiotic strain (Lactobacillus casei PTCC: 1058) was purchased from PTCC (Persian Type Culture Collection, Iran). The culture media (de Man Rogosa Sharpe (MRS) broth and agar) were obtained from Merck, Himedia, Germany. Cholesterol, D-Mannitol, fructose, formalin, ketamine, normal saline (0.9%), dextrose (5%), and ether were all obtained with analytical grade.
3.1.1. Microbial Culture
Pure probiotic bacteria were grown in MRS broth anaerobically (37°C, 24 hours). These conditions were achieved using an anaerobic glove box (Anoximat incubator, Germany) with 5% CO2 (8).
3.1.2. Determination of Growth Rate of Probiotic Bacteria
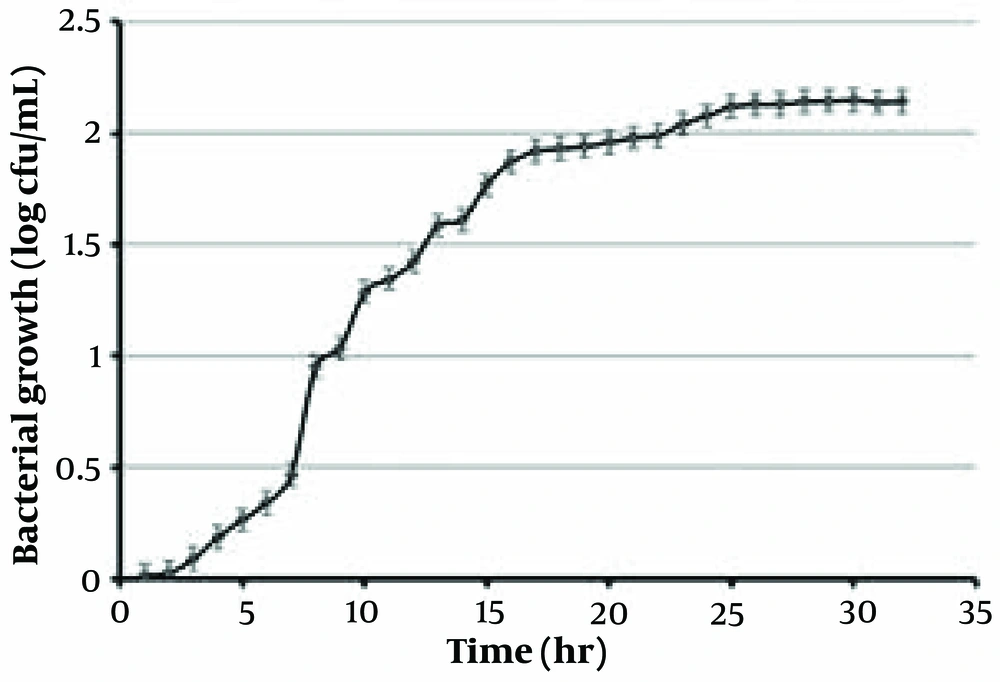
The growth rate of the probiotic bacteria was estimated by inoculating 1 mL (equal to 10³ CFU/mL) of the freshly cultured probiotic into 100 mL of MRS broth. The flask was then shaken and incubated (37°C, 32 hours), and the growth rate was evaluated using optical density.
3.1.3. Preparation of Supernatant Cell-free Probiotics Bacteria
After 24 hours of incubation, the supernatant was obtained by centrifuging at 4000 rpm for 15 minutes at 20°C. The supernatant was then passed through a sterile filter (pore size 0.22 μm). Finally, the mixture of probiotic bacterial metabolites was collected and stored at 4°C.
3.1.4. Preparation of Stable Probiotic Powder
The stability of the obtained probiotic supernatant was enhanced using the freeze-drying method. In this procedure, 5% D-mannitol was added to the supernatant, and the mixture was stirred with a magnetic stirrer before being transferred into flasks. Finally, the samples were freeze-dried (-50°C, 48 hours) to obtain a stable powder (8).
3.2. Animals and Experimental Design
All procedures were performed in accordance with the ethical standards of Ahvaz Jundishapur University of Medical Sciences (U-95127). Male Wistar rats weighing 170 - 210 g were used. The rats were fed and maintained under standard conditions.
3.2.1. Inducing Hyperlipidemia and NAFLD
Fat, cholesterol, and fructose were used as hyperlipidemia-inducing agents. Hyperlipidemia was induced in all groups of animals (T1, T2, T3, and the negative control group) except the sham group. Animal feed was mixed with sheep fat (30%), fructose (20%), and cholesterol (0.4%). The weight of the animals was measured weekly. They were fed this high-fat diet for eight weeks. The hyperlipidemic rats were randomly divided into four groups (n = 5) as follows: The negative control group (Neg.), which received no treatment; the low-dose LPE-treated group (T-1), receiving 1 mL of LPE solution once daily at a dose of 60 mg/mL (equal to 273 mg/kg); the moderate-dose LPE-treated group (T-2), receiving 120 mg/mL (equal to 540 mg/kg); and the high-dose LPE-treated group (T-3), receiving 240 mg/mL (equal to 1080 mg/kg). The two-week treatment period then started. Each rat was administered the appropriate dose of LPE daily for two weeks via oral gavage using 20-gauge feeding needles (Popper and Sons, New Hyde Park, NY). The negative controls were supplemented with distilled water. All rats were anesthetized on the same day with an intraperitoneal injection (IP) of a mixture of ketamine and xylazine (80+ 10 mg/kg), and blood samples were collected via heart puncture (9).
3.2.2. Preparation of Serum and Liver Homogenate
The serum samples were obtained by centrifuging heparinized blood samples at 3000 rpm for 10 minutes and then stored at -20°C. The weight of the rats was measured during the two-week treatment, and the changes were evaluated. The liver tissue was isolated from the animals, washed with normal saline (0.9% N/S), and then fixed in 10% formalin solution for histopathological evaluations.
3.2.3. Biochemical Analysis
The concentrations of total cholesterol (TC), triglycerides (TG), high-density lipoprotein cholesterol (HDL-C), and low-density lipoprotein cholesterol (LDL-C) were measured using commercial kits (Pars Azmoon; IR, Iran) according to the manufacturer's instructions with a serum auto analyzer (BT-1500-A-A, Rome, Italy) (9).
3.3. Statistical Analysis
All results were expressed as the mean ± SD for each group. Statistical analysis was carried out using one-way analysis of variance (ANOVA) with SPSS software version 16. Tukey’s test was used for multiple comparisons. A P-Value of < 0.05 was considered statistically significant.
4. Results
4.1. Growth Kinetic of Lactobacillus casei
The growth curve of Lactobacillus casei is depicted in Figure 1. This curve reveals that Lactobacillus casei reaches the log phase after 8 hours. The generation time of L. casei is 1 hour (10).
4.2. The Level of Triglycerides
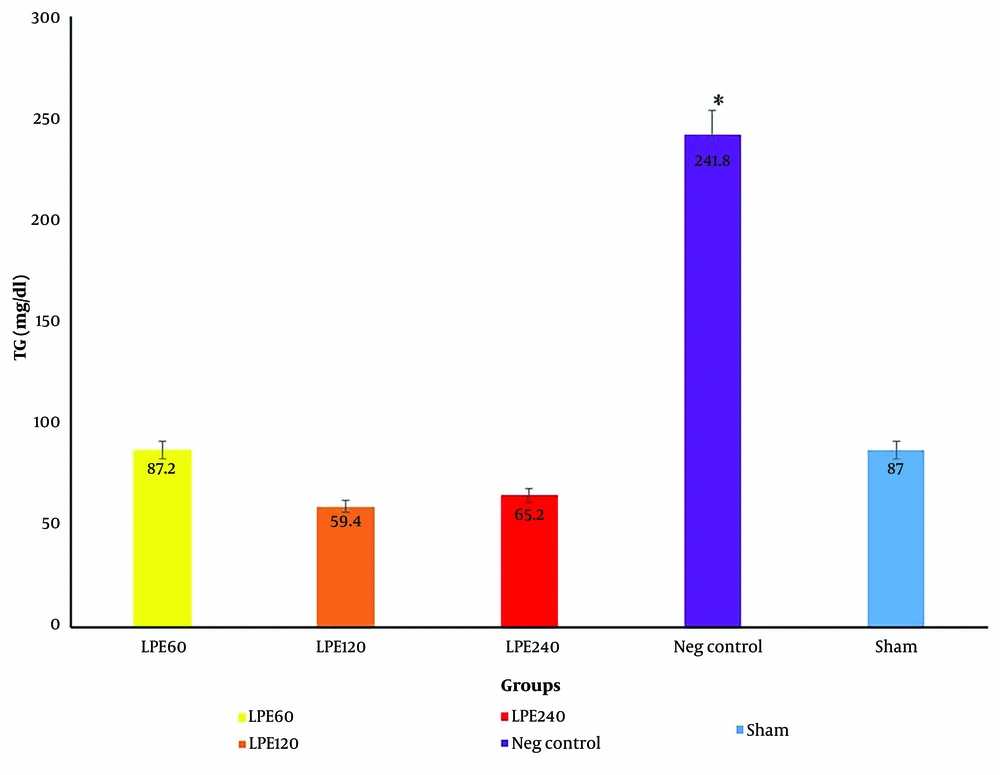
The level of TG in the negative control group was significantly higher than in the other groups (P < 0.05) (Figure 2). Lyophilized probiotic extract supplementation in all treatment groups (T1, T2, T3) significantly reduced the level of TG (P < 0.05). The level of TG did not change in the sham group.
The serum TG levels in five groups (n = 5). * Significant differences with other groups. Neg control: Hyperlipidemic rat group did not receive treatment. SHAM: Positive control groupT1: The hyperlipidemic rat group was treated with 60 mg/mL, LPE (270 mg/kg LPE) T2: The hyperlipidemic rat group was treated with 120 mg/mL, LPE (540 mg/kg LPE) T3: The hyperlipidemic rat group was treated with 240 mg/mL, LPE (1080 mg/kg LPE)
4.3. The Level of Total Cholesterol (TC)
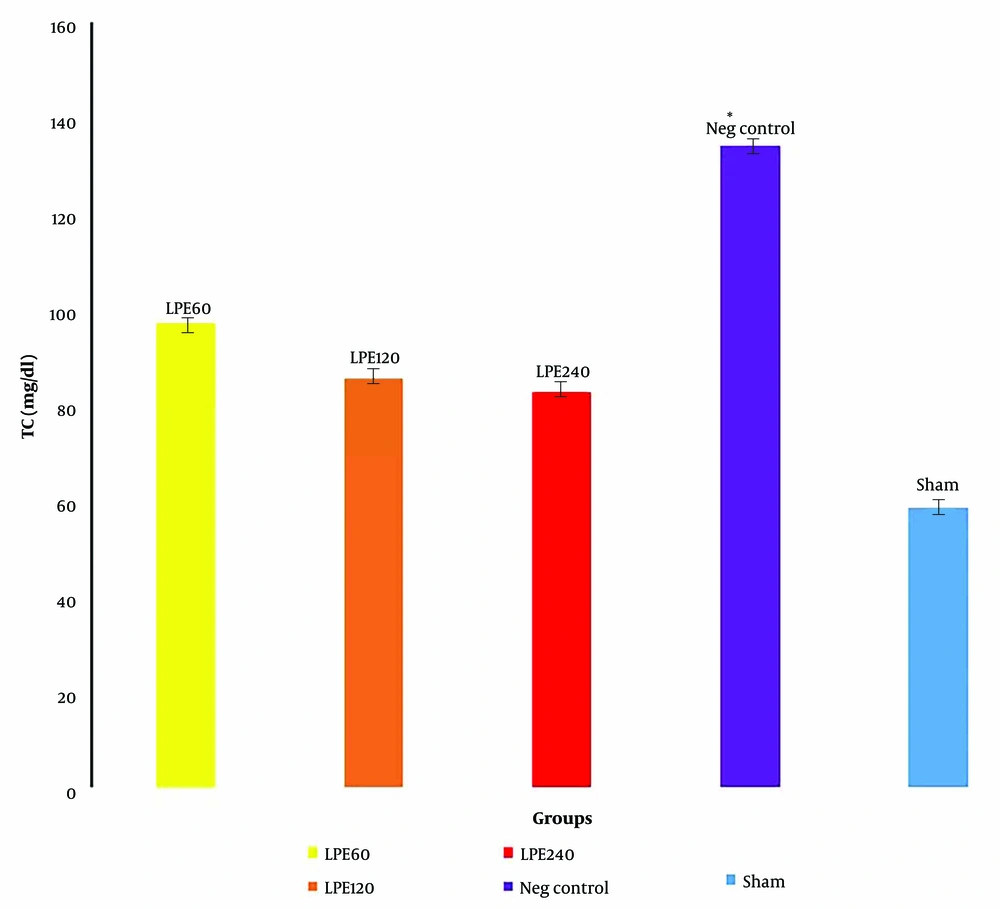
The negative control group had the highest serum cholesterol level, while the sham group had the lowest. All treated groups, compared to the negative and sham groups, showed a lower TC level. However, the decrease in TC level in all treated groups was not statistically significant (Figure 3).
The serum total cholesterol levels (n = 5)* Significant differences with other groups. Neg control: Hyperlipidemic rat group did not receive treatment. SHAM: Positive control group.T1: The hyperlipidemic rat group was treated with 60mg/mL, LPE (270 mg/kg LPE).T2: The hyperlipidemic rat group was treated with 120 mg/mL, LPE (540 mg/kg LPE).T3: The hyperlipidemic rat group was treated with 240 mg/mL, LPE (1080 mg/kg LPE).
4.4. The Level of HDL
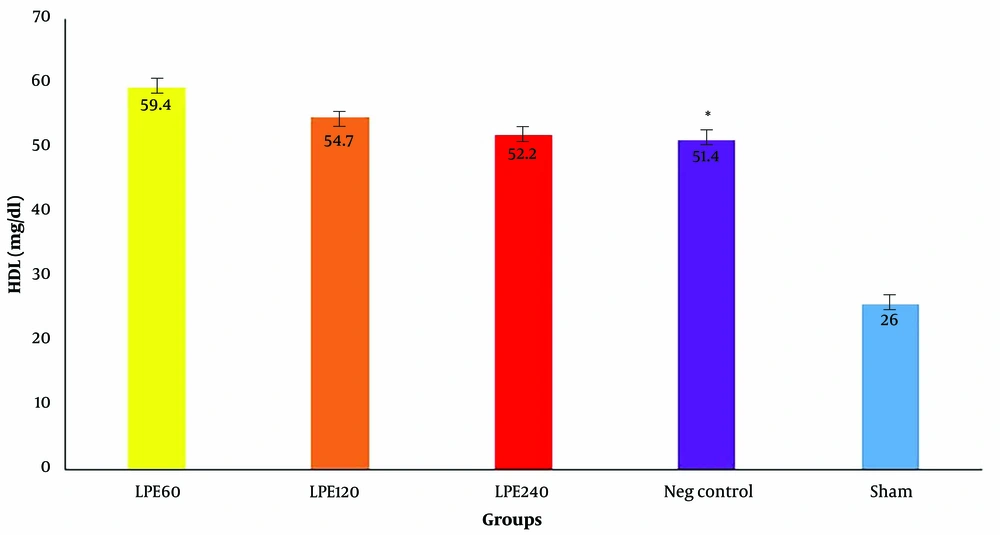
As shown in Figure 4, HDL levels in the negative control group are significantly lower than those in the other groups. The sham group has the highest HDL level. Among all groups treated with LPE (T1, T2, T3), the group that received 60 mg/dL (T1) had the highest HDL level, though the difference was not statistically significant compared to the other groups.
The serum HDL levels (n = 5). * Significant differences with other groups. Neg control: Hyperlipidemic rat group did not receive treatment. SHAM: Positive control group. T1: The hyperlipidemic rat group was treated with 60mg/mL, LPE (270 mg/kg LPE). T2: The hyperlipidemic rat group was treated with 120 mg/mL, LPE (540 mg/kg LPE). T3: The hyperlipidemic rat group was treated with 240 mg/mL, LPE (1080 mg/kg LPE).
4.5. The Level of LDL Serum
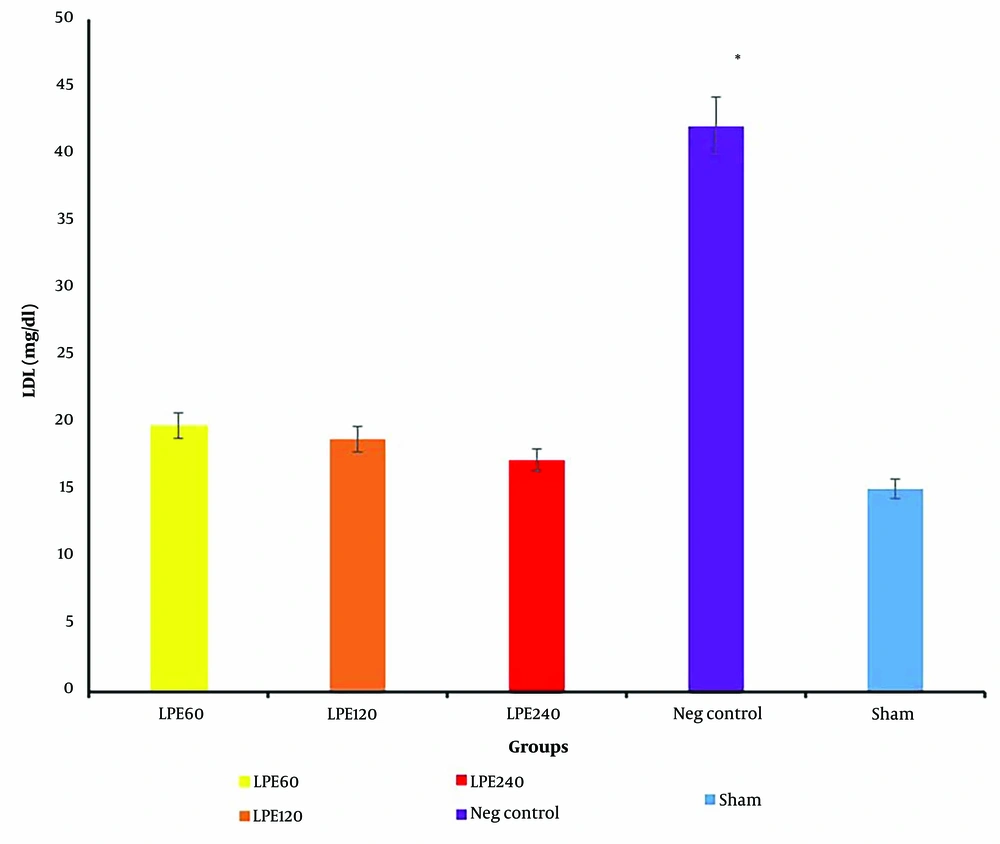
As shown in Figure 5, the negative control group has the highest LDL level. In all treated groups, a dose-dependent reduction in LDL is clearly observed. This indicates that LPE treatment has a beneficial effect on LDL reduction.
The serum LDL levels (n = 5). * Significant differences with other groups. Neg control: Hyperlipidemic rat group did not receive treatment. SHAM: Positive control group. T1: The hyperlipidemic rat group was treated with 60mg/mL, LPE (270 mg/kg LPE). T2: The hyperlipidemic rat group was treated with 120 mg/mL, LPE (540 mg/kg LPE). T3: The hyperlipidemic rat group was treated with 240 mg/mL, LPE (1080 mg/kg LPE).
4.6. The Level of ALP
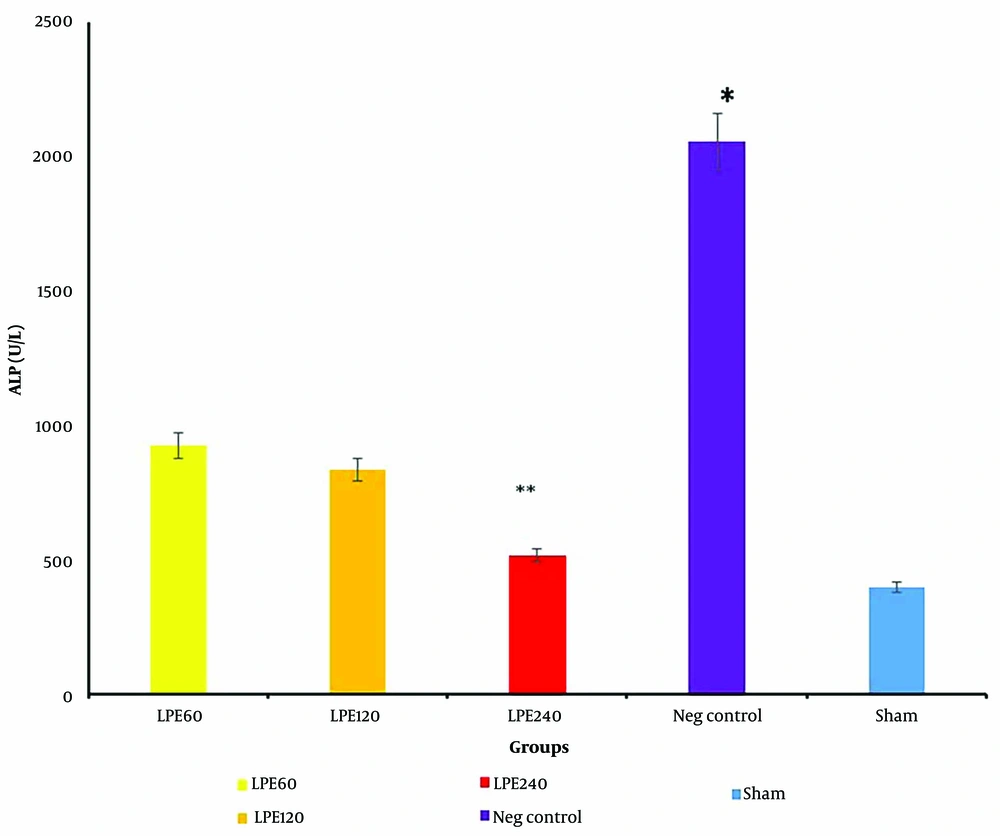
The ALP, a liver marker, was measured, and the results are shown in Figure 6. A dose-dependent effect is clearly evident in all treated groups. The negative control group has the highest ALP level (P < 0.001), while the sham group has the lowest ALP levels.
The ALP levels (n = 5 per groups). * Significant differences with other groups. ** Significant differences with T1 and T2. Neg control: Hyperlipidemic rat group did not receive treatment. SHAM: Positive control group. T1: The hyperlipidemic rat group was treated with 60mg/mL, LPE (270 mg/kg LPE). T2: The hyperlipidemic rat group was treated with 120 mg/mL, LPE (540 mg/kg LPE). T3: The hyperlipidemic rat group was treated with 240 mg/mL LPE (1080 mg/kg LPE).
4.7. Body Weight Changes Evaluation
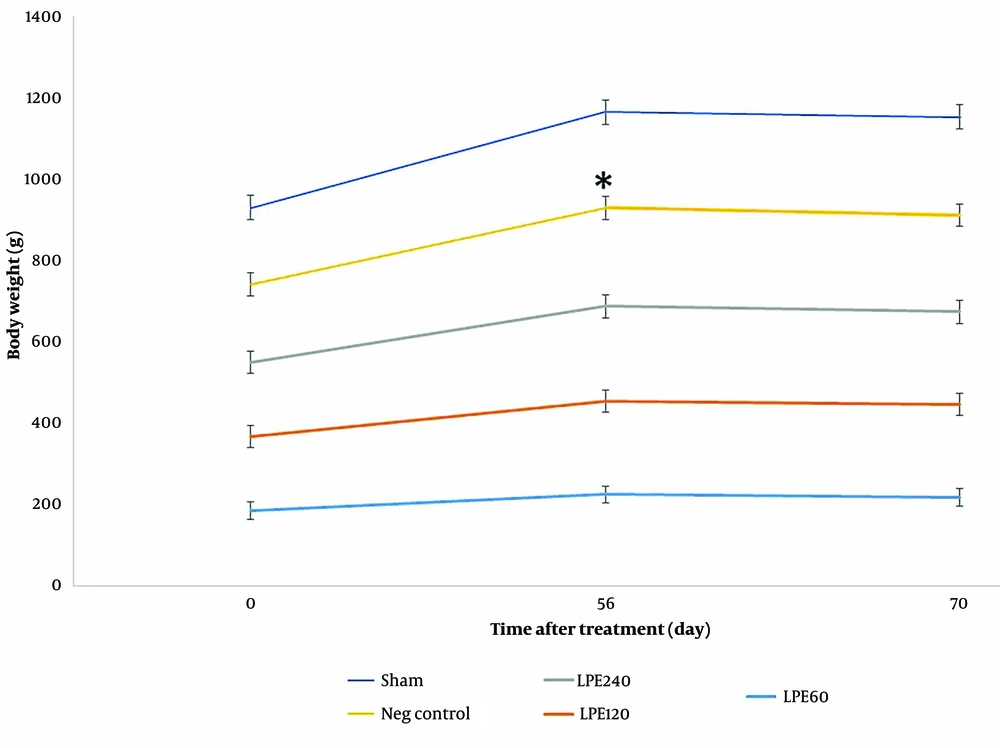
The results for body weight changes in Figure 7 show that before starting LPE treatment, weight gain was observed in all groups over time. After two weeks of treatment with LPE, weight loss was seen in all treated groups (T1, T2, and T3) with a mild decline, while a more significant decrease was observed in the negative control group (P < 0.002).
The Mean weight of animals during treatment. * Significant differences with other groups. Neg control: Hyperlipidemic rat group did not receive treatment. SHAM: Positive control group. T1: The hyperlipidemic rat group was treated with 60mg/mL, LPE (270 mg/kg LPE). T2: The hyperlipidemic rat group was treated with 120 mg/mL, LPE (540 mg/kg LPE). T3: The hyperlipidemic rat group was treated with 240 mg/mL, LPE (1080 mg/kg LPE).
4.8. Liver Histopathology
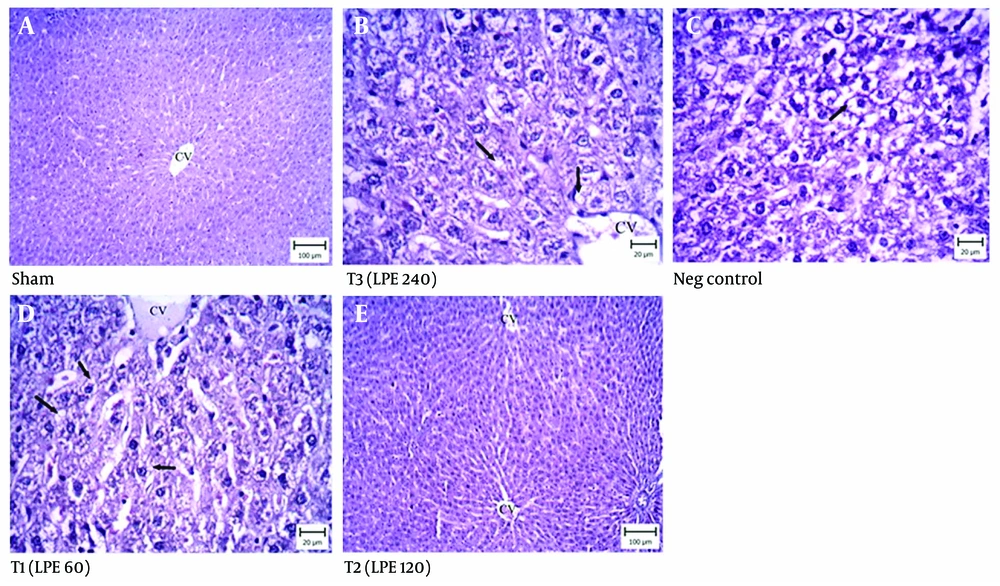
The histopathological results of the negative control group showed acute fatty changes in the hepatocytes around the lobular space (Figure 8A). These damaged hepatocytes contained macrovesicles. In the treated groups (Figure 8B, C, and D), the liver tissues exhibited fewer fatty changes. In the T1 and T2 treated groups, the hepatocytes around the portal space showed lipid deposition in both macro and microvesicles. Compared to the negative control group, the T2 group indicated that most hepatocytes around the central vein were normal. In the T3 group, which received 1080 mg/kg of LPE, fewer hepatocytes were damaged and contained only microvesicles. The sham group had normal hepatocytes in the liver tissue (Figure 8E).
Liver histopathology (Hematoxylin and Eosin staining). Neg control: Hyperlipidemic rat group did not receive treatment. SHAM: Positive control group. T1: The hyperlipidemic rat group was treated with 60 mg/mL, LPE (270 mg/kg LPE). T2: The hyperlipidemic rat group was treated with 120 mg/mL, LPE (540 mg/kg LPE). T3: The hyperlipidemic rat group was treated with 240 mg/mL, LPE (1080 mg/kg LPE).
5. Discussion
Hyperlipidemia is a significant risk factor for cardiovascular disease. A primary factor in the initiation and progression of atherosclerosis is an elevated serum level of cholesterol, including high LDL cholesterol and low HDL cholesterol levels. Various treatments have been attempted to manage cardiovascular lipid-related risks, but these treatments have different limitations, increasing patient complications and prompting a focus on developing new supplementary treatments to minimize these drawbacks (11).
Oxidation processes can be life-threatening. Oxidative stress may cause damage by producing various toxic substances, especially in obese individuals (12). Different studies indicated that aluminum exposure changes malondialdehyde (MDA) and glutathione (GSH) level lead to oxidative injury (13). Other studies have shown that total antioxidant capability (T-AOC), liver glutamic-pyruvic transaminase (GPT), and glutamic oxalacetic transaminase (GOT) levels, along with enzymatic antioxidant activities such as superoxide dismutase (SOD), catalase (CAT), and glutathione peroxidase (GSH-Px), are known as oxidative damage indices (14). Reactive oxygen species (ROS) are the primary reactive oxidative species, and this reactive metabolite causes damage to lipids, proteins, nucleic acids, and carbohydrates in vivo (13). In the lipid peroxidation process, polyunsaturated fatty acids in the cell membrane are initially oxidized by ROS through a free radical chain reaction mechanism. Furthermore, oxidative degradation of fatty acids in the cell membrane leads to cellular dysfunction (15). Malondialdehyde, a secondary product of lipid peroxidation, is a mutagenic and carcinogenic reactive substance that deteriorates human cells (16).
A recent study evaluated the antioxidant effect of Lactobacillus acidophilus in athletes. The results indicated that Lactobacillus acidophilus prevents linoleic acid peroxidation and increases plasma antioxidant levels through its radical-scavenging ability. Different compounds, like exopolysaccharides produced by probiotic bacteria, exhibit antioxidant effects (17). Lactic acid bacteria have antioxidant capacity through various pathways. They affect NF-KB by inhibiting this signaling pathway, downregulating the expression of inflammatory cytokines. Additionally, the production of heat shock proteins 25 and 75 via the mitogen-activated protein kinase (MAPK)-dependent pathway decreases cell disruption caused by H2O2. Modulating ROS-producing enzymes with lactic acid bacteria contributes to their antioxidant effects (18).
The exact mechanism of action of these bacteria is not clearly understood, but it is thought to involve colonization in the intestinal tract, where they change the bacterial microflora through acidification and modulate the gastrointestinal immune system by reducing inflammatory cytokine production and inhibiting the inflammatory cascade (19). Upon entering the intestine, probiotics act as a physical barrier, then interact with toxins as a chemical barrier, and finally, influence immune cells such as monocytes, neutrophils, and macrophages to act as an immune barrier (20). Probiotics decrease the production of pro-inflammatory cytokines like TNF-α and IL-6, thereby reducing inflammation (21). Acetic and propionic acids produced by probiotics are absorbed into the bloodstream, pass into the liver, and enter metabolic pathways. It is postulated that short-chain fatty acids, mainly propionic acid, may improve glucose tolerance and inhibit cholesterol synthesis in the liver (19). Recent studies have indicated that the probiotic L. casei Zhang in high-fat diet-fed rats promotes the β-oxidation of fatty acid metabolism by upregulating gene expression. Furthermore, this probiotic can activate the expression of the glucocorticoid receptor gene, which might be associated with protection against high-fat diet-induced low-grade inflammation (22).
Our results demonstrate that probiotic treatment in hyperlipidemic rats (T1, T2, and T3) with very high concentrations of serum lipids caused a reduction in serum cholesterol levels. Probiotic administration led to a significant decrease in serum triglycerides. Additionally, our data indicated that LPE has a significant effect on reducing serum ALP levels (P < 0.05). Moreover, the histopathological results obtained in vivo revealed the beneficial effect of probiotics on the hepatocytes of the LPE-treated groups (T1, T2, and T3). The most pronounced liver-protective effect in hyperlipidemic treated rats was observed in the T2 group, which received 120 mg/ml LPE (540 mg/kg LPE). These findings demonstrate the dose-dependent effect of probiotics in hyperlipidemia treatment.
In conclusion, our data showed that the administration of probiotics in hyperlipidemic animals has pleiotropic anti-atherosclerotic effects, including reducing serum triglycerides, increasing the antioxidant potential of HDL, and lowering cholesterol levels. Lyophilized probiotic extract exhibited a dose-dependent effect on lipid profile control, with the best response observed at 120 mg/mL LPE (540 mg/kg LPE). Additional support from the histopathology study indicated that LPE has a liver-protective effect, with the best response observed at 120 mg/mL.
The present study supports the beneficial effect of probiotic administration in the treatment of atherosclerosis. However, further studies on animal models and humans are needed to confirm this hypothesis. Additionally, long-term administration of probiotics in human studies should be performed, and toxicity parameters must be evaluated.
