


1. Background
Ocular drug delivery (ODD) presents unique challenges due to the eye's complex anatomy and protective mechanisms. Traditional eye drops often suffer from poor bioavailability and limited retention time on ocular surfaces (1, 2). Nanotechnology-based strategies, particularly liposomes, have shown promise in overcoming these limitations, including poor bioavailability and short retention times (3, 4). Diabetic retinopathy (DR), a common complication of diabetes affecting millions worldwide, often requires invasive treatments with limited efficacy (5, 6). There is growing interest in natural compounds as potential therapeutic agents for this condition (7, 8). Curcumin, derived from turmeric, has shown promising effects in various ocular disorders, including DR (9-12). However, its clinical application is hindered by poor solubility and low bioavailability (11, 12). Liposomal encapsulation of curcumin can overcome these issues by providing targeted delivery to ocular tissues and reducing the frequency of drug administration due to sustained drug release (13, 14). Additionally, ozonated oils (OO) have demonstrated antimicrobial and wound-healing properties, making them promising candidates for ocular applications (15-18). Combining OO with curcumin in a liposomal formulation offers a novel approach that may synergistically enhance therapeutic outcomes in DR and other ocular diseases (17, 18). This study aimed to develop and characterize ozonated liposomes loaded with curcumin, evaluating their physicochemical properties, drug release profile, and stability for potential ODD applications, with a specific focus on DR treatment.
2. Objectives
This paper discusses the development of a double-encapsulated liposome formulation containing ozonated oil and curcumin for topical ocular administration, establishing a foundation for a biocompatible ophthalmic drug system for eye diseases.
3. Methods
3.1. Chemicals
We sourced cholesterol, lecithin, curcumin, methanol, and chloroform from Merck (Germany). All other chemicals used were of analytical grade (19).
3.2. Liposome Preparation
We prepared liposomes using the thin film hydration method as described by Zhang (20). Briefly, phospholipids, lecithin, cholesterol, ozone oil (10% and 20% of total lipids), and curcumin were dissolved in a 2: 1 chloroform: Methanol mixture. The solvent was evaporated using a rotary evaporator at 60°C and 120 rpm to form a thin lipid film, which was then vacuum-dried overnight. The film was hydrated with phosphate buffer solution at 45°C, followed by vortexing and stirring for 20 minutes.
3.3. Physicochemical Characterization
3.3.1. Particle Size and Zeta Potential
Particle size was measured at 25°C using a particle size analyzer. The mean droplet size of the samples was determined with the SCATTER SCOPE 1 QUIDIX (South Korea) based on photon correlation spectroscopy, with a wide measurable size range of 1 - 7000 nm. Surface charge was assessed using the Zeta Analyzer, and the Zeta Potential of samples was determined with a Malvern Zetasizer Nano-range instrument (Malvern Instruments Ltd., Malvern, UK). Each sample was measured in triplicate (19, 21).
3.4. Morphological Analysis
For SEM imaging, the shape and structure of dried liposome samples were examined at 15 kV using a 6300-field emission scanning electron microscope (Hitachi, S-4160) (19).
3.5. Encapsulation Efficiency
For this purpose, liposomal formulations were centrifuged at 12,000 rpm for 30 minutes. We then separated the liposomes from the surface of the solution and centrifuged the aqueous solution containing the unloaded drug once more. This time, we isolated the aqueous solution and the liposomes again for an additional 15 minutes. To calculate the amount of unloaded drug, the underlying liquid was isolated, and the drug quantity was measured. The amount of loaded drug was determined by subtracting the amount of unloaded drug from the total drug used. To confirm the test results, the upper liposomal phase was dissolved in methanol to break the liposomes, allowing the measurement of the loaded drug amount. In this way, both loaded and unloaded drug quantities were calculated, and the percentage of loaded drugs was determined using the following equation (19, 21):
3.6. In Vitro Drug Release Study
We studied drug release using fabricated diffusion cells. The donor compartment contained 2 mL of liposomal suspension, while the acceptor compartment contained artificial tear fluid (pH 7.4). Samples were collected over 24 hours, and curcumin content was analyzed using HPLC with a UV-Vis detector. Various kinetic models were evaluated to determine the best fit for the release profile (21).
3.7. Stability Studies
We evaluated the stability of the liposomal formulations by storing samples at room temperature for three months and monitoring changes in particle size, zeta potential, and encapsulation efficiency (EE) (19, 21).
3.8. Curcumin Quantification
The amount of drug was determined by HPLC using a C18 column at a wavelength of 425 nm (22).
3.9. pH Measurement
The pH of the samples was measured using a Mettler Toledo pH meter (21).
3.10. Statistical Analysis
All experiments were performed in triplicate, and results were expressed as mean ± standard deviation. Statistical analysis was conducted using one-way ANOVA followed by Tukey's post-hoc test, with P < 0.05 considered statistically significant (19).
4. Results and Discussion
4.1. Optimization of Liposomal Formulation
We employed a factorial design to optimize the liposomal formulation, evaluating the effects of curcumin concentration, ozone oil percentage, and sonication time on particle size and EE (Table 1). The optimized formulation (Lip-Cur-Optimum) demonstrated a particle size of 84.77 ± 0.71 nm, a polydispersity index (PDI) of 0.263 ± 0.011, and an EE of 94.73 ± 0.66%. These results are comparable to those reported by Salimi et al. for naringenin-loaded liposomes (19), indicating the potential of this formulation for ocular drug delivery (ODD) (Figure 1).
| Formula | Drug Con(mg/ml) | %OO/LI | Sonicate Time(min) | Factorial State | %EE | PZ | PDI | Zeta P | %D Release 1 | %D Release24 |
|---|---|---|---|---|---|---|---|---|---|---|
| Lip-Cur-1 | 1 | 20 | 10 | +++ | 90.81 ± 0.10 | 130 ± 7.55 | 0.264 ± .012 | -17.57 ± .58 | 34.15 ± .32 | 91.32 ± .32 |
| Lip-Cur-2 | 0.5 | 20 | 10 | -++ | 88.65 ± 0.43 | 156 ± 50 | 0.263 ± .005 | -17.47 ± 3.65 | 30.89 ± .73 | 96.05 ± .61 |
| Lip-Cur-3 | 1 | 20 | 5 | ++- | 96.37 ± 0.26 | 179 ± 7.21 | 0.283 ± .018 | -17.37 ± .93 | 30.14 ± .28 | 96.94 ± .09 |
| Lip-Cur-4 | 0.5 | 20 | 5 | -+- | 92.5 ± 0.37 | 184 ± 30 | 0.273 ± .014 | -17.37 ± .93 | 29.51 ± .58 | 98.49 ± .73 |
| Lip-Cur-5 | 1 | 10 | 10 | +-+ | 94.47 ± 0.18 | 84 ± 30 | 0.267 ± .022 | -16.93 ± 1.1 | 36.45 ± .46 | 79.88 ± .60 |
| Lip-Cur-6 | 0.5 | 10 | 10 | --+ | 89.52 ± 0.19 | 91.33 ± 5.03 | 0.282 ± .016 | -16.47 ± 2.81 | 33.33 ± .24 | 87.25 ± .11 |
| Lip-Cur-7 | 1 | 10 | 5 | +-- | 97.33 ± 0.12 | 126 ± 5.57 | 0.283 ± .022 | -17.77 ± 1.01 | 33.86 ± .46 | 94.65 ± .27 |
| Lip-Cur-8 | 0.5 | 10 | 5 | --- | 95.27 ± 0.10 | 147 ± 7.55 | 0.287 ± .024 | -15.6 ± 2.36 | 32.07 ± .55 | 94.58 ± .73 |
| Lip-Cur-Optimum | 1 | 10 | 9.47 | +-+ | 94.73 ± 0.66 | 84.77 ± 0.71 | 0.263 ± .011 | -16.8 ± 1.32 | 36.91 ± 0.41 | 82.09 ± 0.45 |
Liposome Formulation Components and Characteristics
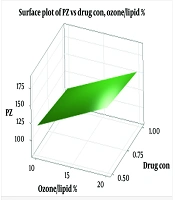
 and % Ozone/lipid on particle size (PZ)")
Response surface 3D plot for the effect of concentration of Curcumin (mg/ mL) and % Ozone/lipid on particle size (PZ)
4.2. Liposome Physicochemical Characterization
4.2.1. Particle Size and Zeta Potential
Liposome sizes ranged from 84 to 184 nm, with the optimized formulation averaging 84.77 nm. Zeta potential values ranged from -15.6 to -17.8 mV, with the optimized formulation at -16.8 ± 1.32 mV, indicating good colloidal stability (As shown in Table 2). These results align with previous studies on liposomal formulations for ocular delivery (12, 23). The size of liposomal particles plays a crucial role in their efficacy and behavior in biological systems (24). Smaller particles provide a larger surface area for adsorption, which may enhance system stability and transparency (25). Changes in particle size can result from aggregation and miscibility phenomena (26). Lecithin serves as the main structural component in liposome formulations, while cholesterol is added to increase stability (27). The addition of cholesterol can influence the binding of hydrophobic molecules within bilayer membranes (28). Previous studies have shown varying effects of cholesterol on liposome particle size, suggesting that the preparation method significantly impacts these results (29, 30). Cholesterol’s role in liposomal formulations depends on its concentration and the lipid composition, which affects bilayer fluidity and drug encapsulation (31). Zeta potential is a critical indicator of colloidal stability (32, 33). Higher absolute zeta potential values indicate stronger electrostatic repulsion between particles, which can significantly enhance the stability of the liposomal suspension and prevent aggregation (34-36). The negative charge observed in our formulations may be attributed to interactions between phosphatidylcholine and cholesterol (37).
| Zeta potential | 1 | 2 | 3 | Mean |
|---|---|---|---|---|
| Lip-Cur-1 | -16.9 | -17.9 | -17.9 | -17.57 ± 0.58 |
| Lip-Cur-2 | -13.3 | -19 | -20.1 | -17.47 ± 3.65 |
| Lip-Cur-3 | -17.8 | -16.3 | -18 | -17.37 ± 0.93 |
| Lip-Cur-4 | -13.2 | -16.5 | -17.3 | -15.67 ± 2.17 |
| Lip-Cur-5 | -15.7 | -17.8 | -17.3 | -16.93 ± 1.1 |
| Lip-Cur-6 | -13.5 | -16.8 | -19.1 | -16.47 ± 2.81 |
| Lip-Cur-7 | -16.6 | -18.3 | -18.4 | -17.77 ± 1.01 |
| Lip-Cur-8 | -12.9 | -16.6 | -17.3 | -15.6 ± 2.36 |
| Lip-Cur-Optimum | -15.3 | -17.8 | -17.3 | -16.8 ± 1.323 |
Zeta Potential of Liposome Formulations and Optimal Formulation
According to regression analysis, increasing the curcumin concentration, ozone-to-lipid ratio, and sonication time enhances the negative charge of the zeta potential (As shown in Figure 2).
 and % Ozone/Lipid on Zeta Potential (Zeta P)")
Response surface 3D plot for the effect of concentration of Curcumin (mg/mL) and % Ozone/Lipid on Zeta Potential (Zeta P)
4.3. Morphological Analysis
SEM imaging of the optimized formulation revealed spherical particles with smooth surfaces, confirming the formation of liposomes (Figure 3) (19). This morphology is consistent with previous studies on liposomal formulations for ocular delivery (30, 32). The particle size dispersion index, reported in Table 1, indicates a typical range for liposomes.

SEM image of optimized liposomal formulation
4.4. Encapsulation Efficiency
Encapsulation efficiency values ranged from 88% to 97%, with the optimized formulation achieving 94.73 ± 0.66%, indicating excellent curcumin loading. According to Figure 4, increasing the percentage of ozone oil to total lipid (% ozone/lipid) shows a decrease in EE%, but increasing the concentration of curcumin shows an increase in EE%. High EE is crucial for the efficacy of liposomal formulations, especially for poorly soluble compounds like curcumin (25). High EE directly impacts drug delivery efficiency and bioavailability in target tissues by improving drug absorption, enhancing stability, optimizing distribution within target tissues, and reducing toxicity and side effects (38).
 and % Ozone/Lipid on Encapsulation efficiency (EE%)")
Response surface 3D plot for the effect of concentration of Curcumin (mg/mL) and % Ozone/Lipid on Encapsulation efficiency (EE%)
4.5. Drug Release Profile
The optimized formulation demonstrated a biphasic release pattern, with an initial burst release followed by sustained release over 24 hours. Cumulative release at 24 hours was 82.09 ± 0.45%. The release kinetics best fit the Peppas model (R² = 0.985), suggesting a complex release mechanism involving both diffusion and erosion (As shown in Table 3 and Table 4 and Figure 5) (39, 40). The Peppas model is commonly used to describe drug release kinetics in polymeric systems, indicating a diffusion-controlled release (38). Drug release from nanoliposomes depends on various factors, including composition, synthesis method, drug type, and environmental conditions (such as temperature and pH) (31). The observed release profile is favorable for ODD, potentially providing an initial therapeutic dose followed by sustained release to maintain drug levels (23).
| Time | Lip-Cur-1 | Lip-Cur-2 | Lip-Cur-3 | Lip-Cur-4 | Lip-Cur-5 | Lip-Cur-6 | Lip-Cur-7 | Lip-Cur-8 | Lip-Cur-Optimum |
|---|---|---|---|---|---|---|---|---|---|
| 0.5 | 29.37 | 24.34 | 23.81 | 22.45 | 30.84 | 28.52 | 27.81 | 25.97 | 31.02 |
| 1 | 34.15 | 30.89 | 30.14 | 29.51 | 36.45 | 33.33 | 33.86 | 32.07 | 36.91 |
| 2 | 42.12 | 40.73 | 39.93 | 40.14 | 42.6 | 41.88 | 42.36 | 40.52 | 43.27 |
| 4 | 50.59 | 52.34 | 53.38 | 52.95 | 49.11 | 53.65 | 51.88 | 50.86 | 49.75 |
| 5 | 58.7 | 58.85 | 59.75 | 60.13 | 54.38 | 61.08 | 58.64 | 60.23 | 55.6 |
| 6 | 65.65 | 66.64 | 66.73 | 67.94 | 61.03 | 67.39 | 64.68 | 69.92 | 61.48 |
| 8 | 74.94 | 77.8 | 76.8 | 79.84 | 66.55 | 74.59 | 72.51 | 79.62 | 66.84 |
| 12 | 83.46 | 87.09 | 90.28 | 90.71 | 74.05 | 81.1 | 82.12 | 86.77 | 74.35 |
| 24 | 91.32 | 96.04 | 96.94 | 98.49 | 79.88 | 87.25 | 94.65 | 94.58 | 82.09 |
Curcumin Release Percentage from Liposomes at Different Times
| Formula | Kinetics | RSQ | Slope | Intercept | MPE% | Release% (Q24) | Release% (Q1) |
|---|---|---|---|---|---|---|---|
| Cu-Li-1 | Pepas | 0.9761 | 0.3225 | -1.0445 | 4.2429 | 91.32 ± 0.32 | 34.15 ± .32 |
| Cu-Li-2 | First | 0.9838 | -0.1285 | -0.2948 | 6.7184 | 96.05 ± 0.61 | 30.89 ± .73 |
| Cu-Li-3 | Pepas | 0.9828 | 0.3958 | -1.1619 | 1.9013 | 96.94 ± 0.09 | 30.14 ± .28 |
| Cu-Li-4 | First | 0.9955 | -0.1709 | -0.1573 | 3.4024 | 98.49 ± 0.73 | 29.51 ± 0.58 |
| Cu-Li-5 | Pepas | 0.980268 | 0.263555 | -1.0097333 | 2.719243 | 79.88 ± 0.60 | 36.45 ± 0.46 |
| Cu-Li-6 | Weibul | 0.978542 | 0.511833 | -0.8530214 | 4.972448 | 87.25 ± 0.11 | 33.33 ± 0.24 |
| Cu-Li-7 | First | 0.995995 | -0.11076 | -0.3293264 | 3.453382 | 94.65 ± 0.27 | 33.86 ± 0.46 |
| Cu-Li-8 | Pepas | 0.971251 | 0.368815 | -1.1085016 | 4.471019 | 94.58 ± 0.73 | 32.07 ± 0.55 |
| Cu-Li-Optimum | Pepas | 0.985441 | 0.265525 | -1.0000166 | 2.432798 | 82.09 ± 0.45 | 36.91 ± 0.41 |
Comparison of Kinetic Models of Formulations

Comparison of cumulative curves of curcumin release from different formulations at different times
4.6. Stability of Optimized Liposomes
Over three months at room temperature, the optimized formulation showed minimal changes in particle size (As shown in Table 5), zeta potential, and EE, indicating good physical and chemical stability. This stability is essential for the potential clinical application of the formulation. Results indicated that liposome cake formation did not occur and there was no change in %EE. Changes in particle size for different formulations over 1 day, and at 1, 2, and 3 months, are shown in Table 5. The change in particle size, zeta potential, and PDI for 8 formulations and the optimized formulation over 3 months is displayed in Figure 6, Table 5, and Table 6. Higher zeta potential values indicate greater electrostatic repulsion between particles, which can significantly enhance the stability of the liposomal suspension and prevent aggregation (19, 21).

Comparison of the bar graph of the change in the particle size of the formulations in 0, 1, 2, and 3 months
| Formula | P(nm) 1st day | P(nm) 1st month | P(nm) 2st month | P(nm) 3st month |
|---|---|---|---|---|
| Lip-Cur-1 | 130 ± 7.55 | 131.33 ± 7.64 | 132 ± 7.21 | 132.67 ± 7.09 |
| Lip-Cur-2 | 156 ± 5.0 | 157.33 ± 5.51 | 158.33 ± 4.51 | 159.33 ± 4.51 |
| Lip-Cur-3 | 179 ± 7.21 | 180 ± 7.21 | 181.33 ± 7.09 | 182.33 ± 6.11 |
| Lip-Cur-4 | 184 ± 3.0 | 184.67 ± 2.52 | 185.67 ± 1.53 | 187.33 ± 2.08 |
| Lip-Cur-5 | 84 ± 2.65 | 84.77 ± 2.31 | 85.33 ± 2.08 | 86.12 ± 1.53 |
| Lip-Cur-6 | 92 ± 6.0 | 93.67 ± 5.51 | 95.33 ± 3.51 | 96.67 ± 2.52 |
| Lip-Cur-7 | 126 ± 5.57 | 126.67 ± 5.13 | 128.33 ± 4.04 | 129.33 ± 4.04 |
| Lip-Cur-8 | 145 ± 7.55 | 145.67 ± 8.08 | 146.67 ± 7.23 | 148.33 ± 6.66 |
| Lip-Cur-Optimum | 84 ± 0.71 | 84.23 ± 1.31 | 84.67 ± 1.08 | 85.07 ± .53 |
Changes in Particle Size of Different Formulations During 1,2 and 3 Months
| Formulations | Condition Time (Months) | Particle Size (nm) | PDI | Zeta Potential |
|---|---|---|---|---|
| Lip-Cur-1 | 3 | 132.67 ± 7.09 | 0.265 ± .017 | -17.59 ± .58 |
| Lip-Cur-2 | 3 | 159.33 ± 4.51 | 0.264 ± .015 | -17.51 ± 2.45 |
| Lip-Cur-3 | 3 | 182.33 ± 6.11 | 0.285 ± .018 | -17.42 ± .43 |
| Lip-Cur-4 | 3 | 187.33 ± 2.08 | 0.276 ± .024 | -17.46 ± .73 |
| Lip-Cur-5 | 3 | 86.12 ± 1.53 | 0.271 ± .022 | -16.96 ± 1.13 |
| Lip-Cur-6 | 3 | 96.67 ± 2.52 | 0.286 ± .024 | -16.49 ± 1.71 |
| Lip-Cur-7 | 3 | 129.33 ± 4.04 | 0.287 ± .042 | -17.81 ± 1.31 |
| Lip-Cur-8 | 3 | 148.33 ± 6.66 | 0.289 ± .034 | -15.63 ± 1.27 |
| Lip-Cur-Optimum | 3 | 85.07 ± .53 | 0.264 ± .023 | (-16.83 ± 1.23 |
Changes in Particle Size, PDI, and Zeta Potential During 3 Months at Room Temperature
4.7. Curcumin Quantification
Curcumin quantification was performed using HPLC with a reverse-phase column and UV detection at a wavelength of 425 nm, as shown in Table 7. Significant differences in curcumin content were observed among different formulations (P < 0.0001).
| FORMULA | Amont of Curcumin in Formula (mg/ml) |
|---|---|
| Lip-Cur-1 | 0.9081 ± 0.010 |
| Lip-Cur-2 | 0.443 ± 0.013 |
| Lip-Cur-3 | 0.964 ± 0.010 |
| Lip-Cur-4 | 0.463 ± 0.011 |
| Lip-Cur-5 | 0.945 ± 0.018 |
| Lip-Cur-6 | 0.448 ± 0.035 |
| Lip-Cur-7 | 0.973 ± 0.006 |
| Lip-Cur-8 | 0.476 ± 0.009 |
| Lip-Cur-Optimum | 0.9473 ± 0.062 |
The Amount of Curcumin in the Formulations
4.8. pH Measurement
The pH of all formulations ranged from 6.41 to 6.64, with the optimized formulation at 6.52 ± 0.017, suitable for ophthalmic application and curcumin stability. This pH range is compatible with the ocular environment (typically 6.5 - 7.5) and is expected to be well tolerated (As shown in Table 8) (21, 24).
| FORMULA | Lip-Cur-1 | Lip-Cur-2 | Lip-Cur-3 | Lip-Cur-4 | Lip-Cur-5 | Lip-Cur-6 | Lip-Cur-7 | Lip-Cur-8 | Lip-Cur-Optimum |
|---|---|---|---|---|---|---|---|---|---|
| PH | 6.64 ± 0.03 | 6.41 ± 0.02 | 6.55 ± 0.026 | 6.46 ± 0.026 | 6.57 ± 0.02 | 6.46 ± 0.08 | 6.54 ± 0.017 | 6.43 ± 0.02 | 6.52 ± 0.017 |
pH Results of the Formulations
4.9. Conclusions
This study successfully developed and characterized an ozonated liposomal formulation loaded with curcumin for ocular drug delivery, specifically targeting DR. The optimized formulation demonstrated favorable physicochemical properties, including a small particle size of 84.77 nm, high EE of 94.73%, and sustained drug release, with 82.09% cumulative release over 24 hours. These characteristics indicate the potential for enhanced curcumin delivery and therapeutic efficacy in ocular applications. Stability studies showed that the formulation remains stable over three months at room temperature, with minimal changes in key parameters. The combination of curcumin's therapeutic benefits with the antimicrobial properties of OO offers a novel approach for ocular drug delivery (ODD), addressing the challenges posed by curcumin's poor solubility and bioavailability. Future research should focus on in vivo evaluations of the formulation's efficacy in treating DR and on assessing its safety profile. Additionally, exploring the potential synergistic effects of curcumin and ozonated oil in treating ocular infections and inflammation could provide new therapeutic options, potentially reducing the need for invasive treatments in ocular disorders.
