1. Background
Cirrhosis, hepatocellular carcinoma (HCC), nonalcoholic steatohepatitis (NASH), and plain fatty liver are all considered forms of nonalcoholic fatty liver disease (NAFLD) (1). The NAFLD is currently the most prevalent chronic liver disease in Western nations, with an occurrence rate of up to 30% (2). Studies on NAFLD identified by sonography indicate that the condition is increasing in Iran (3, 4). According to recent comprehensive research, 33% of the 41,971 Iranian participants had NAFLD overall, with a frequency of 35% in men and 37% in women. The study’s findings suggest that NAFLD is highly prevalent in Iran (4). Obesity, type 2 diabetes, and metabolic syndrome have all been linked to NAFLD (1, 5). Additionally, several studies have shown a connection between the pathophysiology of NAFLD, insulin resistance (IR), and visceral adipose tissue (6, 7).
In recent years, there has been a noticeable correlation between vitamin D and NAFLD. It was found that NAFLD patients had lower blood levels of 25-hydroxyvitamin D3 (25(OH)D3) compared to healthy controls. Researchers also discovered that the degree of liver damage in those with NAFLD was correlated with low levels of 25(OH)D. A recent meta-analysis indicated that vitamin D deficiencies were 26% more prevalent in NAFLD patients compared to healthy individuals (8). Numerous studies have associated vitamin D deficiency with obesity, metabolic syndrome, and IR (9, 10). The relationship between vitamin D deficiency and NAFLD may be mediated by metabolic factors linked to NAFLD, obesity, and metabolic syndrome; however, some research proposes an independent association between vitamin D levels and NAFLD. Recent cross-sectional studies demonstrated a negative correlation between blood 25(OH)D levels and NAFLD, even after controlling for metabolic parameters or metabolic syndrome (11, 12). This correlation persisted even when accounting for abdominal obesity in individuals with diabetes or IR. Furthermore, population-based studies indicated that vitamin D deficiency is more prevalent in women, whereas NAFLD is more frequently observed in men (13, 14).
Vitamin D plays a crucial role in maintaining liver health by regulating lipid metabolism, suppressing pro-inflammatory cytokines (e.g. TNF-α, and IL-6), enhancing anti-inflammatory cytokines (e.g., IL-10), and improving insulin sensitivity. These functions may influence the onset and progression of NAFLD. Vitamin D increases insulin receptor expression and glucose absorption in the liver and peripheral organs. It may regulate lipid metabolism, reduce inflammation, and improve insulin sensitivity to prevent or slow the progression of NAFLD and its development into more severe liver conditions, including NASH and fibrosis (15, 16).
2. Objectives
Given the high incidence of vitamin D deficiency and the widespread occurrence of NAFLD in Iran, along with the scarcity of relevant studies, we aimed to investigate the correlation between vitamin D3 levels and the severity of NAFLD among patients. This study specifically excluded confounding variables, such as individuals with diabetes, dyslipidemia, and smokers, from the outset, while also considering the unique climatic conditions, clothing styles, and dietary habits of the Khuzestan region. We examined the vitamin D levels of individuals with NAFLD and those of healthy individuals as an independent factor.
3. Methods
3.1. Study Design
Following approval by the Ahvaz-Jundishapur University of Medical Sciences Ethics Committee, 200 patients aged 18 years and older with NAFLD who were referred to the Gastroenterology Department of Golestan and Imam Khomeini hospitals in Ahvaz between September 2022 and November 2023 were retrospectively included in the study (IR.AJUMS.HGOLESTAN.REC.1403.016). All study participants provided their informed consent.
3.2. Patient Selection and Data Collection
Abdominal ultrasonography (USG) was used to confirm the hepatic texture in study-eligible NAFLD patients aged 18 to 60. The study included two hundred healthy control subjects with normal liver chemistry and USG. We carefully collected and documented each participant’s sonographic information, test results, and demographic data. Subsequently, the research participants were divided into two groups: The healthy control group and the NAFLD group. The control group consisted of patients aged 18 to 65, all of whom had ultrasound results classified as normal (grade 0). Similar to the patient group, we controlled for confounding factors, ensuring that they experienced the same conditions as the patient group, with the sole exception of the ultrasound. We ensured that they were matched based on pre-existing comorbidities, smoking status, alcohol usage, height, weight, age, gender, alanine transferase (ALT), aspartate transferase (AST), alkaline phosphatase (ALP), and Body Mass Index (BMI).
The study excluded participants with chronic viral hepatitis, celiac disease, autoimmune hepatitis, cholestatic liver diseases, hemochromatosis, bone metabolic disorders, diabetes requiring insulin and/or oral glucose-lowering medications, dyslipidemia, or those who had taken calcium or vitamin D supplements in the two months prior.
We collected the following data for each eligible patient: Body Mass Index, gender, age, smoking status, residency, AST, ALT, ALP, fasting blood glucose (FBG), cholesterol, and triglycerides (TG). We also measured the serum 25(OH)D levels in each group. Vitamin D deficiency is indicated by low blood levels of 25(OH)D. Levels below 20 ng/mL, between 20 and 30 ng/mL, and between 30 and 100 ng/mL indicate vitamin D deficiency, insufficiency, and sufficiency, respectively (17, 18).
3.3. Assessment Procedures
We collected blood samples from each patient and allowed them to stand for 30 minutes to encourage spontaneous coagulation. Before analysis, the samples were centrifuged for five minutes at 3000 rpm and stored at 2 to 8°C for a maximum of five days. The specimens were stored for up to two months after being frozen once at -20°C before the test.
3.4. Vitamin D Measurement
The blood 25(OH)D level was measured by the Immunology Research Lab at the Immunology Department of Ahvaz Jundishapur University of Medical Sciences hospitals using a 25-HYDROXYVITAMIN D [25(OH)D] ELISA (enzyme-linked immunosorbent assay) kit (CAN-VD-510) (19). Competitive ELISA compares the sample’s 25(OH)D to a labeled form for binding to an antibody. The concentration of the target analyte in the sample is inversely related to its tagged concentration. Wells on a coated microtiter plate contain anti-25(OH)D antibodies. Standard curves are created using known 25(OH)D concentrations to assess performance; samples with known values are beneficial. The biotin-labeled 25(OH)D reagent competes with the sample’s 25(OH)D for binding to the antibody. Streptavidin-based horseradish peroxidase (HRP) conjugates with the biotinylated 25(OH)D. The normal substrate solution tetramethylbenzidine (TMB) interacts with HRP to produce a color change. Sulfuric or phosphoric acid is used to inhibit enzymatic activity.
3.5. Detailed Protocol of Competitive ELISA
We diluted the concentrated solution to prepare the wash buffer and diluted the biotinylated 25(OH)D reagent using the supplied diluent. Then, we pipetted 25 µL of standards, controls, and samples into designated wells and added 100 µL of diluted biotinylated 25(OH)D reagent to each well. We allowed the dish to sit at room temperature with a cover for two hours. Each well was washed with 300 µL of wash buffer three times, and the buffer was removed by lightly tapping the plate with absorbent paper after the final wash. We then placed 100 µL of streptavidin-HRP conjugate in each well and repeated the washing process. Subsequently, we added 100 µL of TMB substrate solution to each well and incubated it in the dark at ambient temperature for 10 - 15 minutes. The color development, indicated by a blue tinge, was observed. We added 50 µL of stop solution to each well, which changed the color from blue to yellow. To measure absorbance at 450 nm, 30 minutes after applying the stop solution, we used a microplate reader (5). We plotted the mean absorbance of each standard concentration on the y-axis against the corresponding 25(OH)D concentration on the x-axis to construct a standard curve. Interpolating absorbance values from the standard curve provided the sample 25(OH)D concentrations. In this competitive test, greater sample absorbance indicated lower 25(OH)D concentrations (20).
Every additional laboratory test, including coagulation tests and assessments of kidney and liver function, was performed according to standard protocols.
3.6. Hepatic Ultrasonography
To assess the size, cirrhotic changes, echogenicity, and other abnormalities, we performed liver USG (UK). Hepatic USG was used to evaluate the degree of steatosis (21, 22). We assessed fatty liver (23) using USG as described below:
(A) grade 0: Normal liver echogenicity.
(B) grade I: Diffusely increased hepatic echogenicity, but diaphragmatic and periportal echogenicity may still be visible.
(C) grade II: Diffusely increased hepatic echogenicity masks periportal echogenicity, but diaphragmatic echogenicity is still detectable.
(D) grade III: Diffusely increased hepatic echogenicity obscures both diaphragmatic and periportal echogenicity.
3.7. Detailed Protocol of Hepatic Ultrasonography
Hepatic USG is a simple, affordable, radiation-free, and safe method for identifying liver fatty infiltration. A convex transducer operating at 2 - 5 MHz may be used for the examination. The liver parenchyma’s homogeneous echotexture and echogenicity are comparable to or slightly higher than those of the spleen and renal cortex. Due to fatty infiltration, the liver exhibits stronger echogenicity than the spleen and renal cortex. A visual study of the echogenicity’s intensity has led to the proposal of several (0 - 3) classes of steatosis, assuming that the gain setting is optimal. Grade I fatty infiltration is identified when the echogenicity is simply elevated; grade II occurs when the echogenic liver obscures the echogenic walls of portal vein branches; and grade III occurs when the echogenic liver obscures the diaphragmatic outline. However, there is inter-observer variability in these assessments. The USG has a sensitivity of 60% to 94% and a specificity of 84% to 95% in identifying hepatic steatosis. With a cut-off of 1.49, the Hepatorenal Sonographic Index — the ratio of the liver’s mean brightness level to that of the right kidney — has also been suggested as a measure of hepatic steatosis. It has a very high sensitivity (100%) and specificity (91%) for diagnosing steatosis greater than 5% (23).
3.8. Statistical Analysis
The mean and standard deviation (SD) were used to present numerical data, while frequency and percentage were used to display categorical variables. A parametric independent t-test was employed when the distribution followed a Gaussian pattern. Conversely, a Mann-Whitney U test was used for inference and comparative analysis if the distribution was non-Gaussian. The chi-square test or, where applicable, Fisher’s exact test was used for categorical variables. For all statistical tests, a P-value of less than 0.05 was considered significant. The Spearman’s rank correlation coefficient was calculated for various study parameters and 25(OH)D levels. The statistical program SPSS version 22 was used to conduct the research. Either logistic regression or univariate logistic regression analyses were utilized in the study. We used the receiver operating characteristic (ROC) curve assessment to identify the predictive parameters associated with the presence of NAFLD and to evaluate whether the cutoff values for 25(OH)D levels provided the best specificity and sensitivity in identifying individuals with NAFLD.
4. Results
Of the 400 individuals in this study, 200 were diagnosed with NAFLD, while the other 200 served as healthy controls. Table 1 presents the baseline and demographic information for each group. Except for hypertension (17.5% vs. 10%, P < 0.05) and BMI (29.22 ± 4.58 compared to 25.6 ± 3.37 kg/m2, P < 0.001), which were both significantly higher in the NAFLD group, other demographic data were similar between the two groups. There was no discernible difference in the gender distribution between the healthy and affected individuals.
| Variables | Control Group | NAFLD Group | P-Value |
|---|---|---|---|
| Gender | 0.22 | ||
| Male | 77 (46.4) | 89 (53.6) | |
| Female | 123 (52.6) | 111 (47.4) | |
| BMI (kg/m2) | 25.60 ± 3.37 | 29.22 ± 4.58 | < 0.001 |
| HTN | 20 (10) | 35 (17.5) | < 0.05 |
| Underlying diseases | 0.68 | ||
| GERD | 4 (2) | 2 (1) | |
| Hypothyroidism | 6 (3) | 11 (5.5) | |
| Anemia | 7 (3.5) | 5 (2.5) | |
| Goiter | 1 (0.5) | 0 | |
| Renal stone | 2 (1) | 1 (0.5) | |
| IBS | 2 (1) | 2 (1) | |
| Cholecystectomy | 0 | 1 (0.5) |
Baseline Characteristics of the Study Groups a
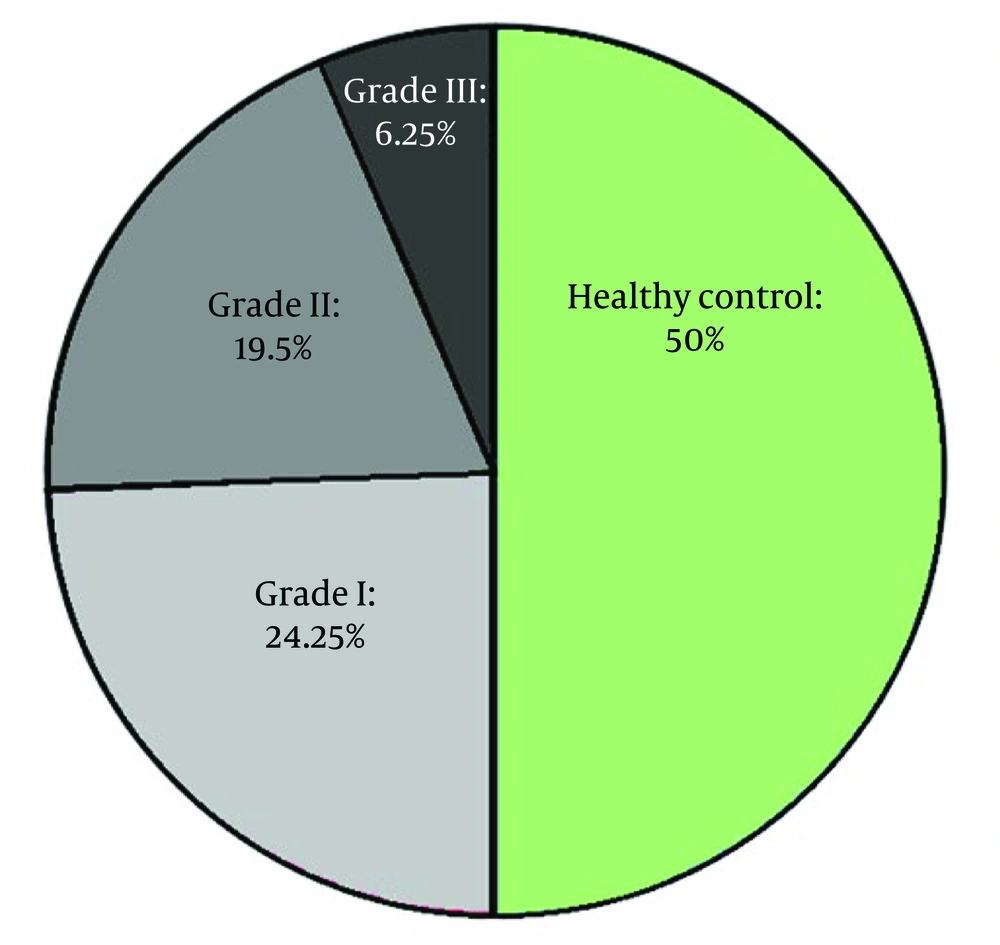
Figure 1 illustrates the frequency ratio of healthy controls across various NAFLD levels.
Table 2 presents the results of all laboratory data for the two groups. Serum 25(OH)D levels were significantly lower in the NAFLD group (24.95 ± 9.16 ng/mL) compared to the normal control group (31.28 ± 12.52 ng/mL), with P < 0.001. The NAFLD group exhibited significantly higher levels of ALT (U/L, P < 0.001), AST (U/L, P < 0.01), TG (mg/dL, P < 0.001), and cholesterol (mg/dL, P < 0.001) compared to the normal control group.
| Variables | Control Group | NAFLD Group | P-Value |
|---|---|---|---|
| Serum 25 (OH)D (ng/mL) | 31. 28 ± 12.52 | 24.95 ± 9.16 | < 0.001 |
| ALT (U/L) | 22.35 ± 9.58 | 64.40 ± 25.48 | < 0.001 |
| AST (U/L) | 21.44 ± 34.80 | 39.12 ± 7.26 | < 0.01 |
| TG (mg/dL) | 105.19 ± 28.07 | 120.37 ± 23.96 | < 0.001 |
| Cholesterol (mg/dL) | 152.96 ± 30.99 | 165.67 ± 26.17 | < 0.001 |
| FBS (mg/dL) | 88.06 ± 7.77 | 89.85 ± 8.20 | 0.15 |
Laboratory Variables of the Study Groups a
The relationship between laboratory markers and fatty liver grades in individuals with fatty liver disease was evaluated, and Table 3 displays the findings. The BMIs of individuals in grades I, II, and III differed substantially. The levels of vitamin D in grades I, II, and III varied significantly. The TG levels in grades I, II, and III varied significantly, with grade 3 exhibiting higher values than grades I and II. Significant variations in cholesterol levels were observed between grades I, II, and III, with grade III exhibiting higher values than grades I and II.
| Variables | Grade I | Grade II | Grade III | P-Value |
|---|---|---|---|---|
| Age (y) | 43.12 ± 10.58 | 44.17 ± 10.03 | 44 ± 8.49 | 0.78 |
| BMI (kg/m2) | 28.13 ± 5.50 | 29.80 ± 2.78 | 31.58 ± 4.05 | 0.001 |
| Serum 25 (OH)D (ng/mL) | 27.33 ± 10.20 | 22.68 ± 6.98 | 19.93 ± 7.60 | < 0.001 |
| ALT (U/L) | 36.46 ± 22.55 | 46.14 ± 27.47 | 47.44 ± 25.08 | < 0.01 |
| AST (U/L) | 18.04 ± 31.07 | 48.91 ± 12.57 | 39.84 ± 12.57 | 0.33 |
Parametric Variables of the Different Nonalcoholic Fatty Liver Disease Grades a
Table 4 illustrates a significant relationship between BMI and the various stages of fatty liver. The analysis revealed no significant differences in gender between patients with varying degrees of fatty liver and healthy individuals. Notable variations in vitamin D levels were observed among patients classified in grades I, II, and III compared to healthy individuals.
| Variables | Control (n = 200) | NAFLD Group | P-Value | ||
|---|---|---|---|---|---|
| Grade I (n = 97) | Grade II (n = 78) | Grade III (n = 25) | |||
| Gender | 0.68 | ||||
| Male | 77 (46.4) | 41 (42.3) | 35 (44.9) | 13 (52) | |
| Female | 123 (52.6) | 56 (57.7) | 43 (55.1) | 12 (48) | |
| BMI | < 0.001 | ||||
| < 25 | 76 (82.6) | 12 (13) | 2 (2.2) | 2 (2.2) | |
| 25 < BMI < 30 | 110 (47.8) | 65 (28.3) | 48 (20.9) | 7 (3) | |
| > 30 | 14 (17.9) | 20 (25.6) | 28 (35.9) | 16 (20.5) | |
| Serum 25 (OH)D | < 0.001 | ||||
| Deficient | 40 (20) | 28 (28.9) | 32 (41) | 12 (48) | |
| Insufficient | 71 (35.5) | 43 (44.3) | 40 (51.3) | 11 (44) | |
| Sufficient | 89 (44.5) | 26 (26.8) | 6 (7.7) | 2 (8) | |
Non-parametric Variables of the Control and Different Nonalcoholic Fatty Liver Disease Groups a
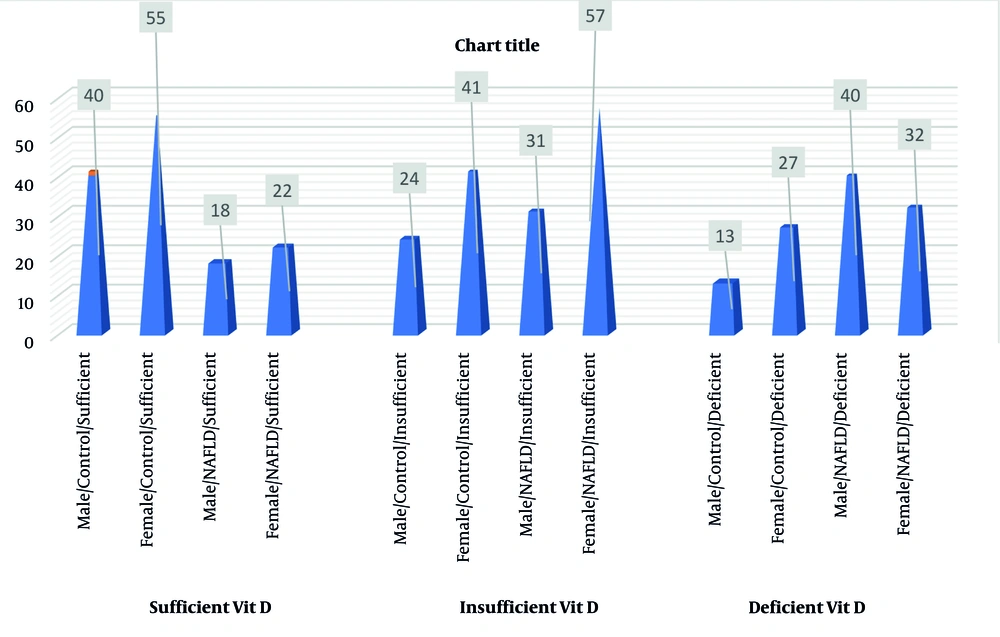
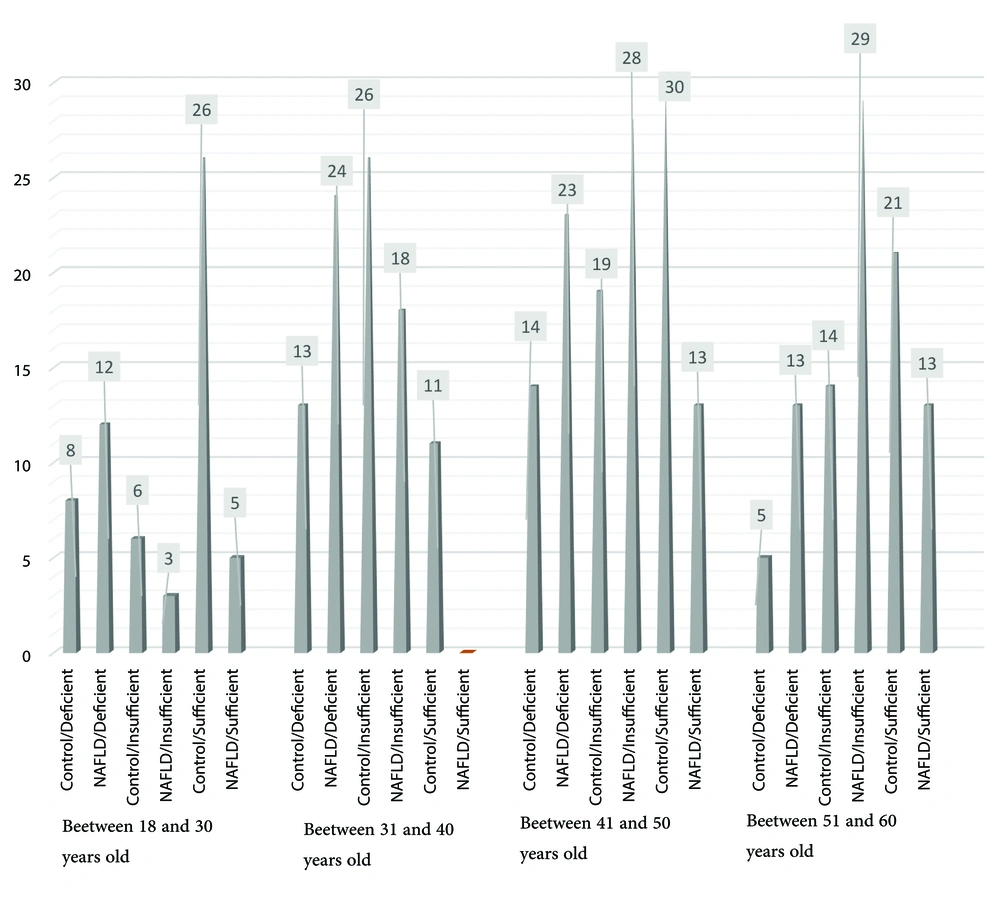
Results demonstrate a significant correlation between the gender of NAFLD patients and varying levels of vitamin D when compared to healthy individuals. The study shows a significant relationship between the age of healthy individuals and varying levels of vitamin D in contrast to patients with NAFLD (Table 5, Figures 2 and 3).
| Variables | Deficient | Insufficient | Sufficient | P-Value |
|---|---|---|---|---|
| Gender | ||||
| Control (n = 200) | 0.54 | |||
| Male | 13 (16.9) | 24 (31.2) | 40 (51.9) | |
| Female | 27 (22) | 41 (33.3) | 55 (44.7) | |
| NAFLD (n = 200) | < 0.05 | |||
| Male | 40 (44.9) | 31 (34.8) | 18 (20.2) | |
| Female | 32 (28.8) | 57 (51.4) | 22 (19.8) | |
| Age (y) | ||||
| Control (n = 200) | < 0.05 | |||
| 18 - 30 | 8 (20) | 6 (15) | 26 (65) | |
| 31 - 40 | 13 (22.8) | 26 (45.6) | 18 (31.6) | |
| 41 - 50 | 14 (22.2) | 19 (30.2) | 30 (47.6) | |
| 50 ≤ | 5 (12.5) | 14 (35) | 21 (52.5) | |
| NAFLD (n = 200) | 0.07 | |||
| 18 - 30 | 12 (60) | 3 (15) | 5 (25) | |
| 31 - 40 | 24 (38.1) | 28 (44.4) | 11 (17.5) | |
| 41 - 50 | 23 (37.1) | 28 (45.2) | 13 (23.6) | |
| 50 ≤ | 13 (23.6) | 29 (52.7) | 13 (23.6) |
Serum 25(OH)D Levels Were Categorized by Gender and Age in Both Control and Patient Groups a
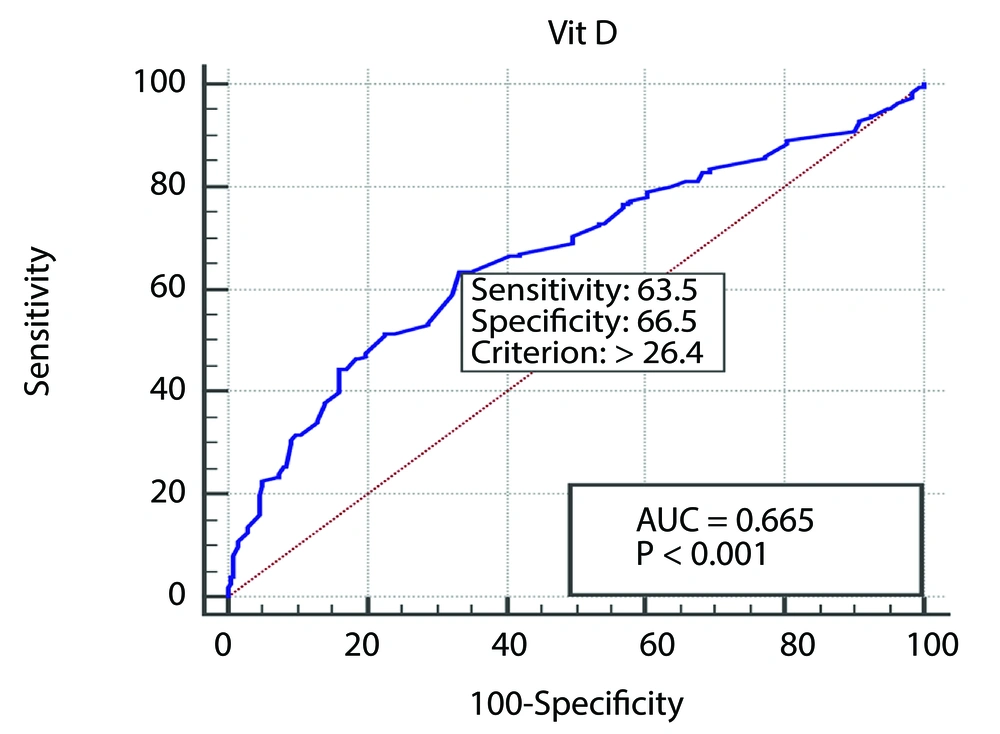
An ROC curve was generated to evaluate the balance between specificity and sensitivity concerning the association between vitamin D levels in NAFLD patients and healthy individuals. The threshold was established at 26.4 (AUC = 0.66, P < 0.001), demonstrating a sensitivity of 63.5% and a specificity of 66.5% (Figure 4).
5. Discussion
According to this research, vitamin D insufficiency may be a standalone risk factor for NAFLD in the Khuzestan region of Iran. When metabolic parameters are considered, previous international research has shown a negative correlation between vitamin D levels and NAFLD. However, these studies only examined visceral fat or metabolic syndrome, or they involved small sample sizes. This study demonstrated that, even after adjusting for metabolic syndrome, abdominal obesity, and other confounding variables, there was a correlation between vitamin D deficiency and NAFLD in a sizable sample from Khuzestan, Iran. According to this research, vitamin D insufficiency alone may be a risk factor for NAFLD. This research is the first case-control analysis examining the influence of age and sex on the relationship between vitamin D insufficiency and NAFLD using a large scale of healthy individuals. Earlier research did not examine individuals according to both age and sex. However, a few previous studies reported that postmenopausal women or males might have a favorable correlation between vitamin D deficiency and NAFLD (24-26).
The NAFLD is the most common cause of chronic liver disease globally. A comprehensive analysis calculated the worldwide prevalence of NAFLD among adults to be around 32%, with higher rates observed in men (40%) than in women (26%). Notably, the frequency has changed over time; it started at 26% in research conducted in 2005 or earlier and rose to 38% in studies conducted from 2016 onward (27). According to reports from the United States, the prevalence of NAFLD there is 38%, representing a 50% increase over the past three decades (28).
Vitamin D deficiency is a common problem and a major risk factor for NAFLD. A comprehensive meta-analysis conducted between 2000 and 2022 projected that 15.7% of global serum 25-hydroxyvitamin D [25(OH)D] values were below 30 nmol/L. This deficiency is influenced by region, latitude, age, gender, and socioeconomic level (28). Individuals living farther from the equator tend to have more vitamin D insufficiency. For instance, serum 25(OH)D levels below 30 nmol/L were found in 14.9% of individuals residing at 40 - 60 degrees north latitude, and this incidence rose to 57.4% among those living at 60 - 80 degrees north latitude (29). Lower-middle-income nations showed a higher prevalence of vitamin D insufficiency (26.7%) compared to upper-middle-income (10.2%) and high-income countries (15.1%), indicating that socioeconomic factors also play a role. Age and gender disparities are evident; individuals under 18 years old had a higher frequency of blood 25(OH)D levels below 50 nmol/L (48.5%), and vitamin D insufficiency was more prevalent in women (17.8%) than in men (13.6%) (29).
Furthermore, recent studies have highlighted that many individuals with type 2 diabetes lack essential micronutrients like vitamin D. Type 2 diabetes increases the risk of developing severe liver diseases, including fibrosis, liver transplant, and death (30, 31). According to the results, the NAFLD group’s serum 25(OH)D levels were significantly lower than those of the healthy controls. Just under one-fifth of the control group exhibited vitamin D insufficiency compared to almost two-thirds of NAFLD patients. The current systematic review by Pacifico et al. (32) includes previous studies that examined the connection between vitamin D levels and NAFLD/NASH. Sixteen of the studies did not find a negative correlation between vitamin D levels and NAFLD, whereas twenty-nine did. According to a prior meta-analysis investigating the association between NAFLD histologic severity and serum vitamin D levels, there was no correlation between blood vitamin D levels and disease severity as assessed by the NAFLD activity score (NAS) and fibrosis scores in NAFLD patients (33).
Liangpunsakul and Chalasani screened 6,800 patients using the NHANES III database. They compared the blood vitamin D levels of 979 matched controls and 308 patients with an unexplained ALT rise. Vitamin D concentrations were lower in individuals with higher ALT levels compared to the control group, even after accounting for serum triglyceride levels and metabolic syndrome (34). Targher et al. verified the link between vitamin D insufficiency and nonalcoholic fatty liver disease. Additionally, it was shown that those with NASH had lower vitamin D levels than people with isolated fatty liver (35).
The normal control group's mean serum 25(OH)D level was 31.28 ± 12.52 ng/mL, while the NAFLD group’s was 24.95 ± 9.16 ng/mL. In their cross-sectional investigation, Ehrampoush et al. (36) found that the mean blood vitamin D level in the NAFLD group was 15.84 ± 5.50 ng/mL, while the mean in the healthy group was 26.77 ± 8.26 ng/mL. The results of the systematic review (32) showed that the median vitamin D level in the control group was 27.7 ± 8.75 ng/mL, but the mean level in the NAFLD group was 25.7 ± 8.74 ng/mL.
The study’s ROC curve analysis indicates that NAFLD is indicated by a blood 25(OH)D level of less than 26.4 ng/mL. In NAFLD patients, vitamin D deficiency was observed in 28.8% of female patients and 44.9% of male patients. According to our findings, males are more likely than females to have a serum 25(OH)D deficiency, which increases the risk of NAFLD.
Our findings indicate that individuals with NAFLD exhibited elevated liver enzyme levels beyond the normal range. The previous meta-analysis could not confirm this finding by calculating the percentage of those with NAFLD who had standard ALT levels within the entire NAFLD group (37). In certain epidemiological investigations, low blood vitamin D levels have been associated with NAFLD, particularly in the presence of obesity (high BMI) (38, 39). Vitamin D, a fat-soluble vitamin that accumulates in adipose tissue, is more sequestered in obese individuals who are also at risk for nonalcoholic fatty liver disease (40). The study found a robust association between high BMI and an elevated risk of NAFLD in people with different stages of the disease.
The main limitation of this research is the small sample size, which could limit the applicability of the results. Our study included a wide range of patients across multiple age groups, but the analysis of 25(OH)D levels revealed no significant differences among the various age categories of NAFLD patients, even though Manco et al. (41) found that low levels of 25(OH)D in children with NAFLD were associated with histological severity, independent of metabolic traits. The fact that NAFLD was detected by sonography rather than biopsy or elastography is one of the study’s other weaknesses. Because of this, we were unable to distinguish between basic steatosis and NASH, which have distinct consequences. An invasive procedure during a thorough epidemiological evaluation is inappropriate. Second, the case-control design of this study leaves open the question of whether vitamin D insufficiency and NAFLD are causally related. The study participants were enrolled in a health screening program at a university hospital, which limits the generalizability of the findings.
Our research indicates a notable connection between vitamin D levels and the risk of NAFLD. We discovered that men had a significantly higher serum 25(OH)D level deficit than women, which might increase the risk of NAFLD. Maintaining a healthy blood level of vitamin D is necessary to avoid NAFLD. If inadequate vitamin D is shown to be the main cause of NAFLD, further research might have significant therapeutic implications. It is also recommended that future studies examine vitamin D levels across various liver conditions. The relationship between vitamin D deficiency and the outcome of liver diseases, namely the onset of HCC and its progression to NASH, requires prospective research.
This research is the first investigation to clarify the age-and-sex-related correlation between vitamin D insufficiency and NAFLD while accounting for metabolic syndrome, visceral fat, and other confounding variables. Additional prospective studies are necessary to establish a causal relationship between vitamin D levels and NAFLD. Well-designed randomized clinical studies may reveal if vitamin D supplementation might enhance the outcomes of NAFLD.
