


1. Background
Dietary carbohydrates vary in structure, size, and fiber, affecting glucose and insulin responses. The Glycemic Index (GI) indicates the speed of blood glucose changes, classifying carbs as low (≤ 55), medium (55 - 69), or high (≥ 70) (1, 2). Glycemic load (GL) evaluates both quantity and quality of carbohydrates, with categories of low (< 10), medium (11 - 19), and high (≤ 20) (1). High postprandial glucose levels, along with GI and GL, are associated with chronic diseases like diabetes, heart disease, and obesity (1, 2). Foods with low GI and GL lead to smaller blood glucose spikes, reducing risks of obesity, oxidative stress, diabetes, and heart disease (3). Thus, research focuses on creating low GI and GL foods to minimize postprandial glucose.
The Satiety Index (SI) assesses postprandial fullness; a higher SI indicates less hunger and reduced food intake. For overweight individuals, choosing high-SI foods is essential (2). Legumes, which have a low GI and GL, help stabilize blood glucose levels and lower cardiovascular disease risk (4). Adding legumes to high-GI foods can lower blood glucose levels. Soybean (glycine max) is a low-GI food rich in complex carbohydrates, protein, dietary fiber, and beneficial compounds like isoflavones and phytosterols. It dietary fiber supports a low GI and may lower diabetes risk, while soy-based diets enhance glucose tolerance and insulin sensitivity. Whole soy flour can also boost the fiber and protein content of wheat bread, increasing satiety (5).
White bread is a globally consumed staple, including in Iran, emphasizing the need to improve its nutritional value. The WHO reports that the average daily bread intake is about 250 grams, while in Iran, the estimated daily consumption rate is about 320 g (6). However, due to its high GI, diabetic patients often limit their consumption, as it provides low satiety (7). Researchers are exploring methods to reduce bread's GI and enhance satiety by incorporating ingredients such as fiber, oleaster fruit powder, date seed flour, legume flours (e.g., peas and beans) (6, 8), and various cereal flours (e.g., wheat bran, barley, and oak) (9, 10).
2. Objectives
This study examined the effects of roasted soybean flour (at 25% and 50% levels) on blood glucose, GI, GL, and SI in white bread.
3. Methods
This randomized crossover study was conducted at Ahvaz Jundishapur University’s Department of Nutrition. Participants aged 20 to 40 with a normal BMI, fasting blood glucose below 100 mg/dL, no metabolic disorders, and no soy allergies were recruited with written consent. The study is approved by the university’s research ethics committee (IR.AJUMS.REC.1397.477) and registered in a clinical trial registry (IRCT20181017041366N1). Exclusion criteria included smoking, pregnancy, digestive disorders, and medications affecting glucose metabolism. Soybeans were sourced from Ahvaz's market and verified at the Jundishapur University herbarium (FP 201100101 A). Soybean flour was prepared by grinding roasted soybeans and mixing them with white wheat flour at a 25% to 50% ratio.
3.1. Test Meals
To make the bread, selected flours were blended with water, improver, salt, and yeast. The dough was proofed at room temperature for 60 minutes before baking in a bakery oven at 250°C for 10 minutes. After cooling for 2 hours, the bread was packed in polyethylene bags and stored in the freezer for testing. The compositions of the bread samples are detailed in Table 1.
a Amount of breads contains 50 g of available carbohydrates for Glycemic Index test.
b Amount of breads contains 240 kcal energy for SI test.
To assess the GI, participants consumed bread containing 50 grams of carbohydrates (7), while the SI was evaluated with bread providing 1000 kJ (240 kcal) in a random order (11).
3.2. Glycemic Index
Based on the GI determination method (7), 10 healthy individuals (all female) with an average age of 30.8 years (SD ± 2), a body mass index of 21.71 kg/m² (SD ± 0.7), and a fasting blood glucose level of 86.8 mg/dL (SD ± 1) were included. Participants were advised to avoid vigorous physical activity on the evening before and the test day, while consuming a standardized dinner each night before testing. Each participant was tested on four separate days, one week apart.
On each test day, a fasting blood sample was collected from the fingertip after a 10 - 12 hour fast using an Accu-Chek® glucometer. Participants were randomly assigned to consume either 50 grams of glucose in 200 mL of water, white wheat flour bread, or two types of bread made from a blend of white wheat and soybean flour (in 50/50 and 75/25 ratios, if available). They were instructed to eat the food within 10 to 15 minutes, after which blood glucose levels were measured at 15, 30, 45, 60, 90, and 120 minutes. Subjects were prohibited from eating or drinking for two hours.
The four substances (glucose and the three breads) were randomly assigned across the four testing days, and the incremental area under the curve (IAUC) was calculated using a trapezoidal formula (12). The GI and GL of the tested breads were calculated using the following formulas (13): GI = (IAUC test bread / IAUC reference food) × 100 and GL = GI × Available Carbs (g)/100.
Glucometer calibration involved measuring glucose levels in 90 serum samples with an automatic analyzer (BT3000, Biotecnica, Italy), resulting in a strong correlation (r = 0.976, P < 0.0001).
3.3. Satiety Index
The study involved 23 healthy females, with an average age of 28.5 years and a BMI of 22.5 kg/m2, using the SI determination method (11). Participants abstained from vigorous activity and had identical dinners prior to testing. Over four one-week sessions, they fasted for 10 - 12 hours. Upon arrival, fasting blood glucose was measured, and height and weight were recorded. They completed questionnaires on personal characteristics and physical activity. Satiety was assessed with a 100-mm Visual Analog Scale (VAS). Each day, participants randomly received one of three types of bread (white, 25% soybean flour, or 50% soybean flour) with 220 mL of water. Satiety ratings were recorded at intervals up to 120 minutes after eating, with a final questionnaire at that time. Participants were spaced two meters apart to prevent discussion of the study or food consumption. The area under the satiety curve, representing the SI, was calculated using the trapezoidal formula: SI = (IAUC of test bread/IAUC of white bread) × 100 (12).
3.4. Sensory Evaluation
Breads were evaluated using a 7-point hedonic scale, with -3 representing very bad taste and +3 indicating very delicious.
3.5. Statistical Analyses
Statistical analysis was performed using SPSS version 24. Changes in blood glucose, satiety, and area under the curve were analyzed with repeated measures ANOVA, while Friedman's test was used to assess taste. A P-value of less than 0.05 was deemed significant. Bivariate correlations were employed to determine the correlation coefficient between the glucometer and the analyzer.
4. Results
4.1. Glycemic Index
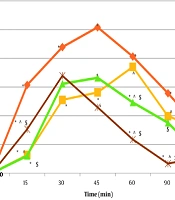
All 10 participants completed the study. Figure 1 illustrates blood glucose changes after consuming glucose, white bread, bread with 25% soybean flour, and bread with 50% soybean flour. The 50% soybean flour bread resulted in the lowest blood glucose area, significantly different from white bread (P = 0.002). No significant differences were observed between white and 25% soybean flour breads (P = 0.2), or between 25% and 50% soybean flour breads (P = 0.1).
Table 2 presents the GI and GL of the breads. The GI ranged from 68.33 for white bread (medium) to 43.35 for 50% soybean flour bread (low), with significant differences between white bread and the soy flour breads (P = 0.018 for 25%, P = 0.004 for 50%). No significant differences existed between white and 25% soybean flour breads (P = 0.2) or between the two soy flour breads (P = 0.1).
.")
The Mean blood glucose changes after consuming glucose, white bread, and breads with 25% and 50% soy flour. * Statistically significant differences were found between glucose and the other breads at the specified times. ^ There were significant differences between white wheat flour bread and those containing 25% and 50% soy flour at the indicated times. $ Significant differences were observed between the 25% and 50% soy flour breads at the specified time (P < 0.05).
| Parameters | Glucose | White Bread | Bread with 25% Soy | Bread with 50% Soy |
|---|---|---|---|---|
| IAUC | 3883.59 ± 331.75 A | 2563.39 ± 263.11 B | 2219.74 ± 323.24 BC | 1653.62 ± 237.88 C |
| GI | - | 68.33 ± 7.31 A | 58.51 ± 7.13 AB | 43.35 ± 6.45 B |
| GL | - | 12.06 ± 1.29 A | 8.79 ± 1.07 B | 4.23 ± 0.63 C |
Abbreviations: IAUC, incremental area under the curve; GI, Glycemic Index; GL, glycemic load.
a Values are expressed as mean ± SEM.
b Different capital letters signify significant differences between glucose and test bread types (P < 0.001).
White bread had a higher GL (12.06, medium) than both 25% soybean flour (8.79, low) and 50% soybean flour (4.23, low) bread, with significant differences among all breads (P < 0.001), particularly between white and the soy flour breads (P = 0.03 for 25%, P < 0.001 for 50%) and between the soy flour breads (P = 0.004).
4.2. Satiety Index
All 23 participants completed the study. Table 3 and Figure 2 present average satiety changes for white bread, 25% soybean flour bread, and 50% soybean flour bread, with significant differences noted (P < 0.001). White bread differed significantly from the others at all time points except time zero (P < 0.05). Table 3 shows the mean ± SE (SI ± standard error) for the three breads, using white bread as a reference.
| Parameters | White Bread | Bread with 25% Soy | Bread with 50% Soy | P-Value c |
|---|---|---|---|---|
| IAUC | 290.84 ± 44.37 A | 430.41 ± 48.05 B | 483.41 ± 43.83 B | 0.001 |
| SI | 100 A | 268.67 ± 68.80 B | 326.36 ± 81.28 C | 0.001 |
Abbreviations: IAUC, incremental area under the curve; SI, Satiety Index.
a Values are expressed as mean ± SEM.
b Different capital letters signify significant differences between glucose and test bread types (P < 0.001).
c P-value < 0.05.
. $ Statistically significant difference between 25% and 50% soy breads at the specified times (P < 0.05).")
The mean ± SEM of Satiety response curves after consuming white bread, white bread with 25% soybean flour, and white bread with 50% soybean flour. Data are mean ± SEM. * Statistically significant difference between bread made from white wheat flour and 25% and 50% soy breads at the specified times (P < 0.05). $ Statistically significant difference between 25% and 50% soy breads at the specified times (P < 0.05).
Incorporation of soy flour significantly enhances the SI of white bread (SI = 100). The 50% soybean flour bread showed the highest SI. A significant difference exists between the SI of 25% and 50% soybean flour breads (P = 0.04). Specifically, 25% soy flour increases the SI by 2.68 times, while 50% raises it by 3.26 times. Figure 2 illustrates the satiety curve for white bread and those with 25% and 50% soy flour.
Soybean flour significantly increased the area under the satiety curve (P < 0.001). White bread had the lowest mean satiety, while the 50% soybean flour bread had the highest. Significant differences were observed between white bread and both 25% (P = 0.001) and 50% soy flour breads (P = 0.001). No significant difference was observed between the areas of the 25% and 50% soybean flour breads (P = 0.1).
4.3. Sensory Evaluation
Taste tests revealed a significant preference for 25% soybean flour bread over both white bread and 50% soybean flour bread (P = 0.02), suggesting that higher soy flour content reduces sensory satisfaction.
5. Discussion
5.1. Glycemic Index and Glycemic Load
Incorporating 25% and 50% soybean flour into white bread lowers its GI by 14% and 36.5%, respectively, and decreases GL by 27% and 5%. Fiber-rich flours, particularly those from legumes, significantly reduce the GI (14). The soluble and insoluble fibers in soybean flour slow gastric emptying and glucose absorption (15). Additionally, soy enhances insulin secretion via incretin-like substances (16) and may function as a DPP-4 inhibitor, aiding blood glucose management and promoting gradual glucose absorption. This results in increased satiety through GLP-1, stimulates insulin release, and reduces glucagon, helping to preserve beta-cell mass (17). These are hypotheses requiring further investigation.
Soy isoflavones may lower blood glucose levels through estrogen receptor activation. Genistein and daidzein regulate and enhance insulin production, supporting beta-cell survival (18). They inhibit tyrosine kinase, thus increasing insulin sensitivity through AMPK activation, and block α-glucosidase to reduce glucose absorption. Isoflavones also elevate beta-endorphin levels via alpha-1 receptor activation, improving glucose metabolism (19). Moreover, higher protein intake may delay gastric emptying and decrease postprandial glucose levels, while long-term soy consumption improves insulin sensitivity (20).
Simmons et al. demonstrated that pretzels containing 27% soy flour significantly reduced blood glucose levels in healthy individuals, resulting in a GI of 39.1 compared to those made with wheat flour (20). Lanzerstorfer et al. found that breads made with soybean flour have a low-GI, lowering blood glucose more effectively than white or oily breads (15). Urita et al. reported that cookies made with soy flour led to a lower blood glucose response compared to those with wheat (18). Oku et al. observed that cakes using whole soybean flour had a GI of 22, which mitigated glucose spikes from rice (17). Konig et al. noted decreased blood glucose levels after meals containing soy protein (21). Haque et al. indicated that incorporating 10 to 20% soy flour in bread lowered the GI by 17 to 35% (22). However, Emaleku et al. found no significant differences in blood glucose with a 1:3 soybean to whole wheat ratio (5). These variations are attributed to flour composition: Whole wheat flour contains more protein, B vitamins, and omega-3 and 6 fatty acids compared to refined wheat flour, and its bran is rich in fiber, iron, and B vitamins. Combining soy and whole wheat flour enhances fiber, protein, fat, and ash content while reducing moisture.
5.2. Satiety Index
Research shows that soy flour significantly increases satiety after consuming white bread. Adding 25% soy flour increases the SI by 2.68 times, while 50% raises it to 3.26 times. Sommer and Vodovotz found that a wheat-soy flour blend provides greater satiety than pure wheat bread (23). Similarly, Padhi et al. observed that soy muffins offer higher satiety despite having similar protein levels (24). Veldhorst et al. demonstrated that 25% soy protein enhances satiety in isocaloric custard (25). Additionally, Konig et al. revealed that a low-carbohydrate breakfast with soy protein resulted in greater satiety among obese individuals than a high-carb meal without soy (21). High-fiber, high-protein diets enhance satiety, and soy flour contributes these nutrients to bread (5). Fiber slows gastric emptying, while fermentable fibers promote short-chain fatty acids that stimulate satiety hormones (26). The larger particle size of soybean flour may also enhance satiety (27), and its proteins can increase digestive hormone secretion and lower ghrelin levels (28).
Soy protein may reduce food intake by stimulating insulin release and enhancing glucose absorption in peripheral tissues (29). Although plant proteins generally lack taurine, the cysteine in soy can be converted to taurine, potentially improving satiety (30). Low-GI foods promote slower digestion and gradual insulin release, leading to prolonged fullness (31). However, Simmons et al. found no significant difference in satiety between pretzels made with 27.3% soy flour and those made from wheat, attributing this to factors like physical activity, food type, and sleep (20). Wheat pretzels, being more prominent and higher in gluten, might provide greater satiety.
5.3. Sensory Evaluation
Sensory evaluation supports these findings; Haque et al. observed a significant flavor difference in bread with 10 - 20% soy flour compared to control samples (22). However, exceeding this range decreased consumer satisfaction regarding the bread's sensory quality.
This study's strength lies in its focus on bread, a global staple, particularly in the Iranian diet. Future research should employ larger, gender-balanced samples and investigate the long-term effects of soy flour-enriched bread on blood glucose, satiety, and palatability.
5.4. Conclusions
Soybean flour enrichment of white bread lowers GI and GI, increases satiety, and offers a suitable alternative for individuals with type 2 diabetes. This high-fiber, low-GI bread may also reduce food intake, potentially aiding weight management in obese individuals.
