


1. Background
Today, cancer is one of the leading causes of death worldwide, and efforts to find new treatment strategies and continuous research are increasing. Among the different treatment approaches, nanotechnology is recognized as an efficient and important technology to address carcinogens and to diagnose and treat all types of cancers (1, 2). Chitosan is a linear biopolymer with an average molecular weight of 50 - 1000 kD, consisting of D-glucosamine and N-acetyl-D-glucosamine units that are connected by β-(1→4) bonds. Due to its biocompatibility, biodegradability, and ability to form nanoparticles, it has attracted the attention of researchers in novel medicine for cancer treatment (3-5). Chitosan-based nanoparticles have great potential in the delivery of therapeutic agents and the effectiveness of anticancer drugs (6). These nanoparticles encapsulate bioactive compounds and enhance their solubility, stability, and targeted delivery to cancer cells while minimizing systemic toxicity (7, 8).
Medicinal herbs have been studied for their potential anticancer properties. Some of these herbs contain bioactive compounds that prevent the growth and progression of cancer cells through various mechanisms such as inhibiting cell proliferation, inducing apoptosis, and preventing metastasis (9, 10). Prangos acaulis, a perennial plant belonging to the Apiaceae family, is native to the mountainous regions of Central Asia, including Iran, and has various medicinal properties (11). Recent scientific research has shown that the bioactive compounds in P. acaulis have significant therapeutic properties against pathogens (12-14). Prangos acaulis can enhance the function of the immune system and is used as a safe medicinal plant to treat patients with immunodeficiency and microbial infections (15). Therefore, bioactive compounds in P. acaulis have demonstrated significant antioxidant activity that can protect cells from oxidative stress, which is a factor in causing cancer. However, there is limited information about the anticancer effect of bioactive compounds in P. acaulis.
Chitosan nanoparticles (Chitosan-NPs) loaded with medicinal plant extracts are a promising approach to increasing the delivery, stability, and therapeutic efficacy of bioactive compounds (16). This nanotechnology-based strategy has significant potential to improve the treatment of various diseases, including cancer, while minimizing side effects and improving patient outcomes (17, 18).
Chitosan-based nano-formulation of plant materials leads to the reduction of side effects and the possibility of continuous treatment of human colon cancer, as well as improving their anticancer activity against the MCF-7 cell line (19, 20). The novel drug-loaded chitosan-coated magnetic nanoparticles are compatible for use in MCF-7 cell treatment, and drug-loaded nanoparticles have no toxic effect on normal cells (21). Their ability to induce apoptosis, increase cytotoxicity, inhibit proliferation, and possess antioxidant and anti-inflammatory properties, overcome drug resistance, and improve pharmacokinetics makes them a very powerful tool in cancer treatment.
2. Objectives
Due to several previously confirmed biological effects of P. acaulis, such as antibacterial, antiviral, and anticancer activities, the study aimed to evaluate the anticancer potential of P. acaulis in both free and chitosan-based nano-formulation against two cancerous cell lines, including MCF-7 and HT29. The nanoparticulation process was confirmed by several methods, including DLS, zeta potential, field-emission scanning electron microscope (FESEM), and Fourier transform infrared (FT-IR), and the anticancer effects of the subjected samples were assessed by the MTT technique at different concentrations.
3. Methods
3.1. Plant Material and Extraction Process
First, the plant sample was collected, washed, air-dried, and then mechanically ground into a powder. This powder was stored in airtight, dark bottles at 4°C for future use. For extraction, a maceration method combined with ultrasonication was used (22). Fifty grams of the powdered plant sample were soaked in different solvents (distilled water, 70% ethanol, methanol, and hexane) at a 1:3 g/mL ratio. This mixture was shaken at room temperature for 48 hours. The initial extracts were then filtered and subjected to 30 minutes of sonication at 523 W and 40 kHz at room temperature. Finally, the remaining solvents were removed under vacuum at 35°C, and the concentrated extracts were freeze-dried and stored at -20°C.
3.2. Determination of Extraction Yield
Due to the application of different solvents for the plant extraction, the dry weight method was considered for determining the solvent efficiency. The extraction yield was calculated by equation 1 : Extraction yield % = Extracted solid (g)/Primary plant powder (g) × 100
3.3. Chitosan-Based Nanoformulation
Blank and loaded Chitosan-NPs were synthesized according to the study by Nosrati and Ranjbar (13). First, a chitosan solution (1 mg/mL) was prepared in 2% acetic acid, and its pH was adjusted to 4 with sodium hydroxide. Separately, a sodium tripolyphosphate (TPP) solution (1 mg/mL), used as a cross-linking agent, was prepared in sterile distilled water, and its pH was adjusted to 5 with hydrochloric acid. Blank Chitosan-NPs were formed by adding 3 mL of the TPP solution to 5 mL of the chitosan solution under continuous magnetic stirring at 750 rpm. For extract-loaded nanoparticles, 20 mg of the extract was dissolved in 20 mL of the TPP solution. This TPP-extract solution was then added dropwise to the chitosan solution (at a 5:10 ratio) at room temperature, with magnetic stirring for 30 minutes. Both blank and loaded nanoparticles were recovered by centrifugation at 4°C for 30 minutes at 11,000 rpm. The encapsulation efficiency (EE%) and loading capacity (LC%) were calculated using specific equation 2 (Encapsulation eiciency % = EXT - EXF/ EXT × 100) and equation 3 (Loading capacity % = EXT - EXF/ Weight of synthesized NPs × 100), based on the total and free amounts of the extract.
3.4. Nanoparticle Characterization
The presence of functional groups in the structure of the extract, blank nanoparticles, and loaded nanoparticles, as well as the interactions between the components of the studied nanoparticles, including the phytochemicals of the extract, TPP, and chitosan, were evaluated using FT-IR analysis (JASCO FT/IR-6300, Japan) in the range of 400 - 4000 cm-1 at a resolution of 4 cm-1. To observe the morphological characteristics of Chitosan-NPs loaded with plant extract, a FESEM, FEI, and NANOSEM-450 with an accelerating voltage of 3 keV was used. In addition, the average hydrodynamic diameter of the chitosan-loaded nanoparticles, size distribution, Polydispersity Index (PDI), and their corresponding zeta potential were measured using a nanoparticle analyzer (SZ-100, HORIBA) (23).
3.5. Prangos acaulis Extract Release Profile from Chitosan Nanoparticles
The release pattern of plant extracts loaded in Chitosan-NPs was investigated using UV-visible spectroscopy at pH 7.4. For this purpose, 100 mg of Chitosan-NPs loaded with the plant sample was suspended in 10 mL Tris-HCL buffer through magnetic stirring (temperature = 37°C and speed = 300 rpm). After that, at predetermined time intervals (5, 10, 15, 20, 25, 30, 35, 40, 45, 50, 55, 60, 65, 70, and 75 hours), the suspension sample prepared from nanoparticles loaded with plant extract was centrifuged for 20 minutes (temperature = 10°C and speed = 12,000 rpm), and the amount of the extract released in the supernatant was measured using the standard curve of the subjected extract. Finally, the percentage of extract release at each time interval was calculated using equation 4 : Extract release % = The amount of extract released in each time step/ Total entrapped extract × 100.
3.6. Anticancer Effects of Chitosan-Extract Nanoparticles
Similar to the free extract, the anticancer ability of the extract loaded in Chitosan-NPs was also tested against two cell lines, HT-29 and MCF-7, using the same method as described in section 2 - 3 at concentrations of 100, 250, 500, 1000, and 2000 μg/mL.
3.7. Anticancer Potential of Crude Extracts
The in vitro anticancer effects of four crude extracts (ethanol, methanol, water, and hexane) were evaluated against MCF-7 (ATCC HTB-22) and HT-29 (ATCC HTB-38) as important human cancer cell line models using the colorimetric tetrazolium reduction assay (MTT) (24). For this purpose, the cell lines were seeded in Roswell Park Memorial Institute medium (RPMI 1640) enhanced with 10% fetal calf serum (FCS), 100 μg/mL streptomycin, and 100 units/mL penicillin for 24 hours before the extract treatment. After that, the cells (at a density of 1.5 × 10⁴ cells/well) were exposed to the subjected plant extracts in different concentrations (100, 250, 500, 1000, and 2000 µg/mL) for 24 hours. After the treatment time, 10 µL MTT solution (5 mg/mL) was added to each well, and the plate was re-incubated for 4 hours. Subsequently, 100 µL of solubilization solution (10% SDS in 0.01 M HCl) was added per well, and incubation was continued for 24 hours. Finally, the absorbance of dissolved formazan crystals (produced by viable cells) was read at a wavelength of 570 nm (25). DMSO (1%) was also considered as a negative control. The cell viability percentage was determined as shown in the following equation 5: Cell viability % = Absorbance of treated cells/Absorbance of negative control × 100.
3.8. Statistical Analysis
In the present study, all the experiments were performed in triplicate, and the results were reported as the average of the repetitions along with the standard error. The difference between the means was checked with a one-way variance test, and the significance of statistical differences was checked with Duncan's post hoc test. The JASP 0.8.6 software was used for data analysis.
4. Results
4.1. Calculation of Extraction Efficiency
Due to the presence of a wide range of phytochemicals in plants, several different solvents were used in this research to achieve the best efficiency during the extraction process. The result of calculating the extraction efficiency with different solvents is summarized in Table 1. The results showed that among the different evaluated solvents, methanol-based extraction had the highest efficiency at about 14%, followed by 70% ethanol, sterile distilled water, and hexane.
4.2. Anticancer Activities of Crude Extracts
The use of different solvents in the extraction process leads to the extraction of a wide range of phytochemicals with different physicochemical characteristics. Therefore, the biological effects of the crude extracts, including their anticancer potential, may also vary. Consequently, the anticancer effects of all four types of extracts (distilled water, hexane, methanol, and 70% ethanol) against HT-29 and MCF-7 strains were evaluated using the MTT method. Table 2 reflects the results of the mentioned test. The results showed that none of the extracts exhibited significant cytotoxicity against the studied cell lines up to a concentration of 250 μg/mL.
| Type of Extract; Concentration (µg/mL) | Cell Viability (%) c | |
|---|---|---|
| HT-29 | MCF-7 | |
| Distilled water | ||
| 100 | 99.14 ± 0.8 | 99.52 ± 0.2 |
| 250 | 98.29 ± 0.09 | 98.04 ± 0.12 |
| 500 | 94.07 ± 0.14 | 96.018 ± 0.10 |
| 1000 | 92.02 ± 0.04 | 92.54 ± 0.16 |
| 2000 | 89.17 ± 0.6 | 90.47 ± 0.18 |
| Hexane | ||
| 100 | 100 ± 0.06 | 100 ± 0.04 |
| 250 | 98.82 ± 0.14 | 98.04 ± 0.44 |
| 500 | 98.07 ± 0.88 | 98.06 ± 0.52 |
| 1000 | 96.02 ± 0.06 | 97.05 ± 0.07 |
| 2000 | 95.08 ± 0.14 | 94.02 ± 0.6 |
| Methanol | ||
| 100 | 99.01 ± 0.1 | 99.04 ± 0.08 |
| 250 | 92.7 ± 0.4 | 93.14 ± 0.09 |
| 500 | 88.05 ± 0.02 | 92.05 ± 0.06 |
| 1000 | 79.05 ± 0.96 | 85.4 ± 0.05 |
| 2000 | 72.08 ± 0.11 | 82.04 ± 0.70 |
| Ethanol 70% | ||
| 100 | 99.01 ± 0.2 | 98.07 ± 0.14 |
| 250 | 92.08 ± 0.18 | 97.11 ± 0.75 |
| 500 | 88.05 ± 0.13 | 94.07 |
| 1000 | 85.01 ± 0.3 | 91.04 ± 0.17 |
| 2000 | 80.07 ± 0.10 | 87.1 ± 0.58 |
| DMSO (1%) | ||
| - | 99.50 ± 0.08 | 99.12 ± 0.09 |
Regarding the hexane extract, increasing the concentration up to 2000 μg/mL did not significantly change the level of cytotoxicity against the studied cells. The maximum level of cytotoxicity caused by the mentioned extract was calculated to be about 6% against the MCF-7 cell line. The study of the effects of cytotoxicity caused by the aqueous crude extract also showed that, like the hexane extract, no noticeable change in cytotoxicity against the studied strains was observed with an increase in concentration up to 1000 μg/mL. However, at the final concentration of 2000 μg/mL of the aqueous extract, there was close to 10% cytotoxicity against both investigated cell lines.
Unlike the aqueous and hexane extracts, the cytotoxicity of methanolic and ethanolic extracts increased in a concentration-dependent pattern. The most cytotoxic effects were observed at the concentration of 2000 µg/mL of the mentioned extracts. In summary, the comparison of the effectiveness of the different tested extracts showed that the methanolic extract of P. acaulis at the highest tested concentration (2000 µg/mL) exhibited the most cytotoxicity (nearly 28%) against the tested cell lines, followed by ethanol (with 20% cytotoxicity), aqueous (nearly 10%), and hexane (nearly 6%) extracts. Additionally, the comparison of the sensitivity of the tested cell lines indicated that the MCF-7 cells were more sensitive to the tested extracts compared to the HT29 cells.
4.3. Determination of Encapsulation Efficiency and Loading Capacity
Considering that the efficiency of extraction using methanol was higher than other solvents and the extract had the highest effectiveness in anticancer ability against HT-29 and MCF-7 cell lines, the extract was selected to evaluate the effect of chitosan-based nano-formulation on the anticancer ability of P. acaulis. Considering the recovery of 2.3 mg of free extract in the supernatant resulting from the ionic gelation process and obtaining 32.6 mg of nanoparticles loaded with methanolic extract, the loading efficiency and LC were calculated as 88.5% and 54.2%, respectively.
4.4. Nanoparticle Characterization
The Chitosan-NPs loaded with crude methanolic extract of P. acaulis were characterized in terms of morphology, size, and interaction between extract compounds and Chitosan-NP components. The FT-IR spectra shown in Figure 1 compare the methanolic extract and contrast it with the blank Chitosan-NPs and chitosan-extract nanoparticles (Chitosan-Extract-NPs). The high peaks shown on the Chitosan-NPs indicate characteristics that define the chitosan itself because of the broad absorptions within the region of 3500 - 3000 cm-1 attributed to the O–H and N–H stretching vibrations and a peak around 1400 - 1480 cm-1 relating to the C–H bending arising from polymerization. The extract differentiates by having distinct features, especially in comparison within the regions associated with functional groups such as phenolic O–H, C=C, and C–O stretching. The broadness, shifts in peak positions, and changes in intensity found in the 3500 - 3000 and the 1100 - 1500 cm-1 regions occur when considering the Chitosan-Extract-NPs. This indicates that the phytochemicals from the extract associate with the chitosan matrix through hydrogen bonding and intermolecular forces. An indication that these amino groups of chitosan are involved in the aforementioned interactions is the decreased intensity of the NH₂ peak in Chitosan-Extract-NPs compared to the blank Chitosan-NPs. New peaks appear or broaden within the 1100 - 1500 cm-1 region to indicate the incorporation of extract functional groups such as P=O stretching and phenolic C–O stretching into the nanoparticle platform.
 spectra of chitosan-tripolyphosphate (TPP) (black line), <i>Prangos acaulis</i> methanolic extract (red line), and chitosan-extract (blue line)")
The Fourier transform infrared (FT-IR) spectra of chitosan-tripolyphosphate (TPP) (black line), Prangos acaulis methanolic extract (red line), and chitosan-extract (blue line)
In general, the FT-IR spectra show that Chitosan-Extract-NPs were not merely physical mixtures of chitosan and extract but also resulted from effective chemical interactions between them. Such evidence includes the shifts and changes in the characteristic peaks, proving successful encapsulation and the establishment of a very stable nanoparticle system.
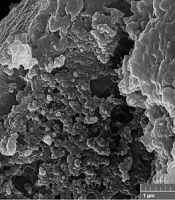
The surface characteristics and final shape of Chitosan-Extract-NPs were investigated using FESEM analysis. Figure 2 displays the FESEM micrograph of the mentioned nanoparticles at two different magnifications. Based on the obtained images, the synthesized nanoparticles include a range of amorphous, semi-spherical, and spherical nanoparticles in terms of their final shape.
 images of chitosan loaded by <i>Prangos acaulis</i> methanolic extract in two different magnifications")
The field-emission scanning electron microscope (FESEM) images of chitosan loaded by Prangos acaulis methanolic extract in two different magnifications
Measuring the average hydrodynamic diameter of Chitosan-Extract-NPs and their size distribution through DLS analysis (Figure 3) showed that the nanoparticles have an average diameter of 79.8 ± 4.5 nm. In addition, the surface charge of the produced nanoparticles was considered one of the influencing factors on their biological activity and physical stability. The result of measuring the zeta potential of Chitosan-Extract-NPs (Figure 4) demonstrated that the surface charge of these nanoparticles was +48.4 mV, which indicates their proper stability.
 extracted from DLS analysis; a mean diameter of 79.8 ± 4.5 nm was measured for the nanoparticles.")
Hydrodynamic size distribution of chitosan-extract nanoparticles (Chitosan-Extract-NPs) extracted from DLS analysis; a mean diameter of 79.8 ± 4.5 nm was measured for the nanoparticles.
; a mean zeta potential value of +48.4 mV was recorded for the nanoparticles.")
The zeta potential curve of chitosan-extract nanoparticles (Chitosan-Extract-NPs); a mean zeta potential value of +48.4 mV was recorded for the nanoparticles.
4.5. Release Profile and Anticancer Potential of Chitosan-Extract Nanoparticles
The release behaviors of the extract from Chitosan-NPs are shown in Figure 5. The results indicated that the release of the extract from the nanoparticles follows a sustained release pattern. The release began in an exponential phase for the first 40 hours, after which it continued in a controlled manner until the end of the investigated time. At the end of the investigated period, 46.9% of the total loaded extract was released. Based on a similar protocol, the anticancer potential of the methanolic extract in a chitosan-based nano-formulation was evaluated against MCF-7 and HT-29 cell lines.
 in a period of 75 hours")
The release behavior of Prangos acaulis methanolic extract from chitosan-extract nanoparticles (Chitosan-Extract-NPs) in a period of 75 hours
The cell viability values related to Chitosan-NPs, Chitosan-NPs loaded with extract, and free extract are listed in Table 3. As expected, due to the biocompatible nature of chitosan, significant cytotoxicity of blank Chitosan-NPs was not observed at the studied concentrations. Similar to the free extract, the level of cytotoxicity of Chitosan-Extract-NPs exhibited a concentration-dependent pattern, with the highest cytotoxicity observed at the highest concentration. The comparison of the effectiveness of the free extract and Chitosan-Extract-NPs showed that the cytotoxicity effects of the extract in the nano-formulation appear at lower concentrations. At a concentration of 250 μg/mL, where the free extract had no significant cytotoxicity, Chitosan-Extract-NPs decreased the viability of the examined cells by at least 10%. Unlike the free extract, which was more effective against MCF-7, the Chitosan-Extract-NPs exerted the same toxicity on both cell lines at the tested concentrations.
| Samples | HT-29 | MCF-7 | ||||||||
|---|---|---|---|---|---|---|---|---|---|---|
| 100 | 250 | 500 | 1000 | 2000 | 100 | 250 | 500 | 1000 | 2000 | |
| Blank chitosan NPs | 99.2 ± 0.11 | 100 ± 0.04 | 99.6 ± 0.6 | 100 ± 0.03 | 99.8 ± 0.08 | 100 ± 0.1 | 100 ± 0.07 | 100 ± 0.52 | 99.4 ± 0.04 | 99.7 ± 0.02 |
| Chitosan-extract NPs | 98.4 ± 0.21 | 90.04 ± 0.90 | 81.33 ± 0.08 | 65.88 ± 0.66 | 61.02 ± 0.22 | 98.03 ± 0.08 | 90.06 ± 0.11 | 79.44 ± 0.05 | 64.4 ± 0.27 | 60.07 ± 0.08 |
| Free-extract | 99.01 ± 0.1 | 92.7 ± 0.4 | 88.05 ± 0.02 | 79.05 ± 0.96 | 72.08 ± 0.11 | 99.04 ± 0.08 | 93.14 ± 0.09 | 92.05 ± 0.06 | 85.4 ± 0.05 | 82.04 ± 0.70 |
| DMSO (1%) | 99.7 ± 0.08 | 99.8 ± 0.2 | ||||||||
5. Discussion
According to the statistics reported by the International Agency for Research on Cancer (IARC), nearly 20 million cases of cancer will be reported in 2022, of which 11.6% are related to breast cancer and 9.6% are related to colon cancer. Therefore, the cytotoxicity of the studied extract was evaluated against two standard cell lines from breast (MCF-7) and colon (HT-29) cancers. Among the four evaluated crude extracts for their cytotoxicity against the cancer cell lines, the methanolic extract was more effective. Due to the higher efficiency in the extraction process, it can be said that the assessment of the cytotoxicity of the crude methanolic extract provides a correct estimate of the anticancer potential of P. acaulis against MCF-7 and HT-29 cell lines.
As a general weak point of medicinal plant extracts, which was also observed in this study, their cytotoxicity, regardless of the plant of origin, appears at high concentrations. In this study, the cytotoxicity of the examined extracts was shown at concentrations higher than 1000 μg/mL. This drawback can be related to their poor bioavailability (26).
Using the favorable characteristics of nanoparticles, such as high solubility, the ability to load a wide range of bioactive substances, active and passive targeted transfer, preventing dose loss, and providing simultaneous diagnosis and treatment, can improve the bioavailability of plant extracts (27). Here, we used Chitosan-NPs to improve the bioavailability of the studied methanolic extract. The Chitosan-NPs have been successfully used to prepare nano-formulations of essential oils (28), crude extracts (13), peptides (29), and proteins (30).
In the study, the ionic gelation method was used for the synthesis of Chitosan-NPs and Chitosan-Extract-NPs. The easy procedure and the possibility of one-step production of Chitosan-Extract-NPs are among the advantages of the mentioned method. However, due to being affected by various factors such as chitosan concentration, cross-linking concentration, reaction temperature, pH, and mixing speed (31), Chitosan-NPs with different sizes, surface charges, and morphologies have been reported in various research studies. For example, in the research conducted by Nosrati and Ranjbar, the size of Chitosan-NPs loaded with plant extract was around 90 nm (13), while the size of nanoparticles reported by Manne et al. was 676 nm (32). The hydrodynamic diameter of Chitosan-Extract-NPs was measured to be 79.8 ± 4.5 nm in this study.
The size of nanoparticles is a critical parameter in determining their efficiency, especially in their cytotoxicity against cancer cells. Several studies have shown that not only Chitosan-NPs containing medicine but also other nanoparticles such as silver (33), silicon dioxide (34), gold (35), and mesoporous silica (36) have resulted in a decrease in size and an increase in cytotoxicity. The PDI of nanoparticles is another index that shows the uniformity of particle size distribution and can affect the pharmacokinetic and pharmacodynamic properties of the loaded bioactive substance. In general, nanoparticles with a PDI less than 0.5 are considered non-homogeneous particles (37). Considering that the mentioned index for the Chitosan-Extract-NPs was estimated at 0.56, they had a uniform size distribution.
The surface charge of nanoparticles, which is determined by their composition and dispersion media, is one of the key features in determining their stability as well as their success rate in pharmaceutical applications. Nanoparticles with an average surface charge of > ±30 mV are considered stable, which prevents them from aggregation (38). As expected, due to the extensive presence of amine groups in the structure of chitosan, the average surface charge of Chitosan-Extract-NPs in this study was calculated as +48.4 mV. This finding is in accordance with several similar studies conducted regarding the nano-formulation of plant materials using chitosan. The positive surface charge of Chitosan-Extract-NPs can facilitate interaction with cells, especially cancer cells, due to the negative surface charge of the membrane. Additionally, chitosan can be considered an enhancer for the active ingredients of the extract for better transfer in the paracellular and transcellular space because chitosan can form strong complexes with the mucus of epithelial cells, which has a negative charge, through ionic, hydrogen, and hydrophobic bonds (39, 40).
The shape of nanoparticles is another effective factor in the level of cytotoxicity of nanoparticles. The results of previous research have shown that spherical nanoparticles are less toxic compared to nanotubes, nanofibers, and nanoplates (41). As an important indicator, the shape of Chitosan-Extract-NPs was also investigated in this study. Three categories of spherical, semi-spherical, and amorphous nanoparticles were observed in the FESEM micrograph prepared from Chitosan-Extract-NPs. The shape of Chitosan-NPs can be affected by the isolation and synthesis stages, as well as the loaded bioactive substance. Therefore, various forms such as amorphous (42), rod (43), spherical, and semi-spherical (13) Chitosan-NPs have been reported in different studies.
Confirming the loading of the active ingredient in the carrier nanoparticle is one of the key steps in evaluating the successful preparation of a nano-formulation. For this purpose, FT-IR has been considered an effective characterization method in research related to the loading of bioactive substances in nanoparticles, including Chitosan-NPs (44). Considering the effect of the type of chitosan (molecular weight and degree of deacetylation), the type of cross-linking agent, as well as the type of loaded bioactive substance on the shape and details of the FT-IR spectrum, there is a discrepancy in reporting the exact location of the absorption peaks of the same functional groups. Nevertheless, as a general conclusion from studies related to the loading of plant extracts in Chitosan-NPs, the presence of specific absorption peaks of chitosan, extract, and cross-linking agent (such as NH2 at 3365, O-H at 3439, C≡C at 2134, C=N at 1656, and P=O at 1078) in the FT-IR spectra of Chitosan-Extract-NPs indicates the successful loading of the studied extract.
The release pattern of the bioactive substances from the carrier nanoparticle is an important factor in determining their persistence within the effective dose range. Based on this, recently, the production of polymer-based nano-formulations such as chitosan has gained special importance due to the possibility of controlled release of loaded substances (45). Examining the release behavior of the studied extract from Chitosan-NPs over a period of 75 hours showed that at least two specific phases can be traced in the release of the extract. In the first phase, which lasted up to 40 hours, the rapid release of the extract was observed. After the mentioned period, this led to the release of nearly 47% of the total loaded extract. The second phase, which included the slow release of the extract, began and continued until the end of the study period. This biphasic pattern has been observed in other similar studies, which can be attributed to the surface erosion of Chitosan-NPs and the release of extracts attached to the surface, followed by the slow release phase due to the gradual release of the extract trapped in the polymer matrix (46).
The effect of chitosan-based nano-formulation on the cytotoxicity of the studied methanolic extract was evaluated using the common MTT method. In this research, it was found that bulk Chitosan-NPs in the concentration range of 100 - 2000 µg/mL do not exhibit significant cytotoxicity. However, there are conflicting data regarding the cytotoxicity of these nanoparticles against cancer cell lines. The cytotoxic effects of blank Chitosan-NPs have been previously confirmed against BEL7402, BGC823, Colo320 (45), A549 (28), and HCT-116 (47) cancer cell lines. Nevertheless, the cytotoxicity of the methanolic extract loaded in Chitosan-NPs was observed at lower concentrations compared to the free extract, and its effectiveness was also higher at the same concentration. The synergistic effect of Chitosan-NPs on the level of cytotoxicity of bioactive substances, especially plant compounds, has already been proven in the case of Leonotis nepetifolia extract (48), thymine (39), diosgenin (49), and carvacrol (50). This phenomenon can be related to the increased bioavailability through enhanced penetration in the target cell and the improvement of their solubility.
5.1. Conclusions
In this study, the effect of a chitosan-based nano-formulation on the cytotoxicity of the methanol extract of P. acaulis against two cancer cell lines, HT-29 and MCF-7, was evaluated using the MTT method. The results showed that the loading of the studied extract in nanoparticles increases the performance of the extract and the appearance of cytotoxicity effects at lower concentrations than the free extract. According to the obtained results, Chitosan-Extract-NPs are a suitable candidate for further in vitro and in vivo evaluations of their anticancer potential.
