1. Background
G protein-coupled receptors (GPCRs) represent the largest family of cell-surface receptors involved in pathways and cellular responses. They are targets for numerous medicinal drugs, and therapeutic strategies because of their important function in diseases (1). Production of large quantities of these receptors for drug screening and structural biology remains challenging. The vasopressin type 2 receptor (V2R) is a GPCR of 371 amino acids, located in nephrons, with seven transmembrane domains coupled to G protein via adenylyl cyclase and cAMP as its second messenger system (2-5). Water reabsorption in the kidney collecting ducts is the main function of vasopressin, producing its anti-diuretic response (6, 7). Disturbances in vasopressin action are associated with several abnormalities of water balance including congestive heart failure, kidney, liver and brain associated diseases. A recent study showed that the oral vasopressin (AVP) type 2 receptor (V2R) antagonist tolvaptan has protective effects and can prevent not only the progression of left ventricular dysfunction but also that of renal injury in hypertensive rats with heart failure (8). Some V2R mutations result in nephrogenic diabetes insipidus (NDI); consequently, to develop an adapted therapy for NDI, knowledge of V2R is needed (9, 10). There are several techniques to study the V2R, all employing antibodies. Production of antibodies against V2R needs an injection of its molecule to raise the antibody titer in lab animal. Expression of V2R in Escherichia coli, a heterologous host cell, is an approach to prepare V2R to produce antibodies against it. Previously, V2R cDNA was inserted into the pET15b plasmid (data not shown). The next step was expression of V2R in E. coli and optimizing the process.
2. Objectives
The current study aimed to optimize expression of V2R in E. coli. Full factorial design was employed to optimize cultural conditions to improve expression of V2R in E. coli BL21 (DE3). The effect of three variables, IPTG concentration, induction temperature and harvesting time after induction, on protein expression were studied. The current study also reported the isolation and purification of protein using Ni2+-NTA His-Bind Resin®.
3. Materials and Methods
3.1. Materials
Acrylamide, bis-acrylamide (Bis) and ammonium persulfate were obtained from Merck, Germany; mouse anti-human influenza virus hem agglutinin immunoglobulin G (mouse anti-HA IgG), horseradish peroxidase (HRP)-conjugated goat anti-mouse Fab specific immunoglobulin G (HRP-conjugated anti-mouse IgG), β-mercaptoethanol, bromophenol blue, Tween 20 and N.N.N N-tetramethylenediamine (TEMED), O-phenylenediamine dihydrochloride (OPD) were purchased from Sigma, Germany. Ponceau-S was obtained from Multuchemetron, Italy. Anti His-tag and Ni-NTA His resin were from Novagen, USA. Isopropyl-β-D-thiogalactoside (IPTG) and protein molecular weight marker were obtained from Fermentas, Germany. All other chemicals were from Merck, Germany.
3.1.1. Plasmids, Strains and Growth Medium
Escherichia coli BL21 (DE3) [F–ompThsdSB (rB–mB–) galdcm (DE3)] (Cinnagen, Iran) was used as the bacterial strain. Luria-Bertani medium (LB) containing 10 g/L tryptone, 5 g/L yeast extract, and 10 g/L NaCl was used to grow the strains. LB agar plates containing ampicillin (100 µg mL-1) were used to screen the transformed cells (11).
3.2. Methods
3.2.1. Expression of V2R in E. coli
The recombinant plasmid V2R/pET15b (rpET) was transformed into competent E. coli strain BL21 (DE3) cells, prepared using the calcium chloride method (12). Transformed cells were plated onto Luria-Bertani (LB)-agar plus 100 μg/mL ampicillin and incubated at 37°C overnight. To express V2R/pET recombinant protein, 2 mL of the overnight culture (LB supplemented with 100 μg/mL ampicillin) was used to inoculate 18 mL of LB media. The cells were grown in a shaking incubator at 37°C until OD600 reached 0.6. Over expression of recombinant protein was induced by the addition of IPTG to the final concentrations of 0.75, 1, 1.25, 1.5 and 2 mM and the cultures were grown for three hours. One milliliter of culture was harvested separately every 60 minutes after induction. Cells were then harvested by centrifugation at 12000 Χg for five minutes at room temperature and after removing the supernatant; the bacterial pellet was resuspended in 1000 µL of PBS (0.75 mM Na2HPO4, 0.1 mM NaCl, 1.7 mM KH2PO4, pH = 7.2) and 50 µL of 5ΧSDS sample buffer (0.5 M Tris-HCl, pH = 6.8, Glycerol, 10% SDS, 0.4 mM β-mercaptoethanol and 0.5% bromophenol blue) was added and then samples were heated at 100°C for five minutes. 50 μL of each sample was electrophoresed on a 12% SDS polyacrylamide gel with a 5% stacking gel (13). Proteins were stained with Coomassie blue for one hour and individual proteins were visualized by destaining with methanol and acetic acid solution (10). Coomassie-stained SDS-gels were analyzed by documentation instrument to estimate protein.
3.2.2. Expression of V2R at Different Temperatures
To examine the effects of different temperatures on V2R expression, the same process, as outlined above, was utilized. Synthesis was induced by addition of IPTG to the final concentration of 1 mM. The cultures were incubated for one hour at 25, 30, 35, 37, and 39°C. At the end of incubation, the OD600 of the cultures were measured and cells were harvested by centrifugation. Pellets were then prepared and analyzed by SDS-PAGE and dot blotting method.
3.2.3. Western Blot Analysis
Lysates of E. coli BL21 (DE3), E. coli BL21 (DE3) with pET-15b plasmid, and E. coli with V2R- pET plasmid were separated by 10% SDS-PAGE. Samples were electrophoresed at 80 V for 20 minutes. Samples were resolved by SDS-PAGE and electroblotted onto nitrocellulose membranes (Biorad, USA). After electroblotting, the membrane was stained with Ponceau-S (Multuchemetron, Italy) for one minute to see molecular size marker bands, then rinsed four times with water and then incubated for one hour in blocking solution (2.5% skim milk solution) at 37°C, followed by washing with PBS. The membrane was blocked in a non-fat milk (AB chemie, England) solution containing mouse anti-HA IgG as primary antibody for one hour while shaking. Subsequently, the horseradish peroxidase (HRP)- conjugated goat anti-mouse Fab specific IgG (1:5000 dilutions in 2.5% non-fat milk) were added as secondary antibody at a 1:5000 dilution in 2.5% non-fat milk for one hour and incubated at room temperature. The membranes were washed three times with PBS/Tween 20 (PBS-T) (each for five minutes), at room temperature after each incubation. The PBS-T was removed and the reactive bands were visualized by OPD (Merck, Germany) staining.
3.2.4. Dot-Blot Analysis
The HA antigen was detected by dot blotting. First, 2 μL of the sample was spotted onto nitrocellulose (NC) membranes and air-dried, then blocked by non-fat milk suspension for one hour at 37°C, and washed in PBS with 0.05% PBST. The nitrocellulose membranes were incubated in a non-fat milk solution containing mouse anti-HA IgG as primary antibody at a 1:500 dilution for one hour at 37°C, and washed in PBS with 0.05% PBST. Finally, the HRP conjugated goat anti-mouse IgG Fc (1:5000) was added for one hour at 37°C, and rinsed with PBST at room temperature. The OPD solution was used to detect antigens on nitrocellulose membrane.
3.2.5. Extraction of Poly-His Tagged Protein From Crude Cell Lysate
The pellet was resuspended in 200 μL of buffer A (48.48 g urea, 3.8 g sodium phosphate and 120 mg Tris-base were dissolved in 60 mL distilled water, pH = 8). The cell lysate was centrifuged (8000 g for five minutes) to remove the cellular debris. Fifty microlitters of 50% slurry Ni2+-NTA His-Bind Resin® (Novagen) was added according to the manufacturer’s instruction and mixed gently for 30 minutes at room temperature. The cell lysate was centrifuged (13000 g, for 10 minutes) to collect the insoluble fraction (IF). After two washing steps with 250 microlitters buffer B (48.48 g urea, 3.8 g sodium phosphate, 120 mg Tris-base were dissolved in 60 mL distilled water, pH = 6.3), the protein mixture was eluted three times with 250 microlitters buffer C (48.48 g urea, 3.8 g sodium phosphate, 120 mg Tris-base were dissolved in 60 mL distilled water, pH = 4.5) then the supernatant was collected and stored at -20°C. Purified samples were analyzed by 12% SDS-PAGE and Western blotting.
3.2.6. Statistical Analysis
The design of experiment was full factorial with three replications (IPTG concentration, induction temperature and harvesting time after induction). All 225 prepared samples were analyzed using dot blotting method. All detected dots were digitalized using a gel documentation set and their intensity was quantified by Photo-Capt software (Vilber Lourmat, France). All quantitative data were statistically analyzed using Design Expert software by ANOVA test to obtain the optimum condition of expression.
4. Results
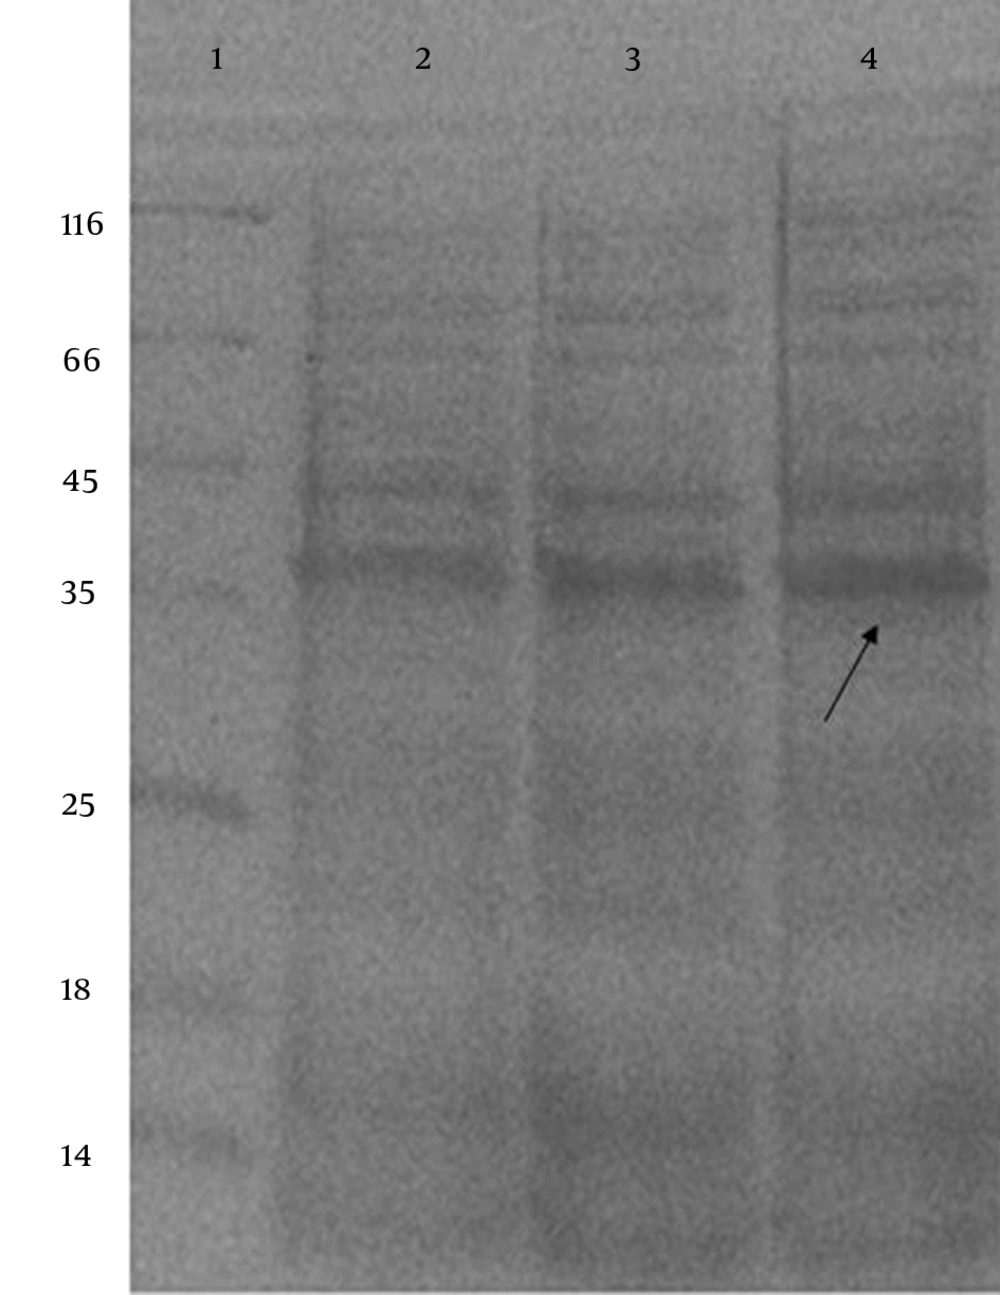
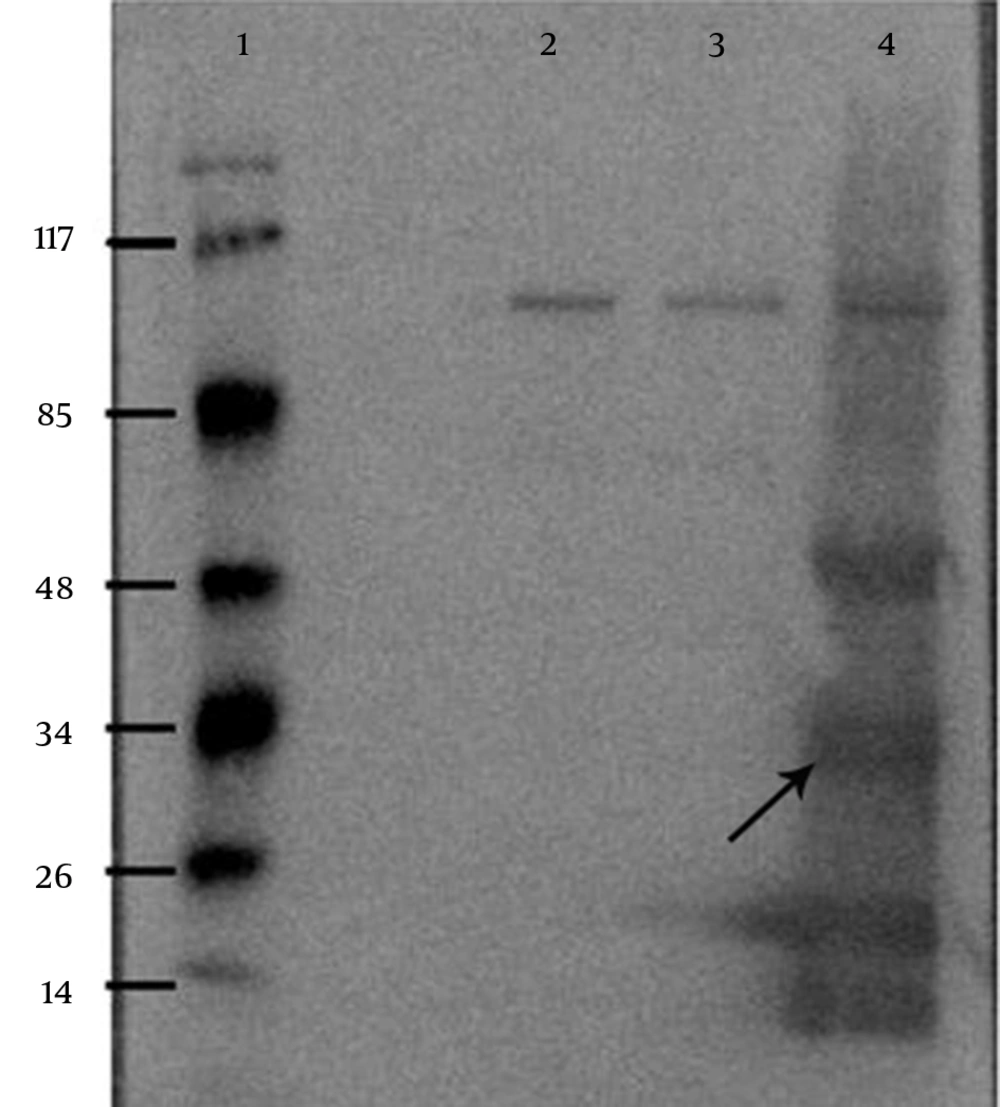
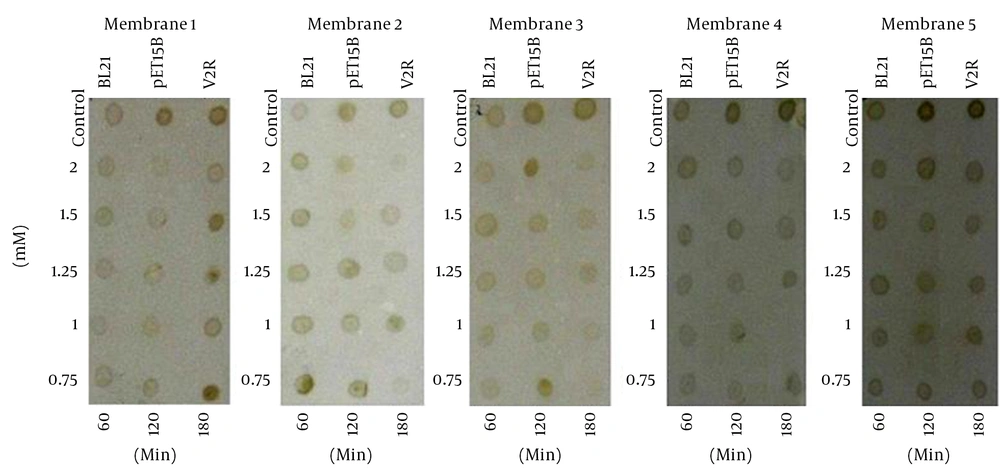
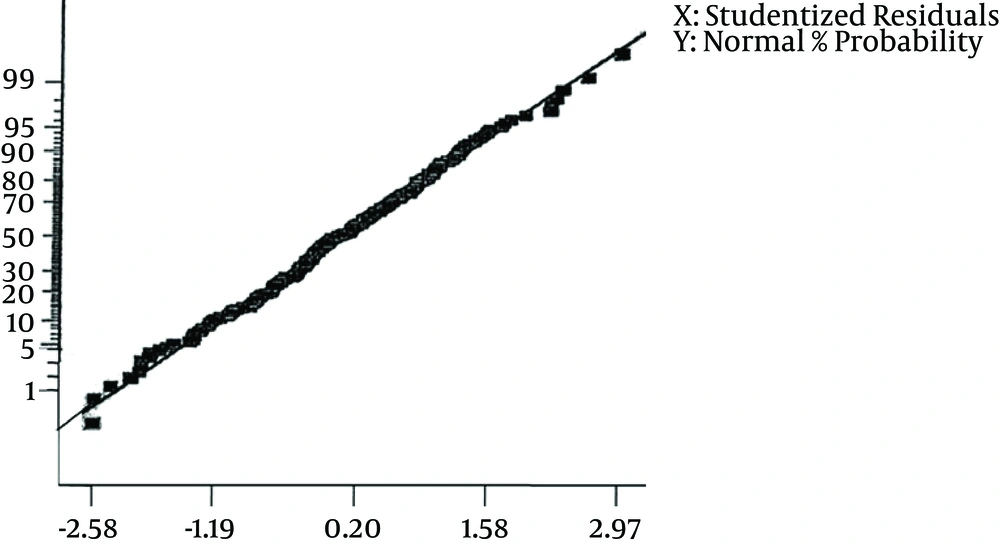
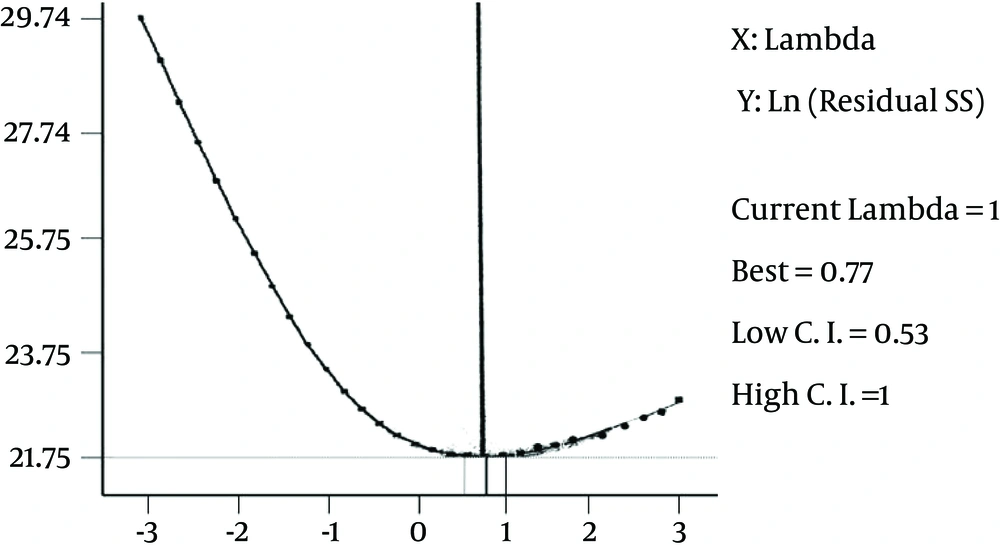
After IPTG induction, the crude lysate and purified samples were analyzed by SDS-PAGE and Western blotting. The results of the 12% SDS-PAGE electrophoresis showed no clear band of expressed protein on the gel (Figure 1). For Western blot analysis, the samples resolved by SDS-PAGE were electroblotted onto a nitrocellulose membrane. According to the results of Western blot analysis, the recombinant protein was visualized as four bands with the molecular mass of 20, 33, 51 and 66 kDa (Figure 2). Based on the most intensity observed by dot blotting, the most expression occurred by induction with 0.75 mM IPTG for three hours at 37°C (Figure 3). In statistical analysis of data, the normal plot shows the normality of the distribution of the studentized data. The fitness of the data on the black line (standard normal distribution) represents the normality of the studentized data (Figure 4). To find the best model for data analysis, the lack of fit of each model was tested (Table 1). The quadratic model was the best because of the P value and the least pure error of the model. Analysis of variance (ANOVA) of the data showed that the quadratic model was highly significant at P < 0.0001. Therefore, the expression of V2R was affected by at least one of the factors. It was shown by ANOVA that expression was significantly affected only by sampling time at P < 0.0001. No significant interaction was observed between the factors. Coefficients of each intercept of the quadratic model were estimated for polynomial evaluation of the model (Table 2). Based on Box-Cox plot of non-transformed data no transformation of data was needed. The best lambda was 0.77, low critical limit was 0.53 and the high critical limit was 1.00. Current lambda was obtained 1.00 which was included in the acceptable range (Figure 5). Subsequently, the optimized conditions of expression were shown in Table 3 based on the maximum intensity of dots and more expression of V2R by Design Expert software.
The primary antibody, mouse anti-HA IgG; The secondary antibody, HRP- conjugated anti-mouse IgG; Detection system, OPD solution. A, Membrane 1: dot blotting of crude lysate at 25°C; B, Membrane 2:dot blotting at 30°C; C, Membrane 3: dot blotting at 35°C; D, Membrane 4: dot blotting at 37°C; and E, Membrane 5: blotting at 39°C.
| Source | Sum of Squares | DF | Mean Square | F Value | Prob > F |
|---|---|---|---|---|---|
| Linear | 1.031E + 009 | 71 | 1.452E + 007 | 1.00 | 0.4975 |
| 2FI | 9.662E + 008 | 68 | 1.421E + 007 | 0.97 | 0.5383 |
| Quadratic | 6.903E + 008 | 65 | 1.062E + 007 | 0.73 | 0.9251 |
| Cubic | 5.547E + 008 | 56 | 9.905E + 006 | 0.68 | 0.9505 |
| Pure Error | 2.157E + 009 | 148 | 1.457E + 007 | NA | NA |
Lack of Fit Test
| Factor | Coefficient Estimate | DF | Standard Error | 95% CI Low | 95% CI High |
|---|---|---|---|---|---|
| Intercept | 10907.81 | 1 | 619.40 | 9686.84 | 12128.79 |
| A | 1417.40 | 1 | 313.46 | 799.50 | 2035.30 |
| B | 250.47 | 1 | 343.43 | 426.52 | 927.45 |
| C | 431.28 | 1 | 366.35 | 290.87 | 1153.44 |
| A2 | 1983.56 | 1 | 518.56. | 3005.75 | 961.36 |
| B2 | 1016.09 | 1 | 627.75 | 221.34 | 2253.53 |
| C2 | 1046.5 | 1 | 564.72 | 2159.73 | 66.64 |
| AB | 469.15 | 1 | 421.55 | 1300.12 | 361.82 |
| AC | 179.54 | 1 | 449.02 | 705.58 | 1064.66 |
| BC | 856.07 | 1 | 491.27 | 112.33 | 1824.47 |
| ABC | 524.20 | 1 | 603.23 | 664.90 | 1713.30 |
Estimation of Coefficients
| Number | Sampling Time | Temperature | IPTG Concentration | Intensity |
|---|---|---|---|---|
| 1 | 3 | 37 | 0.75 | 28484.0 |
| 2 | 2 | 39 | 1.25 | 15073.7 |
| 3 | 2 | 25 | 1.00 | 13906.3 |
| 4 | 3 | 35 | 1.25 | 13755.3 |
| 5 | 3 | 25 | 1.00 | 13684.0 |
| 6 | 2 | 37 | 1.00 | 13615.0 |
| 7 | 2 | 35 | 1.25 | 13416.3 |
| 8 | 3 | 25 | 2.00 | 12646.0 |
| 9 | 2 | 30 | 1.00 | 12459.3 |
| 10 | 3 | 39 | 2.00 | 12284.0 |
| 11 | 2 | 25 | 0.75 | 12248.3 |
| 12 | 3 | 35 | 1.50 | 12224.0 |
| 13 | 2 | 37 | 1.50 | 12081.0 |
| 14 | 3 | 37 | 1.50 | 11795.7 |
| 15 | 3 | 37 | 2.00 | 11750.7 |
| 16 | 2 | 30 | 1.50 | 11639.3 |
| 17 | 2 | 39 | 2.00 | 11624.7 |
| 18 | 3 | 30 | 1.50 | 11497.7 |
| 19 | 2 | 35 | 0.75 | 11455.7 |
| 20 | 3 | 30 | 1.50 | 11316.3 |
| 21 | 3 | 39 | 1.00 | 11196.0 |
| 22 | 3 | 37 | 1.25 | 11193.3 |
| 23 | 2 | 35 | 1.50 | 11193.3 |
| 24 | 3 | 25 | 1.50 | 11192.0 |
| 25 | 3 | 39 | 1.50 | 11123.3 |
| 26 | 2 | 37 | 1.25 | 10921.7 |
| 27 | 2 | 30 | 2.00 | 10884.7 |
| 28 | 2 | 25 | 2.00 | 10782.7 |
| 29 | 3 | 39 | 1.25 | 10734.3 |
| 30 | 3 | 25 | 0.75 | 10669.7 |
| 31 | 1 | 37 | 2.00 | 10484.0 |
| 32 | 2 | 39 | 1.50 | 10467.3 |
| 33 | 3 | 35 | 2.00 | 10385.3 |
| 34 | 2 | 35 | 2.00 | 10379.3 |
| 35 | 1 | 39 | 1.25 | 10305.3 |
| 36 | 2 | 37 | 2.00 | 10257.7 |
| 37 | 2 | 39 | 0.75 | 10184.3 |
| 38 | 1 | 35 | 1.25 | 10076.3 |
| 39 | 2 | 25 | 1.50 | 10066.0 |
| 40 | 3 | 25 | 1.25 | 10019.7 |
| 41 | 3 | 30 | 1.25 | 10018.7 |
| 42 | 3 | 39 | 0.75 | 9834.33 |
| 43 | 2 | 25 | 1.25 | 9499.00 |
| 44 | 2 | 30 | 0.75 | 9382.33 |
| 45 | 1 | 37 | 1.00 | 9229.67 |
| 46 | 2 | 35 | 1.00 | 8982.33 |
| 47 | 2 | 39 | 1.00 | 8690.33 |
| 48 | 3 | 35 | 1.00 | 8648.33 |
| 49 | 1 | 30 | 1.00 | 8336.33 |
| 50 | 1 | 25 | 2.00 | 8334.00 |
| 51 | 1 | 37 | 1.50 | 8315.33 |
| 52 | 1 | 39 | 1.00 | 8242.67 |
| 53 | 1 | 39 | 2.00 | 8230.67 |
| 54 | 1 | 25 | 0.75 | 8193.00 |
| 55 | 3 | 30 | 0.75 | 7876.67 |
| 56 | 1 | 37 | 0.75 | 7773.00 |
| 57 | 1 | 35 | 1.50 | 7752.67 |
| 58 | 1 | 30 | 1.25 | 7555.67 |
| 59 | 1 | 30 | 2.00 | 7466.67 |
| 60 | 1 | 30 | 1.50 | 7378.00 |
| 61 | 2 | 30 | 1.25 | 7325.33 |
| 62 | 1 | 39 | 0.75 | 7287.00 |
| 63 | 1 | 35 | 2.00 | 7250.00 |
| 64 | 1 | 39 | 1.50 | 6981.67 |
| 65 | 2 | 37 | 0.75 | 6831.67 |
| 66 | 1 | 37 | 1.25 | 6724.67 |
| 67 | 3 | 37 | 1.00 | 6422.67 |
| 68 | 1 | 35 | 0.75 | 5865.67 |
| 69 | 1 | 30 | 0.75 | 5800.33 |
| 70 | 3 | 35 | 0.75 | 5753.67 |
| 71 | 1 | 35 | 1.00 | 5669.00 |
| 72 | 1 | 25 | 1.50 | 5551.33 |
| 73 | 1 | 25 | 1.00 | 5549.33 |
| 74 | 1 | 25 | 1.25 | 4465.00 |
| 75 | 3 | 30 | 2.00 | 4462.33 |
Ordered Conditions of Expression From Maximum Intensity to Minimum
5. Discussion
The current research aimed to observe the effect of different investigational conditions on the expression of V2R in E. coli strain BL21 (DE3) using pET system and then analyze the crude cell lysate and extracted V2R by SDS-PAGE and Western blotting. Authors’ previous studies showed that the main cultural conditions influencing the protein expression are inducer concentration, temperature and time of incubation (14). Accordingly, the study selected these parameters to optimize protein expression.
The PET System is one of the strongest systems to express recombinant proteins in E. coli. The pET plasmids have a strong T7 promoter which utilizes most of the cells resources for the target gene expression, when this promoter is completely induced (15). One more significant advantage of this system is that it normally expresses proteins when induced by IPTG. Additionally, pET vector series enable His-Tag fusions at both N and C-terminus which makes it easier to purify the expressed proteins using affinity chromatography (16). It is noticeable that V2R is a seven transmembrane α-helical protein; therefore, it is a very lipophilic molecule that tends to aggregate and form inclusion bodies. The main advantage of inclusion bodies is that they are mostly composed of the recombinant protein and can be easily isolated from the cell debris (11). To express the protein, the recombinant plasmid (V2R /pET) was transferred to E. coli strain BL21 (DE3) which is the most extensively used host for target gene expression. Cell mass and target protein yields are often increased several-fold using IPTG induction (17). By adjusting the concentration of IPTG, expression of proteins can be regulated at different levels, lower level expression can increase the solubility and activity of some target proteins (12). The concentration of IPTG used to induce lac repressor-regulated promoters can significantly influence expression. With some proteins, it is important to slowly induce transcription of the expression plasmid (with lower IPTG concentrations) while with others, the production of high amounts of protein is desired (11). Therefore, in the current study the effect of different concentrations of IPTG on V2R expression was examined using dot blotting. Dot blotting of crude lysate, to detect protein, is similar to the western blot technique, but different in the protein samples that are not initially separated electrophoretically on polyacrylamide gels but simply applied directly onto the membrane surface. The intensity of all dots was analyzed and 0.75 mM concentration was selected as being optimum. In the current experiments, the optimum temperature to express protein was 37°C. In agreement with the current study results Shafiee et al. reported that the most protein expression was accrued at 37°C and for two hours incubation (14).Schein reported that growth at 37°C caused some proteins to accumulate as inclusion bodies, while incubation at 30°C led to soluble and active protein. Prolonged (e g, overnight) induction at low temperatures (15 - 20°C) may prove to be optimal for the yield of soluble protein (18). Akbari et al. reported that the ratio of soluble to insoluble protein was highest at a low temperature of 25°C and the expression of total single-chain variable fragment (ScFv), both soluble and insoluble fractions, increased with temperature (19). Gholipour et al. observed that the highest Expression of the peptidoglycan-associated lipoprotein (r-PAL) protein was induced by the addition of 1mM IPTG induction for 15 hours (20). Khalesi et al. reported that the optimum expression occurred at 1mM IPTG concentration, after three hours and at 37°C (21).The V2R was expressed in complete and incomplete forms with the sizes of about 33 and 20 kDa. Dimerization of the expressed proteins is possible (bands of 66 and 51 kDa). The most important factor was sampling time. Therefore, storage consideration and addition of protease inhibitors to the expressed samples are recommended. The expressed V2R could be used to produce polyclonal antibodies and purify them. It might also be useful in pharmacological, biochemical and structural studies.
In conclusion, the current study investigated various conditions, including IPTG concentrations (0.75, 1, 1.25, 1.50 and 2 mM) various temperatures (25, 30, 35, 37 and 39°C), different harvesting time (60, 120 and 180 minutes) on the expression of V2R. The maximum amount of protein production was obtained by the addition of 0.75 mM IPTG after 180 minutes, at 37°C. The influence of the above mentioned variables on the expression of V2R in E. coli cells would allow researchers to study the parameters affecting the function of this protein in future experiments.
