1. Background
Diabetes is recognized as a common metabolic disorder that is described by high plasma glucose levels, as a result of insulin resistance or lacking of insulin secretion from pancreatic beta cells (1). This disease affected about 382 million people worldwide in the 2013 and its incidence rate is estimated to reach 592 million people by 2035 (2). Many clinical trials and epidemiological experiments support the idea that high blood glucose levels is the major cause of short-term diabetic complications such as diabetic ketoacidosis and hyperosmolar hyperglycaemic state (HHS) and also long-term complications such as nephropathy, cardiovascular disease and retinopathy (1). On the other hand, free radicals are involved in several diseases such as cancer, atherosclerosis and diabetes. Components, which are able to scavenge free radicals, play a potential role in improving these diseases (3, 4). Antioxidants play a vital role in the protection of body cells from damage induced by free radicals (5). Increase in oxidative stress that is motivated by free radicals has been established in patients with diabetes. Rise of blood glucose and free radicals can start lipid peroxidation that stimulates protein glycation, enzymes inactivation and metabolism alteration, and also plays a major role in the long-term complications of diabetes (1). This non-enzymatic glycation of blood protein leads to formation of advanced glycosylation end products (AGEs), which cause different complications in diabetes (1, 4).
It has also been identified that induced diabetes by Streptozotocin in animal models mainly provokes production of oxygen free radicals and thus destructs pancreatic cells (5). Supplementation with natural antioxidants can be one of the therapeutic approaches for declining hyperglycemia and free radicals in diabetic patients (6, 7). During the past few years, great attention has been paid to the use herbal medicine for the treatment of diabetes (4). Ethno-botanical evidence shows that about 800 plants are applied as traditional remedies for diabetes complications treatment (4).
The hypoglycemic properties of numerous herbal medicines has been assessed and established in humans and animal models. Different extracts of some plants and plant derivatives and their components have been shown to contain significant antioxidant activity and hypoglycemic properties. In this respect, cinnamon and Trigonella foenum are traditional herbal medicines, which display hypolipidemic, hypoglycemic and antioxidant properties (6, 8-10). Although Cinnamon and Trigonella foenum showed hypolipidemic and hypoglycemic activity, possible mechanism of their action in diabetic animals, especially for the later herbal is unknown.
2. Objectives
The current study was planned to investigate the effect of Trigonella foenum and Cinnamon on glycation, some biochemical factors, liver histology and lipase and cholesterol 7-alpha hydroxylase activity in type 2 diabetic rats.
3. Methods
3.1. Preparation of Plant Extracts
Trigonella foenum and Cinnamon powder were prepared and then crushed and dried. Next, 20 g of dried powder was mixed with 200 mL of deionized water at room temperature for 48 hours. The residue was filtered, and the filtrate solution was concentrated at 40°C in an incubator for 24 hours. The extract of Trigonella foenum and Cinnamon was kept in dark vials at -20°C until analysis.
3.2. Glycation of Bovine Serum Albumin and Advanced Glycation End Products (AGE) Assay
Bovine Serum Albumin (BSA) was glycated via treatment with fructose and produced AGEs was measured using spectrophotometric assay according to the method described by Abbasi Oshaghiet al. (11). Briefly, BSA (10 mg/mL) was treated separately with two concentrations of fructose (500 and 200 mM) containing 0.02% sodium azide (in 0.1 M phosphate buffer) and in the absence and precedence of different concentrations of Trigonella foenum or Cinnamon (0.25 - 2 mg/ mL). Also, Aminoguanidine (AG) was used as a positive control in this experiment (12). The tubes were incubated at 37°C at dark room for two, three, and four weeks. After that, solutions of every tube were dialyzed against phosphate buffered saline (PBS) (at 4°C) for 48 hours. Following dialysis, the protein concentration was measured using the Bradford assay. Fluorescence intensity was determined at 335 nm excitation and 460 nm emission (13) using a spectrofluorometer (Jasco FP-6200).
3.3. Determination of Fructosamine
The fructosamine formation was determined according to previous published method (13) using nitroblue tetrazolium (NBT). Briefly, 90 μL of NBT (0.5 mM) in 0.1 M carbonate buffer (pH 10.4 at 37°C) was mixed with 10 μL of a prepared glycated sample (the above step). Afterward, the absorbance of samples was determined at 10- and 15-minute time points at 530 nm using an enzyme linked immunosorbent assay (ELISA) reader (ELX 800, Bio-Tek Inst.).
3.4. Determination of Protein Carbonyl Content and Thiol Group
Carbonyl contents of glycated BSA, a marker for protein oxidative damage, were determined, according to a previously published method (13) using 2, 4-Dinitrophenylhydrazine (DNPH). The carbonyl content of each sample was calculated based on the extinction coefficient of DNPH (ε = 22,000 M-1cm-1). The results are presented as nmole carbonyl/mg protein. The thiol group was determined based on Ellman’s method using DTNB with slight modifications (13). The absorbance of samples was determined at 410 nm using a spectrophotometer (JENWAY 6105 UV/Vis). Finally, the free thiol concentration of samples was determined using L-cysteine (0.015-0.50 mM) as a standard and expressed as nmol/mg protein (13).
3.5. Experimental Animals and Design
Male Wistar rats weighting 200 - 220 grams were used in this study. All animals were kept at the animal house of Hamadan University of Medical Sciences (Iran). The rats were kept in standard cages under normal condition of 12/12 hour (light/dark period) with relative humidity of 56 ± 3%. After one-week adaptation in an animal house, they were divided randomly to six groups of six rats in each group. For induction of type 2 diabetes, 65 mg/kg Streptozotocin (STZ) was injected to rats after 12 hours of fasting. Nicotinamide at a dose of 110 mg/kg was injected intraperitoneally 15 minutes following STZ injection (11). One week later, glucose levels of animals were determined enzymatically and fasting blood glucose level more than 250 mg/dl was considered diabetic (14). The studied groups were as follow: Group 1 contained normal rats that received standard chow diet (control group). Group 2 was diabetic rats that received standard chow diet. Groups 3 and 4 were diabetic rats that in addition to standard diet received 2% and 8% Cinnamon extract (w/w), respectively. Groups 5 and 6 received 2% and 8% of Trigonella foenum extract (w/w). The regimen was continued for 30 days. All processes of the experiments were approved by the animal research ethic committee of Hamadan Azad University (Hamadan, Iran).
3.6. Blood and Liver Biochemical Parameters
On day 30, blood samples were collected by heart puncture from each animal. The serum was separated by centrifugation for 10 minutes at 1500×g. The prepared serum was subsequently used for enzymatic measurement of blood glucose, total cholesterol, high density lipoprotein-cholesterol (HDL-C), triglyceride, alanine aminotransferase (ALT) and aspartate aminotransferase (AST), using commercial kits (Pars Azmun Co. Iran) (15). Very low density lipoprotein cholesterol (VLDL-C) and low density lipoprotein cholesterol (LDL-C) were calculated according to Friedewald’s equation (16).
3.7. Liver Lipids and Glycogen
Liver lipids were determined according to Butler et al. (17). Briefly, one gram of liver tissue was homogenized in chloroform/methanol. After centrifugation, the solvent was washed using 0.9% NaCl. The solution was centrifuged and chloroform phase was used for cholesterol and triglyceride assays with the same enzymatic kit as applied for serum analysis. Liver glycogen was determined according Folch et al. (18) methods. Briefly, 500 mg of liver and equal volume of 10% trichloroacetic acid was added and was homogenized after 30 minutes. The resulting solution was centrifuged. The supernatant was obtained and 95% ethanol was added to the samples. After that, sodium chloride was added and resulting precipitate was dissolved in distilled water. The precipitate was dissolved in ethanol and centrifuged again. The supernatant was discarded and the resulting precipitate was dissolved in absolute ethanol and the solution was dispensed in a glass plate. After evaporation of ethanol, the remaining sediment was collected and weighed. Liver glycogen content of liver was reported as mg to gram tissue.
3.8. Blood Glucose and Glycosylation End Products Assay
Fasting blood glucose (FBS) was measured enzymatically using a commercial kit (Pars Azmun Co.). For determination of AGEs in the kidney and serum, the samples were diluted 1:50 with PBS. Fluorescence intensity was determined at 335 nm excitation and 460 nm emission using a spectrofluorometer (Jasco FP-6200). Fluorescence intensity was expressed as arbitrary units (AU) (13).
3.9. Determination of Oxidative Stress Markers
Malondialdehyde (MDA) level, a marker of lipid peroxidation was measured using the thiobarbituric acid reaction. The results were stated as nmol of MDA/mL of serum. Total antioxidant capacity (TAC) was measured according to a previous published method (19). Thiol group of serum was determined based on Ellman’s method using DTNB with slight modifications according to a previous report (13).
3.10. Enzymes Assay
Cholesterol 7-alpha hydroxylase level and lipase activity were determined using commercial kits (Eastbiopharma Co. and Pars Azmun respectively) and according to the manufacturer's instructions.
3.11. Histopathological Examination
The livers of animals were fixed in 10% formalin solution and processed by standard methods. Briefly, the samples were embedded in paraffin; sections at 5 μm was prepared and stained with haematoxylin and eosin (H&E). The stained slides were evaluated under a light microscope.
3.12. Statistical Analysis
The data in this study are presented as means ± standard error of the mean (SEM). A three-replicate measurement was done in in vitro tests. Statistical analyses were carried out using the SPSS statistical program (SPSS; 16, Inc, USA). One-way analysis of variances (ANOVA) followed by Tukey-test was used for statistical analysis of data. P values of less than 0.05 were regarded as statically significant.
4. Results
4.1. In Vitro Experiments
Trigonella foenum and Cinnamon markedly declined AGEs formation in treated BSA with fructose (Table 1). Cinnamon showed higher effect in this experiment. Interestingly, inhibition of AGEs by Trigonella foenum or Cinnamon at a concentration of 1 and 2 mg/mL was more than that of aminoguanidine (P < 0.05). Our experiment also established that Trigonella foenum and Cinnamon significantly inhibited fructosamine formation (P < 0.05). Major rise in the carbonyl content and also thiol groups oxidation were observed when the BSA solution was incubated in presence of 200 and 500 mM fructose with Trigonella foenum and Cinnamon (Tables 1-2) (P < 0.05).
| Experimental Groups | AGE levels (arbitrary unit) | Fructosamine levels (mmol/ mg protein) | ||||
|---|---|---|---|---|---|---|
| Week 2 | Week 3 | Week 4 | Week 2 | Week 3 | Week 4 | |
| BSA/Fru 500 mM | 113.20 ± 6.66 | 127.24 ± 7.97 | 137.57± 10.15 | 3.22 ± 0.19 | 3.27 ± 0.24 | 3.52 ± 0. 37 |
| +Cinnamon 0.25 mg/mL + TF 0.25 mg/mL | 50.00 ± 6.21b | 54.64 ± 5.23b | 68.23 ± 7.13b | 2.30 ± 0.11b | 2.74 ± 0.03b | 3.10 ± 0.04b |
| 67.12 ± 6.02b | 68.89 ± 6.77b | 70.11 ± 6.24b | 2.55 ± 0.09b | 2.88 ± 0.09b | 3.02 ± 0.09b | |
| + Cinnamon 0.5 mg/mL + TF 0.5 mg/mL | 48.11 ± 5.55b | 51.41 ± 6.01b | 67.76 ± 6.09b | 2.32 ± 0.09b | 2.71 ± 0.08b | 3.08 ± 0.06b |
| 62.17 ± 4.20b | 62.17 ± 4.93b | 66.38 ± 6.96b | 2.46 ± 0.11b | 2.80 ± 0.03b | 3.00 ± 0.08b | |
| + Cinnamon 1 mg/mL + TF 1 mg/mL | 40.46 ± 6.31b | 43.12 ± 5.10b | 58.32 ± 4.91b | 2.23 ± 0.14b | 2.59 ± 0.05b | 2.73 ± 0.13b |
| 66.30 ± 6.87b | 60.55 ± 5.19b | 60.88 ± 5.55b | 2.37 ± 0.12b | 2.76 ± 0.03b | 2.88 ± 0.15b | |
| + Cinnamon 2 mg/mL + TF 2 mg/mL | 39.89 ± 5.15b | 41.31 ± 4.22b | 51.17 ± 4.31b | 2.20 ± 0.10b | 2.07 ± 0.07b | 2.25 ± 0.07b |
| 57.74 ± 6.91b | 54.12 ± 4.07b | 56.43 ± 5.19b | 2.37 ± 0.20b | 2.19 ± 0.08b | 2.37 ± 0.06b | |
| + AG 2 mg/mL | 45.35 ± 4.11b | 47.15 ± 4.49b | 50.20 ± 5.13b | 2.40 ± 0.08b | 2.09 ± 0.14b | 2.40 ± 0. 14b |
| BSA/Fru 200 mM | 108.30 ± 7.30 | 133.54 ± 8.18 | 147.24 ± 5.26 | 2.71 ± 0.11 | 2.84 ± 0.15 | 2.99 ± 0.08 |
| +Cinnamon 0.25 mg/mL + TF 0.25 mg/mL | 48.78 ± 5.471b | 51.09 ± 6.12b | 66.38 ± 6.13b | 2.62 ± 0.07b | 2.62 ± 0.07b | 2.76 ± 0.06b |
| 65.30 ± 6.40b | 66.14 ± 5.11b | 67.47 ± 5.33b | 2.50 ± 0.09b | 2.70 ± 0.12b | 2.88 ± 0.01b | |
| + Cinnamon 0.5 mg/mL + TF 0.5 mg/mL | 44.48 ± 5.62b | 47.38 ± 5.30b | 61.40 ± 5.40b | 2.28 ± 0.06b | 2.56 ± 0.05b | 2.60 ± 0.07b |
| 65.16 ± 5.22b | 66.07 ± 6.20b | 63.36 ± 6.28b | 2.38 ± 0.09b | 2.61 ± 0.06b | 2.74 ± 0.08b | |
| + Cinnamon 1 mg/mL + TF 1 mg/mL | 45.16 ± 4.86b | 45.81 ± 5.27b | 55.54 ± 5.04b | 2.16 ± 0.18b | 2.48 ± 0.10b | 2.51 ± 0.09b |
| 58.31 ± 5.79b | 59.88 ± 5.7b | 60.45 ± 5.60b | 2.20 ± 0.18b | 2.55 ± 0.09b | 2.67 ± 0.02b | |
| + Cinnamon 2 mg/mL + TF 2 mg/mL | 40.11 ± 3.10b | 44.27 ± 5.10b | 48.92 ± 4.71b | 2.09 ± 0.08b | 2.03 ± 0.05b | 2.18 ± 0.07b |
| 53.81 ± 5.22b | 58.78 ± 6.12b | 55.33 ± 5.59b | 2.12 ± 0.14b | 2.30 ± 0.07b | 2.22 ± 0.09b | |
| + AG 2 mg/mL | 50.31 ± 3.26b | 49.75 ± 5.25b | 52.31 ± 5.98b | 2.08 ± 0.08b | 2.11 ± 0.05b | 2.28 ± 0.04b |
| BSA /PBS | 18.10 ± 1.99b | 20.17 ± 5.73b | 23.66 ± 3.10b | 0.35 ± 0.04b | 0.19 ± 0.02b | 0.26 ± 0.03b |
Inhibition of Advanced Glycosylation End Products Formation (arbitrary unit) and Fructosamine Levels (mmol/ mg protein) by Cinnamon and Trigonella foenum at Three Different Treatment Timesa
| Experimental Groups | Thiol Group (nmol /mg Protein) | Carbonyl Content (nmol/mg Protein) | ||||
|---|---|---|---|---|---|---|
| Week 2 | Week 3 | Week 4 | Week 2 | Week 3 | Week 4 | |
| BSA/Fru 500 mM | 1.90 ± 0.08 | 1.59 ± 0.07 | 1.20 ± 0.07 | 2. 8 ± 0.06 | 3.7 ± 0.05 | 3.9 ± 0.02 |
| +Cinnamon 0.25 mg/mL + TF 0.25 mg/mL | 2.21 ± 0.11b | 2.35 ± 0.03b | 1.90 ± 0.05b | 2.18 ± 0.08b | 2.51 ± 0.1b | 2.99 ± 0.08b |
| 2.14 ± 0.11b | 2.23 ± 0.03b | 1.51 ± 0.07b | 2.8 ± 0.08 | 3.31 ± 0.17b | 3.49 ± 0.08 b | |
| +Cinnamon 0.5 mg/mL + TF 0.5 mg/mL | 2.50 ± 0.07b | 2.39 ± 0.08b | 1.80 ± 0.08b | 2.01 ± 0.1b | 2.6 ± 0.09b | 2.9 ± 0.03b |
| 2.39 ± 0.07b | 2.30 ± 0.07b | 1.71 ± 0.10b | 2.61 ± 0.11 | 2.96 ± 0.09b | 3.45 ± 0.13b | |
| + Cinnamon 1 mg/mL + TF 1 mg/mL | 2.49 ± 0.08b | 2.47 ± 0.05b | 1.88 ± 0.06b | 1.9 ± 0.1b | 2.4 ± 0.03b | 2. 8 ± 0.08b |
| 2.40 ± 0.08b | 2.38 ± 0.05b | 1.87 ± 0.08b | 2.2± 0. 11b | 2.88 ± 0.03b | 3.1 ± 0.13b | |
| +Cinnamon 2 mg/mL + TF 2 mg/mL | 2.66 ± 0.05b | 2.51 ± 0.08b | 2.14 ± 0.06b | 1.9 ± 0.06b | 2.2 ± 0.06b | 2.7 ± 0.08b |
| 2.55 ± 0.05b | 2.40 ± 0.10b | 2.05 ± 0.11 b | 2.19 ± 0.06b | 2.7 ± 0.06b | 2.10 ± 0.16b | |
| + AG 2 mg/mL | 2.40 ± 0.08b | 2.27 ± 0.09b | 1.90 ± 0.04b | 2.1 ± 0.1b | 2.2 ± 0.09b | 2.35 ± 0.05b |
| BSA/Fru200 mM | 1.99 ± 0.07 | 1.64 ± 0.04 | 1.32 ± 0.05 | 2.64 ± 0.06 | 2.74 ± 0.08 | 2.38 ± 0.02 |
| +Cinnamon 0.25 mg/mL + TF 0.25 mg/mL | 1.91 ± 0.11 | 2.20 ± 0.02b | 1.93 ± 0.11b | 2.01 ± 0.06 | 2.03 ± 0.10b | 2.95 ± 0.04b |
| 2.21 ± 0.11 b | 2.11 ± 0.05b | 1.85 ± 0.08b | 2.58 ± 0.08 | 2.13 ± 0.15b | 2.90 ± 0.08b | |
| +Cinnamon 0.5 mg/mL + TF 0.5 mg/mL | 2.34 ± 0.08 b | 2.29 ± 0.09b | 2.03 ± 0.06 | 2.00 ± 0.09b | 2.14 ± 0.12b | 2.97 ± 0.05b |
| 2.25 ± 0.07 b | 2.20 ± 0.09b | 1.94 ± 0.06b | 2.45 ± 0.07 | 2.22 ± 0.09b | 1.91 ± 0.02b | |
| +Cinnamon 1 mg/mL + TF 1 mg/mL | 2.59 ± 0.09b | 2.29 ± 0.03b | 2.15 ± 0.08b | 1.88 ± 0.05b | 2.10 ± 0.03b | 2.8 ± 0.04b |
| 2.47 ± 0.10b | 2.30 ± 0.06b | 2.08 ± 0.09b | 2.05 ± 0.10b | 2.06 ± 0.09b | 2.71 ± 0.03b | |
| +Cinnamon 2 mg/mL+ TF 2 mg/mL | 2.61 ± 0.08b | 2.38 ± 0.05b | 2.20 ± 0.05b | 1.80 ± 0.07b | 1.85 ± 0.09b | 2.56 ± 0.13b |
| 2.56 ± 0.06 b | 2.41 ± 0.05b | 2.19 ± 0.04b | 1.91 ± 0.06b | 2.05 ± 0.06b | 2.65 ± 0.08b | |
| +AG 2 mg/mL | 2.65 ± 0.09b | 2.32 ± 0.06b | 2.06 ± 0.04b | 1.56 ± 0.12b | 1.49 ± 0.09b | 2.38 ± 0.05b |
The Effect of Cinnamon and Trigonella foenum Extracts on Thiol Group (nmol /mg protein) and Carbonyl Content (nmol/mg protein) at Three Different Treatment Timesa
4.2. In Vivo Experiments
Table 3 shows the mean of fasting blood glucose (FBS), triglyceride, cholesterol, LDL-C, HDL-C and VLDL-C levels in different studied groups. The levels of total cholesterol, triglyceride, LDL-C and VLDL-C were significantly reduced (P < 0.05) in Trigonella foenum and Cinnamon extract treated animals. Trigonella foenum or Cinnamon also significantly normalized liver enzymes (ALT and AST) in treated diabetic animals (Table 3).
| Biochemical Factors | Diabetes | D+ Cinnamon (2g/100g Diet) | D+ Cinnamon (8g/100g Diet) | D + TF (2g/100g Diet) | D + TF (8g/100g Diet) | Control |
|---|---|---|---|---|---|---|
| Serum | ||||||
| TC, mg/dL | 140.1 ± 4.3 | 121.2 ± 5.2b | 111.3 ± 5.9c | 124.5 ± 4.6b | 119.9 ± 5.2b | 70.3 ± 5.0d |
| TG, mg/dL | 101.2 ± 5.4 | 90.1 ± 4.5 | 70.5 ± 4.6d | 80.8 ± 4.4c | 78.2 ± 2.7b | 68.4 ± 3.9d |
| VLDL-C, mg/dL | 21.1 ± 2.0 | 17.9 ±1.3 | 15.1 ± 1. 6c | 16.5 ± 1.1c | 16.1± 1. 6a | 14.2 ± 1.8d |
| HDL-C, mg/dL | 34.5 ± 3.7 | 45.2 ± 3.4b | 45.4 ± 2.4b | 44.0 ± 4.1b | 49.1 ± 3.0c | 48.8 ± 9.7b |
| LDL-C, mg/dL | 84.8 ± 2.1 | 57.9 ± 2.3b | 27.1 ± 0. 6d | 65.4 ± 4.7b | 54.1 ± 0. 6b | 12.7 ± 2.1d |
| AST U/L | 56.7 ± 5.4 | 41.0 ± 2.9b | 39.2 ± 3.8b | 42.2 ± 3.6b | 44.3 ± 2.8b | 42.2 ± 3.6b |
| ALT, U/L | 63.9 ± 4.6 | 42.8 ± 3.8b | 42.2 ± 3.2c | 45.5 ± 3.1b | 44.6 ± 3.1b | 43.4 ± 2.5b |
| Liver | ||||||
| TC (mg/g tissue) | 8.4± 0.11 | 6.2 ± 0.22c | 4.9 ± 0.34d | 5.2 ± 0.20d | 5.0 ± 0.19d | 4.5 ± 0.18d |
| TG (mg/g tissue) | 9.7± 0.24 | 6.6 ± 0.33c | 5.1 ± 0.28d | 6.1± 0.13d | 5.9 ± 0.23d | 4.9 ± 0.12d |
| Glycogen(mg/g tissue) | 22.8 ± 3.2 | 43.8 ± 2.5d | 55. 0 ±1.5d | 37.7± 2b | 40.0 ± 3.4c | 44.5 ± 3.1d |
Comparison of Biochemical Parameters Among Different Groupsa
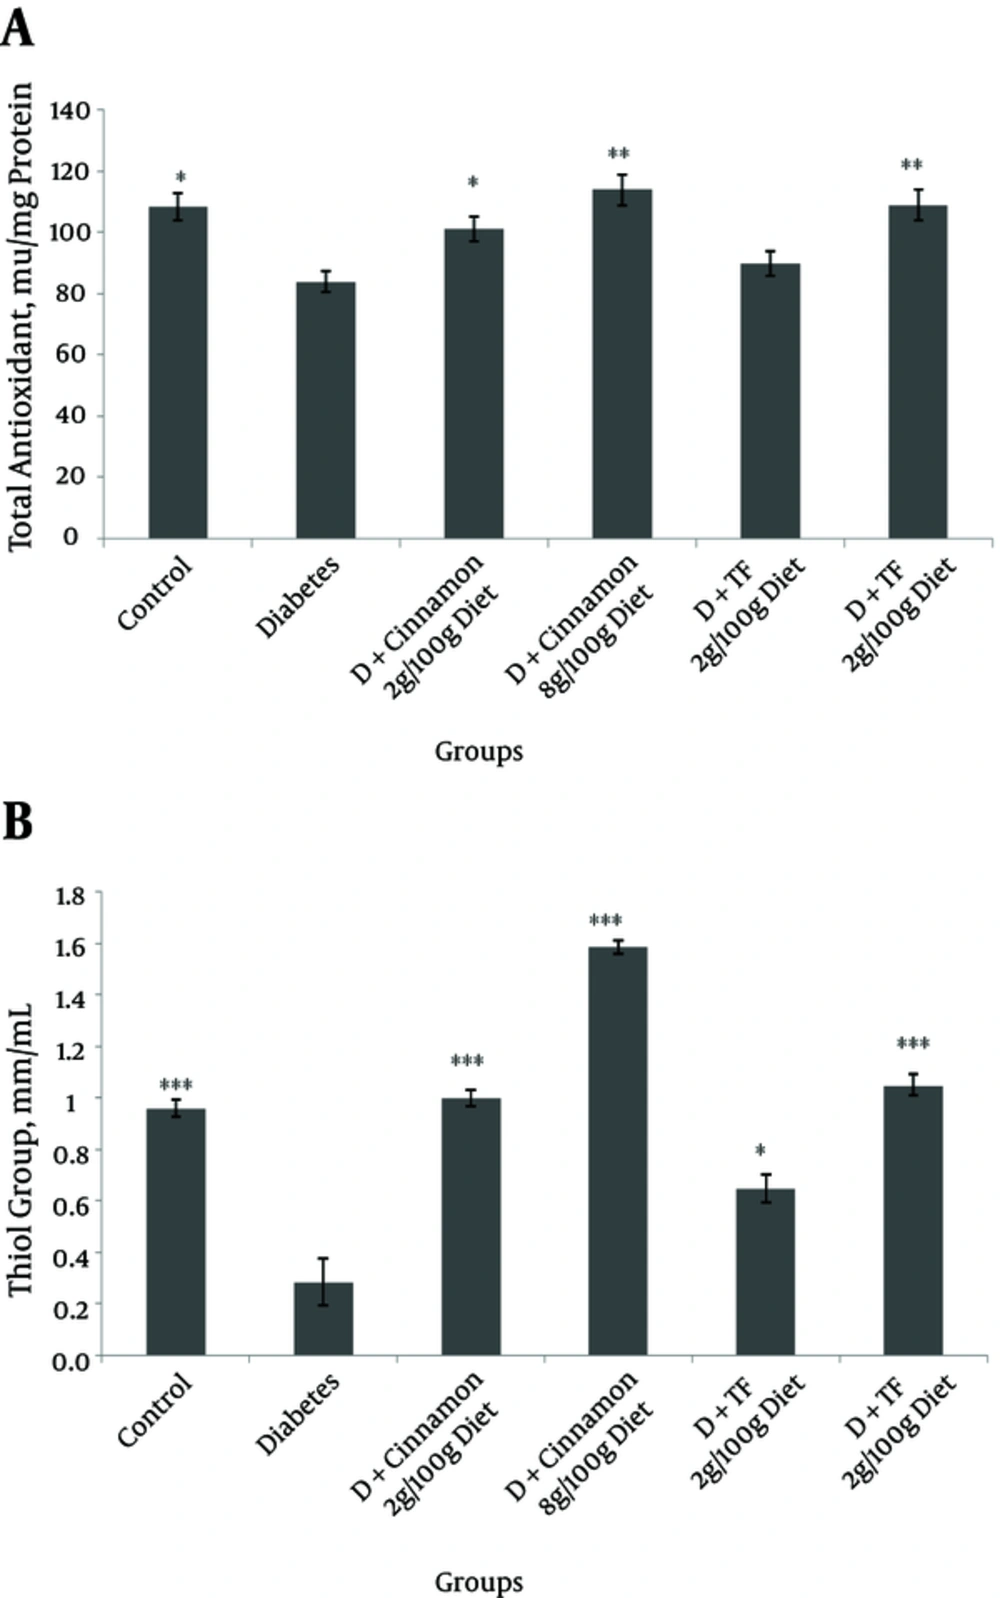
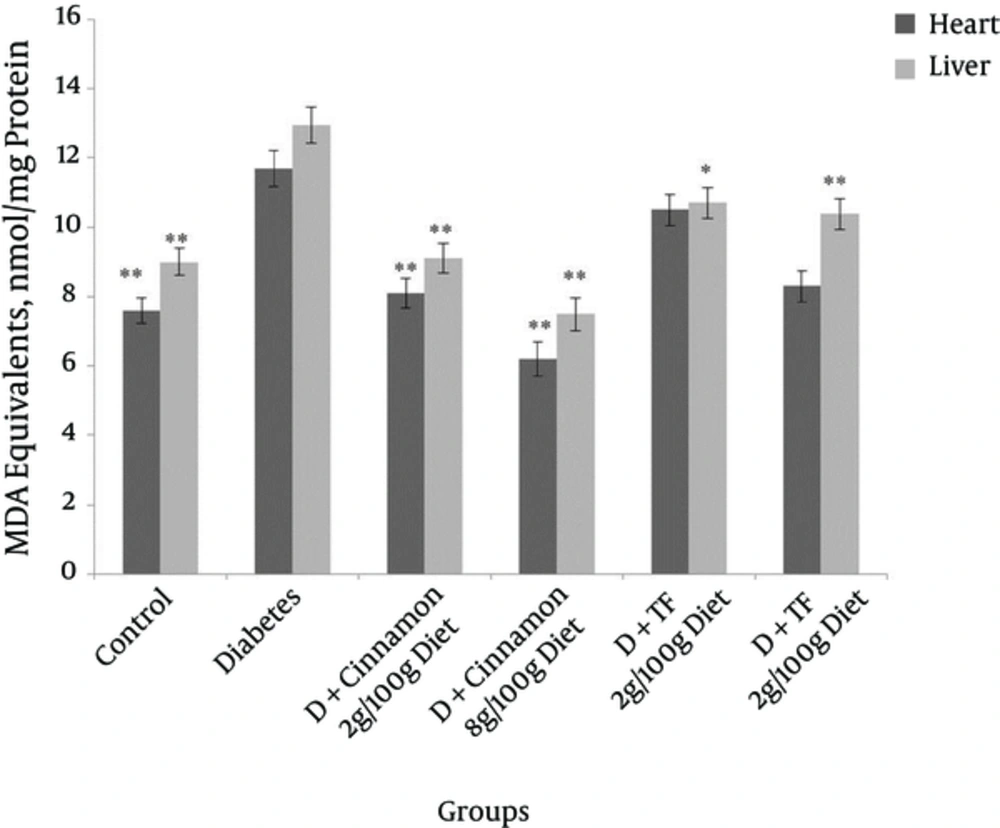
The total antioxidant level and serum thiol groups were significantly (P < 0.05) lower in diabetic animals compared with normal rats (Figure 1). In Trigonella foenum and Cinnamon-treated diabetic rats total antioxidant level was significantly restored (P < 0.05) (Figure 1). On the other hand, MDA levels were significantly reduced in Trigonella foenum and Cinnamon treated rats (P < 0.05, Figure 2).
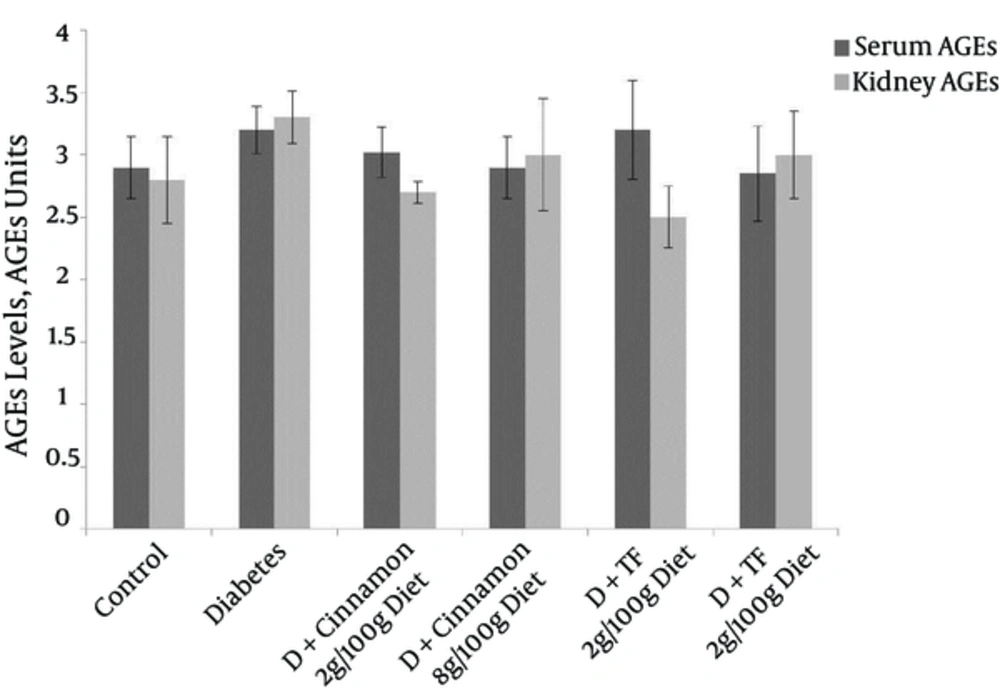
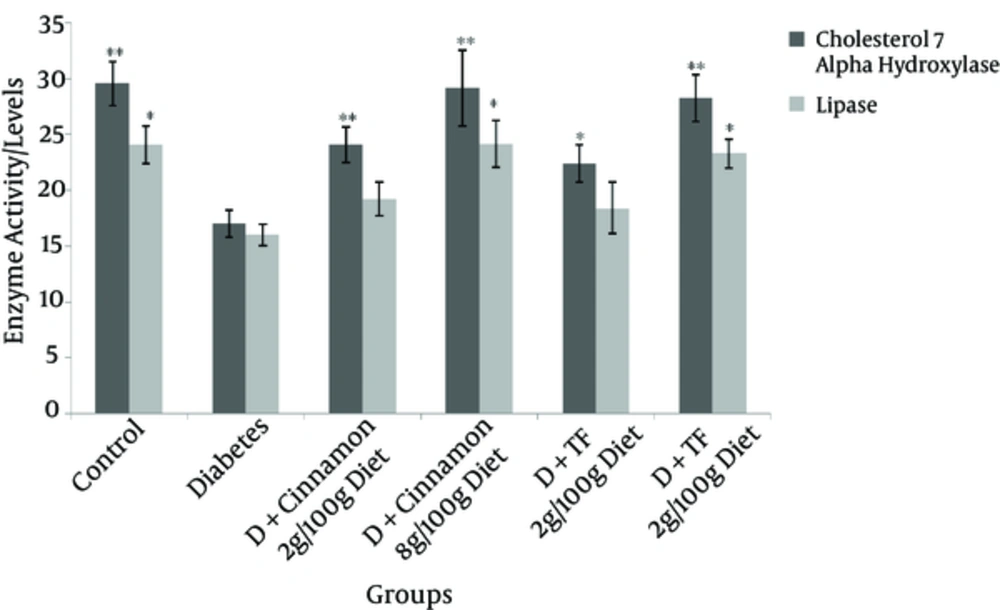
Advanced Glycosylation End Products formation in the serum of different groups is shown in Figure 3. The change of AGEs formation in diabetic animals, which were treated with Trigonella foenum or Cinnamon was not significant compared with diabetic and control rats. Lipase activity was not changed in all treated groups except in the group that was treated with Cinnamon at a dose of 8 g/100g diet. Cholesterol 7-alpha hydroxylase activity was significantly reduced in Trigonella foenum and Cinnamon treated diabetic rats at a dose of 8 g/100g diet (Figure 4).
4.3. Histological Changes
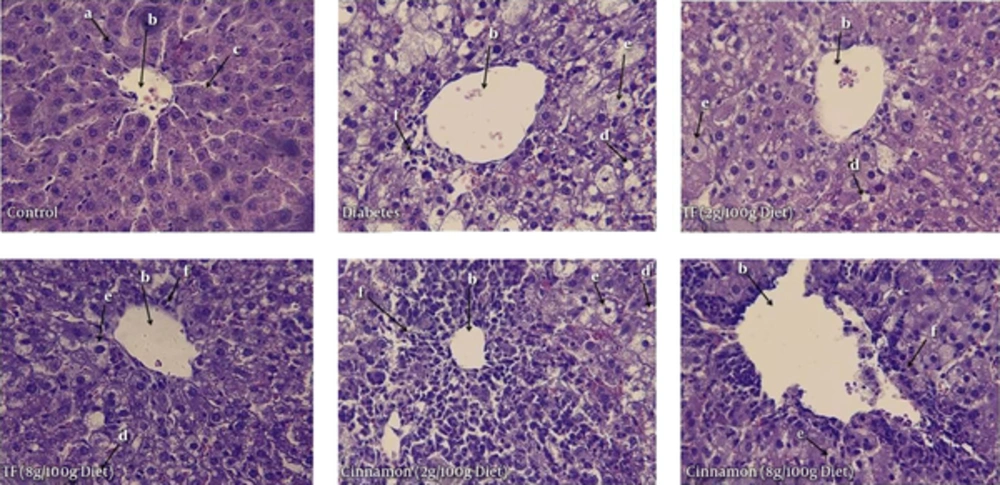
Figure 5 shows the morphological changes in liver of different studied groups. Liver histology in control group showed normal structure including normal cellular construction with portal triad, numerous hepatocytes (a), lining sinusoidal (c) and central vein (b). As shown in Figure 5 accumulation of lipid (d) and foam cell (e) and infiltrations of inflammatory cells (f) in liver were obviously observed in diabetic rats and treated diabetic rats with dose of 2 g/100g diet of Trigonella foenum or Cinnamon; while, lipid accumulation was normalized by the dose of 8 g/100g diet. Liver of diabetic rats also exhibited cellular abnormalities with area of necrosis, mild fibrosis, cellular degeneration, vascular degeneration and congestion, and also infiltrations of inflammatory cells when compared with control rats. Treatments of diabetic animals with Trigonella foenum or Cinnamon at the dose of 8 g/100g diet normalized these changes. These changes were slightly restored with Trigonella foenum or Cinnamon at a dose of 2 g/100g diet (Figure 5).
5. Discussion
Recent meta-analysis studies indicated the useful properties of natural products in the management of diabetes and related complications (20). This study showed the effects of Cinnamon on triglyceride, total cholesterol, LDL-C and blood glucose reduction in an animal model of type 2 diabetes.
Vanschoonbeek et al. (6) reported that administration of Cinnamon at a dose of 1.5 g/d did not normalize lipid profile, insulin sensitivity and oral glucose tolerance in postmenopausal patients of type 2 diabetes. Whereas, Khan et al. (7) with administration of 1, 3, or 6 g of Cinnamon per day in 60 people with type 2 diabetes showed that blood glucose levels, total cholesterol, triglyceride and LDL-C were significantly reduced. Differences between the studies of Vanschoonbeek et al. (6) and Khan et al. (7) could be attributed to the different patients (males or females), and the type and dose of medicine. On the other hand, Crawford et al. (8) showed that daily supplementation of 1g Cinnamon for three months was safe and led to reduction of blood glucose and HbA1C levels in type 2 diabetics. In our study, diabetic rats, which were treated with high dose of Cinnamon and Trigonella foenum (8 g of Cinnamon or Trigonella foenum /100g diet) lipid profile, blood glucose and liver enzymes were normalized. In the animals which were treated with 2 g of Cinnamon or Trigonella foenum /100g diet, the change in lipid profile and liver enzymes were not significant. The results of previous experiments showed that treatment of diabetic rats with Cinnamon significantly reduced blood glucose, total cholesterol, triglyceride, LDL-C and VLDL-C (7, 9, 21).
The results of the study of Sharma et al. (10) showed that administration of 100 g Trigonella foenum powder/day for 21 days in dyslipidemic patients, significantly reduced triglyceride, total cholesterol, LDL-C and VLDL-C levels.
There was a report that showed treatment of type 1 and 2 diabetics patients with Trigonella foenum reduced total cholesterol, LDL-C, blood glucose and improved insulin resistance (22, 23). However, the hypoglycemic and hypolipidemic mechanism of this plant is unknown so far. In the recent study, Trigonella foenum significantly reduced AGEs and fructosamine formation. This plant also reduced protein carbonyl contents and thiol group oxidation in a dose-dependent manner. Therefore, inhibition of AGEs formation is one of the proposed antidiabetic mechanisms by Trigonella foenum. Vijayakumar et al. (24) reported that Trigonella foenum reduced blood lipid by suppression of fat accumulation and also up-regulated of LDL-receptor expression. On the other hand, hypoglycemic and hypolipidemic mechanisms of Cinnamon are not yet completely clear. In this study, Cinnamon extract suppressed in vitro AGEs formation, which is involved in diabetic complications.
A previous study showed that Cinnamon motivated insulin receptor kinase and suppressed dephosphorylation of the insulin receptor, leading to maximal phosphorylation of the insulin receptor (7). Maximal phosphorylation of this receptor leads to increase in insulin activity; consequently normalization of blood lipid and glucose levels. It has been reported that Cinnamon motivated the activity of glycogen synthase enzymes and increased uptake of glucose from blood circulation. All of these properties can lead to increase in insulin sensitivity and glucose reduction (7).
Lee et al. (25) proved that prescription with Cinnamon in hyperlipidemic animals markedly declined total cholesterol concentration via suppression of hepatic hydroxyl methylglutaryl-coenzyme A (HMG-CoA) reductase, the rate-limiting enzyme of cholesterol biosynthesis.
It has been shown that about 80% of the LDL-C uptake is through LDL-receptor that consequently reduces blood cholesterol (7). We recently showed that Cinnamon and Trigonella foenum at a high dose significantly increased LDL-receptor gene expression (unpublished data). Several experiments have indicated that increasing the activity of cholesterol 7-alpha hydroxylase could decline the plasma total cholesterol by increasing the conversion of cholesterol to bile acids (26). In our study, cholesterol 7-alpha hydroxylase activity was significantly reduced by Cinnamon and Trigonella foenum at a dose of 8 g /100g diet. In this study we established that Cinnamon and Trigonella foenum extracts also have potential antioxidant activity, which would lead to further useful effects such as hypoglycemic and liver regeneration properties.
Triglyceride and cholesterol accumulation in liver tissues were noticeably observed in diabetic animals (27). The obtained data indicated an accumulation in lipid content of liver (triglyceride and cholesterol) in diabetic rats that was significantly reduced after treatment with Cinnamon or Trigonella foenum extract diet.
It is well known that STZ-induced diabetes in animals led to cytotoxicity and disruption of pancreatic β cell membrane (27). In the treated diabetic groups, morphological changes and liver enzyme were significantly normalized.
5.1. Conclusion
The results of this study indicated that administration of Cinnamon and Trigonella foenum extract in STZ-induced diabetic rats normalized dyslipidemia. These herbal medicines also showed potential antiglycation activity in vitro. Increasing the activity of cholesterol 7-alpha hydroxylase following treatment with these plants is another new possible mechanism for their hypolipidemic properties. Also, the liver antioxidants significantly increased and the histopathological changes were normalized in diabetic animals treated by Cinnamon and Trigonella foenum extract. Hence, these herbal medicines are suggested to be used as anti-diabetic agents; however more studies on human subjects are required.

