


1. Background
Oliveria decumbens Vent., a member of the Umbelliferae family, is a shrub commonly found in the south-east of Iran. In traditional medicine, its aerial part was used for treating indigestion, diarrhea, abdominal pains, and fever (1). According to recent studies, it can be used as an antibacterial (2), antifungal (3), antioxidant (4), and antimicrobial agent (1). These properties are influenced by quantity and quality of their secondary metabolites, which are usually produced under the influence of special environmental and climatic conditions. Therefore, the identification of the best environmental and climatic conditions is necessary.
A study on Thymus vulgaris showed that environmental conditions influenced essential oil composition (5). The study on chemical composition of essential oils and methanolic extracts of Thymus mastichina populations indicated that the total phenol contents of the methanolic extracts varied between 2.90 and 9.15 mg GAE/g extract. Also, the oil yields varied between 2.27 and 6.48 mL/100 g DM. This difference seems to be related to the different environmental conditions (6). The investigation on Lavandula × intermedia from ten regions of Zagros regions of Iran showed significant differences for essential oil content and composition due to differences in environmental conditions (7). In another study, the essential oil content of Thymus pubescens had a significant positive relationship with soil pH and also a significant negative relationship with altitude (7). The major environmental factors had a significant effect on essential oil of Verbascum songaricum. It’s essential oil content was increased under semi-arid cold climate, uplands, higher precipitation, relatively light texture, and fertile soil (8).
2. Objectives
Climate variation and altitude changes affect essential oil biosynthesis and accumulation in medicinal herbs. Therefore, evaluation of the effects of different climatic conditions on plants is important. Since, there is no published and comprehensive research related to the effect of different climatic conditions on O. decumbens, the present study was carried out to explore the effects of macro environmental factors on phytochemical changes of O. decumbens.
3. Methods
3.1. Geographical Characteristics of Habitats
According to a pervious study, natural habitats of Oliveria decumbents were identified (9). The locations characteristics are shown in Table 1.
| Population No. | Province | Region | Latitude, N | Longitude, E | Altitude, m | MDT, °C | MDRH, % | MPM, mm | MEM, mm | MSM, h | Climate |
|---|---|---|---|---|---|---|---|---|---|---|---|
| 1 | Kermanshah | Soomar | 33°55'03.6"N | 45°47'18.3"E | 500 | 25.63 | 41 | 20.36 | 219 | 256 | Warm and dry |
| 2 | Kermanshah | Qasr-e Shirin | 34°29'02.9"N | 45°34'27.4"E | 345 | 24.59 | 40 | 30.25 | 218 | 259 | Warm and dry |
| 3 | Kermanshah | SarpolZahab | 34°26'29.8"N | 45°53'45.6"E | 609 | 20.39 | 47 | 35.48 | 184 | 247 | Warm and dry |
| 4 | Ilam | Bedreh | 33°16'27.5"N | 47°09'23.3"E | 896 | 22.58 | 43 | 17.41 | 132 | 242 | Warm and dry |
| 5 | Ilam | Dehloran | 32°46'39.7"N | 47°02'09.5"E | 365 | 26.76 | 44 | 22.50 | 194 | 245 | Warm and dry |
| 6 | Ilam | Abdanan | 33°00'39.2"N | 47°23'45.9"E | 981 | 23.18 | 41 | 45.71 | 142 | 243 | Warm and dry |
| 7 | Ilam | DarrehShahr | 33°04'40.0"N | 47°30'07.0"E | 655\ | 22.58 | 41 | 34.25 | 141 | 241 | Warm and dry |
| 8 | Khuzestan | Dezful | 32°21'56.6"N | 47°57'59.0"E | 196 | 24.41 | 45 | 32.27 | 217 | 258 | Warm and semi-humid |
| 9 | Khuzestan | Behbahan | 30°39'19.9"N | 50°12'45.5"E | 302 | 25.00 | 43 | 34.25 | 221 | 261 | Warm and semi-humid |
| 10 | Khuzestan | Fedelak | 32°05'25.5"N | 48°53'24.9"E | 236 | 27.88 | 44 | 25.06 | 209 | 256 | Warm and semi-humid |
| 11 | Khuzestan | Perchestan | 32°03'13.6"N | 48°55'13.7"E | 165 | 27.88 | 44 | 25.06 | 209 | 256 | Warm and semi-humid |
| 12 | Khuzestan | Lali | 32°19'07.1"N | 49°05'24.5"E | 359 | 26.73 | 41 | 32.75 | 219 | 252 | Warm and semi-humid |
| 13 | Khuzestan | MasjedSoleyman | 32°00'56.0"N | 49°13'37.5"E | 275 | 25.73 | 39 | 35.50 | 218 | 255 | Warm and semi-humid |
| 14 | Khuzestan | KuhZar | 32°05'14.3"N | 48°57'12.5"E | 109 | 27.07 | 43 | 22.79 | 207 | 257 | Warm and semi-humid |
| 15 | Fars | Jahrom1 | 28°29'39.8"N | 53°35'59.0"E | 1104 | 23.42 | 47 | 19.40 | 219 | 279 | Warm and dry |
| 16 | Fars | Jahrom 2 | 28°38'20.0"N | 53°37'26.5"E | 1021 | 23.42 | 47 | 19.40 | 219 | 279 | Warm and dry |
| 17 | Fars | Kazerun 1 | 29°36'24.2"N | 51°34'32.7"E | 874 | 24.38 | 42 | 29.46 | 255 | 267 | Warm and semi-humid |
| 18 | Fars | kazerun 2 | 29°39'46.1"N | 51°37'00.3"E | 895 | 24.38 | 42 | 29.46 | 255 | 267 | Warm and semi-humid |
| 19 | Fars | DoshmanZiari | 30°06'51.0"N | 52°21'39.6"E | 1699 | 18.31 | 40 | 39.33 | 172 | 274 | Warm and semi-humid |
| 20 | Fars | Nourabad | 30°04'49.6"N | 51°32'48.9"E | 981 | 23.10 | 48 | 39.49 | 196 | 251 | Warm and semi-humid |
| 21 | Fars | Ghaemiyeh | 29°51'45.6"N | 51°34'56.7"E | 913 | 21.96 | 46 | 26.95 | 211 | 257 | Warm and semi-humid |
| 22 | Lorestan | Kuhdasht | 33°33'06.6"N | 47°32'34.8"E | 1260 | 16.62 | 48 | 31.39 | 157 | 245 | Moderate and dry |
| 23 | ChaharMahal VaBakhtiari | Lordegan | 31°31'14.8"N | 50°46'00.3"E | 1556 | 16.36 | 51 | 45.96 | 132 | 264 | Moderate and dry |
| 24 | Bushehr | Borazjan | 29°21'20.2"N | 51°16'56.8"E | 146 | 26.66 | 43 | 19.02 | 246 | 257 | Warm and humid |
| 25 | Hormozgan | Geno | 27°24'00.6"N | 56°14'05.9"E | 653 | 27.32 | 53 | 14.51 | 259 | 270 | Warm and humid |
Abbreviations: MDT, mean day temperature; MDRH, mean day relative humidity; MEM, mean evaporative per month; MPM, mean precipitation per month; MSM, mean sun hour per month.
3.2. Metrological Characteristics of Habitats
The climatic characteristics were determined using the nearest meteorological stations. The type of climate classification of each region was indicated according to the coefficient of temperance method (Temoenatenus Index) (Table 1).
3.3. Soil Characteristics of Habitats
The soil samples were taken from the root depth of plants and their physicochemical properties were determined (Table 2). The total nitrogen (N), phosphorus (P), and potassium (K) were determined using the Kjeldahl procedure, Olsen method, and a flame photometer, respectively. The total neutralizing value (TNV %) by neutralization with HCl and the organic matter (OM%) by titration method were measured (10).
| Population No | P (Av.), ppm | K (Av.), ppm | N, % | OM, % | TNV, % | EC, dS/m | pH | Sand, % | Clay, % | Silt, % |
|---|---|---|---|---|---|---|---|---|---|---|
| 1 | 3.4 | 141 | 0.17 | 0.41 | 41.1 | 2.1 | 8.2 | 33 | 30 | 37 |
| 2 | 24 | 548 | 0.73 | 0.87 | 7.7 | 0.48 | 6.9 | 22 | 33 | 45 |
| 3 | 9.7 | 280 | 0.15 | 1.3 | 48 | 0.52 | 7.3 | 25 | 30 | 45 |
| 4 | 13.4 | 400 | 0.25 | 0.46 | 15 | 0.63 | 7.42 | 52.3 | 20.7 | 27 |
| 5 | 14.3 | 435 | 0.3 | 1.3 | 18 | 0.6 | 7.28 | 25.4 | 38.7 | 35.9 |
| 6 | 12.2 | 324 | 0.21 | 0.21 | 10 | 0.59 | 7 | 20.3 | 39.7 | 40 |
| 7 | 27 | 650 | 0.84 | 1.6 | 8 | 0.5 | 7.1 | 17 | 35 | 48 |
| 8 | 11 | 107 | 0.74 | 1.12 | 11 | 5.27 | 7.1 | 58.16 | 13.48 | 28.36 |
| 9 | 2 | 231 | 0.27 | 1.1 | 8 | 0.43 | 6.2 | 3 | 47 | 50 |
| 10 | 7 | 106 | 0.4 | 0.61 | 8.3 | 0.92 | 6.8 | 5 | 43.5 | 51.5 |
| 11 | 9 | 342 | 0.78 | 2.3 | 9 | 0.63 | 7.1 | 30.2 | 31 | 37.8 |
| 12 | 11 | 112 | 0.41 | 0.84 | 7 | 1.4 | 6.9 | 37.4 | 20 | 42.6 |
| 13 | 5 | 320 | 0.25 | 1.11 | 6 | 0.21 | 5.95 | 5 | 49 | 46 |
| 14 | 8.4 | 121 | 0.38 | 0.73 | 8 | 0.86 | 6.9 | 41.9 | 17.2 | 40.9 |
| 15 | 6.8 | 345 | 0.42 | 0.2 | 21.3 | 0.16 | 7.7 | 54.1 | 10.6 | 35.3 |
| 16 | 6 | 261 | 0.62 | 1.7 | 31 | 1.78 | 7.8 | 19 | 9 | 72 |
| 17 | 3 | 374 | 0.48 | 2.5 | 34 | 5.13 | 8.9 | 46.7 | 20.6 | 32.7 |
| 18 | 6 | 275 | 0.57 | 0.35 | 32 | 3.78 | 7.9 | 52 | 10.8 | 37.2 |
| 19 | 5.6 | 311 | 0.53 | 0.8 | 37 | 0.05 | 7.8 | 8.7 | 51.3 | 40 |
| 20 | 6.1 | 342 | 0.46 | 0.53 | 42 | 0.1 | 7.9 | 51.5 | 11.8 | 36.7 |
| 21 | 12.4 | 321 | 0.62 | 1 | 56 | 0.2 | 7.7 | 58.2 | 3.8 | 38 |
| 22 | 6.107 | 215 | 0.11 | 0.34 | 9 | 0.48 | 7.3 | 40.3 | 30.5 | 29.2 |
| 23 | 8.8 | 288 | 0.102 | 0.89 | 30.75 | 0.222 | 7.95 | 24.13 | 31.2 | 44.67 |
| 24 | 6.6 | 135 | 0.91 | 0.43 | 59 | 4.9 | 7.9 | 54.7 | 12.6 | 32.7 |
| 25 | 5 | 175 | 0.21 | 1.51 | 37 | 0.52 | 8.32 | 61 | 7 | 32 |
Abbreviations: EC, electrical conductivity; K, potassium; N, total nitrogen; OM, organic matter; P, phosphorus; pH, potential of hydrogen; TNV%, total neutralizing value.
3.4. Plant Collection
In all habitats, area l parts of O. decumbens in the flowering stage were taken by a random-systematic method along with the located transects. This plant was identified and recorded by Seed Bank of Medicinal Plants Institute, ACECR (1364-MPISB). Four plants were collected from each transect between mid-June to mid-August, 2015. The samples were then dried in shaded areas at room temperature.
3.5. Essential Oils Extraction
The Essential Oil (EO) was obtained by hydrodistillation method for three hours, using Clevenger apparatus, according to the pharmacopoeia (11). Then, essential oil content (%) was measured based on mass of essential oil (g) extracted from 50 g mass of dried aerial part (g) using the following formula (12).
3.6. Gas Chromatography
Analytical gas chromatography (GC) was performed using a Younglin Acme6000 gas chromatograph equipped with BP-5 column 30 m, 0.25 mm internal diameter, and 0.25 µm film thickness. The column temperature program was set as follows: Oven temperature was held at 50°C for five minutes, from 50 to 240°C at a rate of 3°C/min and to 300°C at a rate of 15°C/min and held at this temperature for three minutes. Injection and detection temperature was 290°C and 300°C, respectively. Helium was used as carrier gas with a linear velocity of 0.8 mL/min. All samples were diluted 1:100 by the N-Hexane solvent. One microliter of the diluted sample was injected manually in the split mode 1:25 (13).
3.7. Gas Chromatography-Mass Spectroscopy
The gas chromatography-mass spectroscopy (GC-MS) analyses were carried out with the Agilent 6890 system equipped with a Mass-Spectrometer Agilent 5973, as a detector and a BPX5 column (30 m, 0.25 mm internal diameter, and 0.25 µm film thicknesses). The carrier gas was helium at a flow rate of 0.5 mL/min. The column temperature was held at 50°C for five minutes, and was gradually increased from 50 to 240°C with a rate of 3°C/min and to 300°C with a rate of 15°C/min and held at this temperature for three minutes. For detection, an electron ionization system was used with ionization energy of 70 Electron Volt. The injector and ionization source temperatures were 290 and 220°C, respectively. One microliter of the sample was injected manually in the split mode 1:25 (13).
3.8. Identification of Components
The identification of the constituents was based on the comparison of the Kovats Indices (KI) to n-alkanes (C8-C20) and (C20-C40) and mass spectra of authentic samples with library data of the GC-MS system and the literature data. Relative percentages of the identified compounds were obtained by the electronic integration of the FID peak areas.
3.9. Statistical Analysis
At first, the macro environmental factors were indicated by Principal Components Analysis (PCA), and correlations between these factors were calculated based on Pearson correlation coefficient by the Minitab software. As a result, the most important environmental factors and how they influenced the production of main essential oil component were identified.
4. Results
4.1. Essential Oil Content and Composition
The essential oil content in dry plant materials ranged between 2.25% and 6%. The minimum and maximum content of essential oil of O. decumbens populations were obtained in kazerun 2 (2.25%) and Fedelak (6%) populations, respectively. The results obtained from GC and GC-MS analyses of the oils showed that the main compounds were thymol, carvacrol, p-cymene, and y-terpinene. The highest and the lowest values of thymol were observed in Kuhdasht (43.9%) and Fedelak (0%) populations, respectively. However, carvacrol content was differentially influenced by these two populations and its highest and lowest values were detected in Fedelak (35.98%) and Kuhdasht (0%) populations, respectively (Table 3).
| Component | KI Book | KI Calculated | Population No. | ||||||||||||||||||||||||
|---|---|---|---|---|---|---|---|---|---|---|---|---|---|---|---|---|---|---|---|---|---|---|---|---|---|---|---|
| 1 | 2 | 3 | 4 | 5 | 6 | 7 | 8 | 9 | 10 | 11 | 12 | 13 | 14 | 15 | 16 | 17 | 18 | 19 | 20 | 21 | 22 | 23 | 24 | 25 | |||
| a-Pinene | 939 | 935 | 0.13 | 0.06 | 0.12 | 0.12 | 0.11 | 0.28 | 0.28 | 0.38 | 0.21 | 0.07 | 0.18 | 0.13 | 0.19 | 0.21 | 0.20 | 0 | 0.20 | 0.21 | 0.16 | 0 | 1.42 | 12 | 0.18 | 3.53 | 3.11 |
| p-Cymene | 1025 | 1031 | 15.3 | 14.8 | 15 | 13.71 | 14.2 | 12.16 | 14.4 | 11.9 | 13.08 | 14.50 | 15.02 | 16.29 | 12.35 | 17.60 | 9.02 | 7.81 | 14.44 | 12.8 | 18.67 | 12.3 | 13.2 | 11 | 18.81 | 17.52 | 14.48 |
| Limonene | 1029 | 1034 | 3.12 | 1.08 | 3.11 | 3 | 0 | 3.08 | 2.86 | 2.99 | 2.39 | 1.30 | 2.88 | 3.21 | 4.06 | 0 | 3.70 | 0.65 | 2.81 | 0 | 2.84 | 1.64 | 3.1 | 3.4 | 2.67 | 4.88 | 4.11 |
| y-Terpinene | 1060 | 1063 | 19.8 | 16.21 | 18.2 | 0 | 16.33 | 0 | 0 | 12.8 | 0 | 0 | 0 | 0 | 4.92 | 0 | 0 | 16.34 | 0 | 8.99 | 21.8 | 13.68 | 6.78 | 22.9 | 24.1 | 0 | 0 |
| Thymol | 1290 | 1295 | 28.3 | 30.64 | 28 | 27.18 | 32.9 | 28.15 | 28 | 36.9 | 29.67 | 0 | 28.00 | 29.45 | 28.03 | 24.56 | 31.48 | 39.82 | 27.92 | 26.9 | 21.4 | 38.7 | 34.7 | 43.9 | 22.01 | 25.3 | 27.22 |
| Carvacrol | 1299 | 1305 | 28.8 | 29 | 28.8 | 25.72 | 31.7 | 26.45 | 28.7 | 23.2 | 27.88 | 35.98 | 26.89 | 27.87 | 26.27 | 24.14 | 29.31 | 28.56 | 26.25 | 27.54 | 10.21 | 25.23 | 26.1 | 0 | 11 | 28.9 | 28.11 |
| Myristicin | 1519 | 1539 | 3.61 | 3.67 | 3.23 | 3.87 | 0.6 | 3.72 | 3.78 | 11.38 | 3.21 | 3.961 | 5.62 | 5.64 | 17.99 | 9.05 | 6.09 | 0.63 | 7.3019 | 7.13 | 20.9 | 5.72 | 6.36 | 2.9 | 19.9 | 8.4 | 7.57 |
| Essential oil, % | - | - | 4.1 | 3.4 | 3.9 | 3.45 | 4.3 | 3.76 | 3.35 | 5.21 | 3.9 | 6 | 5.53 | 5.93 | 2.95 | 4.65 | 3.62 | 3.45 | 3.2 | 2.25 | 4.1 | 3.78 | 3.8 | 3.31 | 3.66 | 3.2 | 3.54 |
4.2. Important Environmental Factors Based on PCA
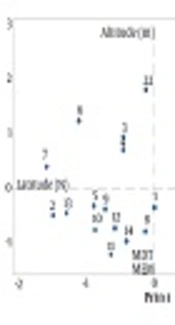
Based on Principal Components Analysis (PCA), Latitude (N), Longitude (E), Altitude, Mean Day Temperature (MDT), mean evaporative per month of Class A pan evaporation (MEM), soil pH, and clay (%) were major environmental factors that had significant effects on essential oil content and composition (Figure 1).
 based on environmental parameters")
Principle Component Analysis (PCA) based on environmental parameters
4.3. Correlation Between Environmental Factors and Essential Oil Composition
The significant correlation between two variables were determined by P values greater than 0.05. Among the principal factors, only altitude showed a significant relationship with essential oil content, however, it was negative (Table 4). Therefore, essential oil content of O. decumbens increased in some regions by decreasing the elevation. Correlation analysis showed that thymol content had not significant correlation with selected environmental factors. In contrast, significant correlations between carvacrol content with MDT (0.788) and MEM (0.454) were observed. Carvacrol content had a significant negative correlation with altitude (-0.632).
| Variables | MDT, C | MEM, mm | Latitude, N | Longitude, E | Altitude, m | pH | Clay, % | Thymol, % | Carvacrol, % |
|---|---|---|---|---|---|---|---|---|---|
| MEM, mm | 0.634a | ||||||||
| Latitude, N | -0.115 | -0.544a | |||||||
| Longitude, E | 0.026 | 0.437a | -0.972a | ||||||
| Altitude, m | -0.830a | -0.449a | -0.265 | 0.355 | |||||
| pH | -0.206 | 0.215 | -0.497a | 0.452a | 0.487a | ||||
| Clay, % | -0.121 | -0.405a | 0.522a | -0.457a | -0.031 | -0.547a | |||
| Thymol, % | -0.269 | -0.005 | -0.057 | 0.025 | 0.175 | 0.110 | -0.391 | ||
| Carvacrol, % | 0.788a | 0.454a | -0.079 | -0.033 | -0.632a | -0.125 | -0.146 | -0.302 | |
| Essential oil, % | 0.368 | -0.020 | 0.266 | -0.232 | -0.412a | -0.312 | 0.155 | -0.341 | 0.181 |
Abbreviations: MDT, mean day temperature; MEM, mean evaporative per month; pH, potential of hydrogen.
a Values are significant (α < 0.05).
5. Discussion
5.1. Essential Oil Content
According to the current results, there was a significant negative correlation between essential oil content and altitude (Table 4). The findings revealed that the essential oil content of O. decumbens was increased by decreasing altitude. Therefore, the highest amounts of essential oils were observed in Khuzestan province populations, where the altitude was lower than others. At higher altitudes, decreased CO2 partial pressure negatively influenced net photosynthetic rate (14), which could influence essential oil content. High altitudes induced UV-B radiation stress, which mainly influences the production of phenolic compounds to absorption and/or dissipation of solar energy (15). Furthermore, these differences in EO may be the result of either uncontrolled biotic and abiotic elicitations or of inherent genetic differences. The current results are in line with the results of previous studies on different medicinal plants (7, 16).
5.2. Essential Oil Compounds
In this study, there was a non-significant correlation between some environmental factors and thymol content. The study on Thymus kotschyanus revealed that thymol content was not influenced by changes in altitude (17). Variations in the relative amounts of these compounds under different environmental conditions indicate their adaptively ecological value. According to the current results, it seems that thymol is more stable in different geographical conditions and more affected by genetic factors.
Carvacrol content is positively correlated with MDT and MEM, yet there was a strong negative relationship between carvacrol and location altitude. In this study, content of carvacrol was reduced with increasing altitude. Therefore, differences in the relative quantities of carvacrol in O. decumbens populations originated from locations with high MDT, and MEM may be a defense mechanism to extreme temperatures.
Previous studies indicated that meteorological conditions could inhibit or stimulate the synthesis of carvacrol (18-21). The carvacrol content is positively correlated with aridity in Thymus piperella chemotype (18), while a progressive increase of temperature and decrease of humidity was accompanied by a progressive decrease in carvacrol and thymol in T. numidus. Also, temperature differentially influenced percentages of monoterpenic phenols in Origanum vulgare, Origanum majorana, and Origanum syriacum. The increase of temperature was accompanied by an increase of carvacrol, while decrease of temperature was associated with an increase of thymol (20). Similar results were also reported by Vaiciulyte et al. (21) on Thymus pulegioides plants. Homer et al. (22) suggested that a plant’s ability to synthesize phytochemicals may be the result of selective pressure and further variability in chemotypes may reflect different selective pressure in different areas.
Previously, the study on Thymus vulgaris chymotypes indicated that carvacrol content increased with decreasing altitude (5). In accordance with the current results, Jamshidi et al. (17) found that carvacrol content of Thymus kotschyanus was reduced by increasing altitude. The relationship between the essential oil components and habitat altitude of Thymus pubescens in East Azarbaijan province revealed that the carvacrol content had a negative correlation with altitude yet it was not significant (7).
In this study, there was a positive correlation between MEM and carvacrol. In a study on chemotype of wild oregano (Origanum vulgare), it was found that they accumulated more essential oil under lower rainfall (23). However, the dry weather increased the essential oils (24).
5.3. Conclusions
This study indicated that phytochemical traits of plants are greatly influenced by different climatic conditions. Also, environmental conditions had a significant role on essential oil quantity and quality. The altitude, mean evaporative per month (MEM) and Mean Day Temperature (MDT) were effective macro environmental factors on essential oil, thymol, and carvacrol content. In general, the regions with warm and semi-humid climate were the best locations for essential oil production with high amount of thymol and carvacrol.
