1. Background
Myristica fragrans belongs to the family Myristicaceae and is one of the plants commonly found in Asian medicinal ingredients (1-3). Seeds of the plant are the most important parts (4). The seed of M. fragrans is widely used as a spice for treatment of microbial pathogens in Asian folk medicine and it has a slightly warm taste (5, 6). It is used as appetite stimulant, carminative, antiemetic, abortifacient, antidiarrheal, hypnotic, analgesic and emmenagogue agent (5). M. fragrans is used to treat colds, catarrh, fever, skin diseases and respiratory ailments (7, 8). In addition, M. fragrans has been shown to possess antibacterial and antioxidant activities (9-11). Vitamins, alkaloids, flavonoids, lignans and phenolic compounds have been identified from M. fragrans (12). It also contains myristic acid, camphene, eugenol, isoeuglenol, elemicin, isoelemicin, pinene, methoxyeugenol, sabinene, myristicin, safrol, elimicin and quercetin (13-16). Different methods have been used to produce plant extracts such as heating, boiling or reflux (17). Recently, new extraction methods have been used for extraction of chemical compounds including ultrasound, microwave and supercritical fluid extractions (18). Among these methods, ultrasound-assisted extraction is simple, inexpensive and rapid (19). In ultrasound-assisted extraction, mechanical forces and thermal impact are attributed to cavitation, which result in enhanced mass transfer across cell membranes, disruption of cell walls and reduced particle size (19). Response surface method (RSM) is a statistical technique for optimizing the ultrasound-assisted extraction parameters (20, 21).
2. Objectives
The target of this study was to use the response surface method to optimize the extraction conditions of M. fragrans seeds by ultrasound-assisted extraction method. Optimization conditions were solvent to material ratio, time, and temperature for extraction of antioxidant and phenolic compounds.
3. Methods
3.1. Plant Materials
Dried M. fragrans seeds were prepared from Iranian market in Bojnurd, and certified as M. fragrans seeds by Herbarium of Medicinal Plants and Natural Products Research Center in North Khorasan, Iran.
3.2. Ultrasound-Assisted Extraction
An ultrasonic device (Bandellin Sonorex digitec, DT-510H, Germany) was used for extraction; its frequency was fixed as 40 kHz, electric power of 200 W and equipped with digital timer and temperature controller. Samples were extracted with ethanol under these conditions: 15 to 35 min, 25ºC to 45ºC and 10 to 30 mL/g ratio of liquid to material. After extraction, the solvent was removed by rotary evaporator in 40ºC and then the yield was determined, after that the extracts were analyzed.
3.3. Experimental Design
Box-Behnken design with three-level-three-factor was used to determine the best conditions for extraction of phenolic and antioxidant compounds. Independent variables were extraction time (X), extraction temperature (X2), and ratio of solvent (ethanol) to sample (X3); their levels were: Extraction time (X1, min) = (-1, 0, +1: 15, 25, 35), Temperature (X2, ºC)= (-1, 0, +1: 25, 35, 45) and Ratio of ethanol to material (X3, mL/g) = (-1, 0, +1: 10, 20, 30). The second-order polynomial model was:
Y is predicted response and β0, βi, βii, βij are regression coefficients for intercept, linear, quadratic and interaction terms, respectively. Xi and Xj are coded independent variables. Fifteen tests were performed according to Table 1 to optimize the parameters. Yield of extraction, phenolic content, and antioxidant power in DPPH (diphenyl-picrylhydrazyl) and FRAP (Ferric reducing antioxidant power) methods were dependent variable. Each experiment was performed in triplicate.
| Extraction Conditions | Analytical Results | ||||||
|---|---|---|---|---|---|---|---|
| Run | Tb (min) | Tc (°C) | Rd (mL/g) | Yield (%) | Total Phenolic Content (mg GAE/g DW) | IC50 (mg/mL) | FRAP (mmol/g DW) |
| 1 | 25 | 45 | 250 | 17.99 | 93.84 ± 0.45 | 60.44 ± 0.17 | 44.62 ± 0.98 |
| 2 | 35 | 35 | 250 | 18.12 | 92.29 ± 0.31 | 61.24 ± 0.47 | 45.41 ± 0.68 |
| 3 | 25 | 35 | 500 | 17.97 | 92.92 ± 0.62 | 62.71 ± 0.39 | 41.93 ± 0.25 |
| 4 | 35 | 35 | 750 | 18.08 | 84.11 ± 0.27 | 41.11 ± 0.54 | 72.65 ± 0.57 |
| 5 | 25 | 45 | 750 | 17.02 | 80.21 ± 0.14 | 27.45 ± 0.46 | 89.12 ± 0.45 |
| 6 | 15 | 35 | 250 | 17.30 | 83.18 ± 0.15 | 40.18 ± 0.21 | 74.32 ± 0.53 |
| 7 | 35 | 25 | 500 | 17.92 | 86.81 ± 0.89 | 43.81 ± 0.38 | 71.41 ± 0.86 |
| 8 | 35 | 45 | 500 | 17.97 | 88.43 ± 0.63 | 45.43 ± 0.57 | 65.64 ± 0.29 |
| 9 | 15 | 45 | 500 | 17.84 | 82.4 ± 0.54 | 37.2 ± 0.48 | 76.65 ± 0.79 |
| 10 | 25 | 25 | 250 | 17.65 | 80.72 ± 0.48 | 35.12 ± 0.47 | 85.14 ± 0.18 |
| 11 | 25 | 35 | 500 | 17.84 | 93.38 ± 0.97 | 58.12 ± 0.59 | 53.11 ± 0.31 |
| 12 | 25 | 25 | 750 | 18.06 | 99.93 ± 0.12 | 57.24 ± 0.68 | 54.13 ± 0.14 |
| 13 | 15 | 25 | 500 | 17.46 | 87.5 ± 0.25 | 44.15 ± 0.18 | 68.81 ± 0.16 |
| 14 | 25 | 35 | 500 | 17.58 | 81.8 ± 0.68 | 35.89 ± 0.36 | 82.26 ± 0.58 |
| 15 | 15 | 35 | 750 | 18.14 | 99.42 ± 0.35 | 55.72 ± 0.35 | 58.45 ± 0.32 |
| Blanke | 17.90 | 39.96 ± 0.58 | 87.45 ± 0.12 | 99.38 ± 0.36 | |||
Central Composite Design of Factors with Their Observed Responsesa
3.4. Statistical Method
The experiment design was carried out by Design-Expert software. The coefficients were obtained by using F test. Analysis of variance (ANOVA), regression analysis and response surface plot were used for establish the optimum conditions for antioxidant activities and total phenolic content.
3.5. Analysis for Antioxidant Activity
3.5.1. Antioxidant Activity by DPPH Method
In DPPH method, the antioxidant activity was determined by free radical scavenging method (22). Briefly, 3.9 mL of sample at different concentrations and 0.1 mL DPPH (0.1 mM in methanol) were mixed together. The mixture was vortexed and incubated in a dark place for 30 minutes, and their absorbances were measured at 517 nm. Butylated hydroxytoluene (BHT) was used as positive control. The radical scavenging effect is calculated by following equation:
IC50 was determined by Biodatafit online software. All tests were performed in triplicate.
3.5.2. Antioxidant Activity by FRAP Method
FRAP reagent contained TPTZ solution (10 Mm) in HCl (40 mM), FeCl3 .6 H2O (20 mM) and acetate buffer (0.3 M, pH 3.6) (23). One hundred µL of each sample and 3 mL FRAP reagent were mixed and incubated in a water bath at 37ºC for 10 minutes. After incubation, the absorbance was measured at 593 nm. Around 0 - 1 mM of FeSO4.7H2O was used for calibration curve. FRAP values were showed as mmol Fe (II) per gram dried material (mean ± standard deviation).
3.6. Total Phenolic Determination
The total phenolic content was measured by Folin-Ciocalteu method (24). One hundred µL from each extract (1 mg/L) was added to 100 µL of diluted Folin-Ciocalteu reagent (1/10) and 2 mL of sodium carbonate (Na2CO3, 2%), then they were mixed and incubated for 30 minutes. The absorbance was read at 720 nm. The tests were done in triplicates. The standard curve was prepared by gallic acid. Total phenolic content was expressed as gallic acid equivalent (mg gallic acid per dried weight of extract) (24).
4. Results and Discussion
4.1. Modeling of the Yield, TPC, DPPH and FRAP Responses
The responses (yield, total phenolic content, scavenging activity of DPPH radical and ferric reducing antioxidant power) of each run are presented in Table 1. Design Expert program (version 6.0.1) was used to estimate the effects of each factor and their interaction. Models were significant (P < 0.0001, P < 0.001, P < 0.01 and P < 0.05 for the yield of extraction, total phenolic content, %DPPH and FRAP, respectively). The fitted models were considered adequate by lack of fits that were not significant at 95% confidence. The yield of extraction varied from 17.022% to 18.14 %. Total phenolic content of M. fragrans extracts varied from 80.21 to 99.42 mg gallic acid/g dry weight. Experiment 12 (25 minutes, 25ºC, 750 mL/g) provided the highest total phenolic contents (99.93 mg/g), and the experiment 5 (25 minutes, 45ºC, 750 mL/g) produced the least phenolic content (80.21 mg/g). The extract of experiment 10 (25 minutes, 45ºC, 750 mL/g) showed the highest antioxidant activity (IC50 = 27.45 mg/mL), and extract of experiment 3 (25 minutes, 35ºC, 500 mL/g) showed the lowest antioxidant activity (IC50 = 62.71 mg/mL, and 41.93 ± 0.25 mmol/g in FRAP).
4.2. Response Surface Analysis for the Yield of Extraction
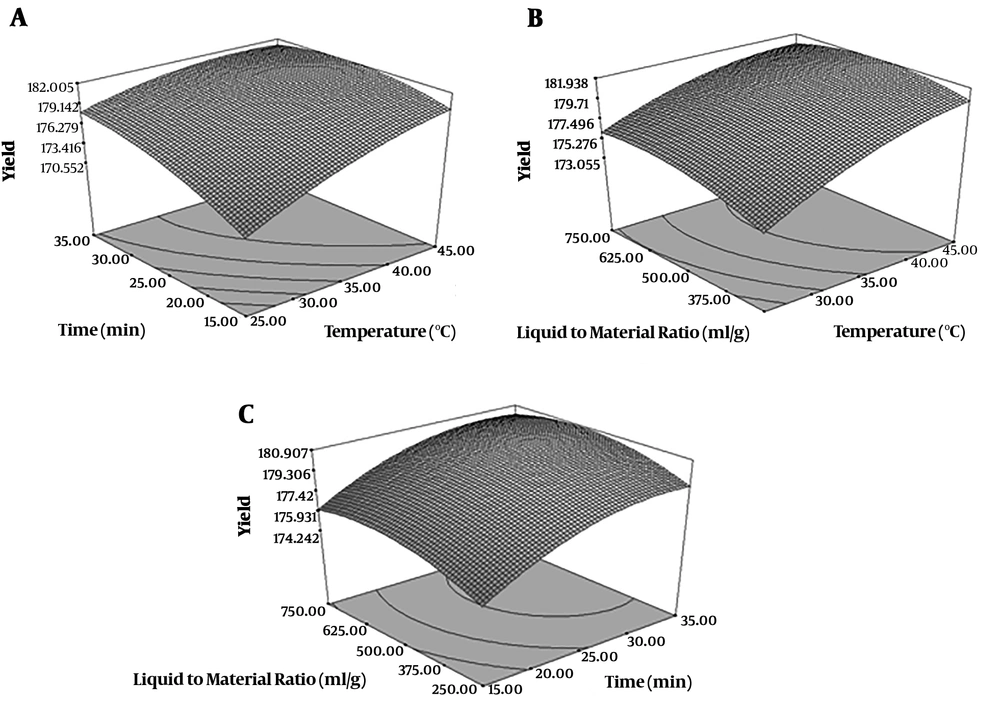
By using RSM a relationship was found between extraction parameters and yield of extraction. Their effects were shown in Figure 1. Intended factors (time, temperature, liquid to material ratio) had significant effect on the yield of extraction (P < 0.05). The yield of extraction was higher when the ethanol to raw material ratio (mL/g) changed from 250 to 750 (mL/g) (Figure 1A). When solvent to material ratio was 250 mL/g, the yield increased with the increasing of extraction time. When the solvent to material ratio was 750 (mL/g), the yield showed decrease with the increase of temperature. The yield increased with the increasing of temperature when the solvent to material ratio was lowest amount (Figure 1B). Solvent to material ratio and temperature parameters showed significant interaction effects (P < 0.05) on the yield (Figure 1B). High extraction time and temperature increase solubility of compounds from plant which is how the highest extraction yield was obtained (25). The highest yield was obtained at 750 mL/g solvent to material ratio, 15 minutes extraction time and 35ºC temperature. In other study on Ligusticum chuanxiong the optimal conditions were as follows: extraction temperature of 85ºC, ultrasonic power of 187 W and extraction time of 29 minutes (26).
4.3. Effect of Ultrasound-Assisted Extraction Time, Temperature and Solvent to Material Ratio on Total Phenolic Content
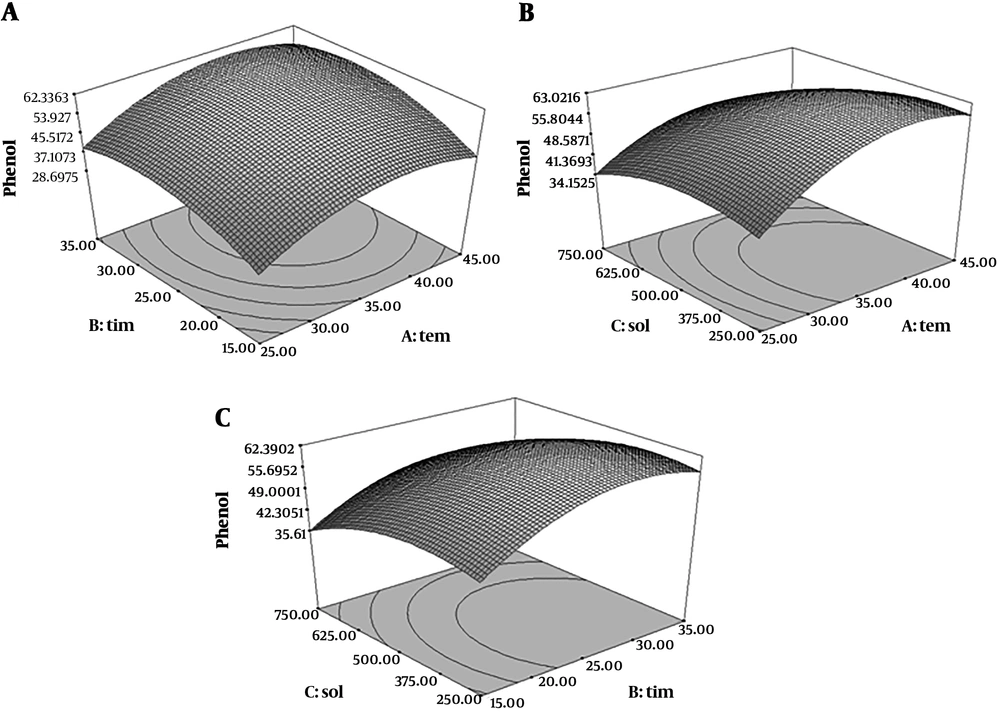
Analysis of the results in total phenolic compounds determination indicated that the model was fit because the results were significant in quadratic model (P < 0.05) and the lack of fit test was not significant (P > 0.05) (R2 = 0.9986). Figure 2 showed the relationship between three parameters’ extraction and total phenolic content. According to the obtained results, 25 minutes and 25ºC and 750 mL/g solvent to material ratio were the optimum extraction conditions for maximum yield of total phenolic content extraction which was achieved 99.93 mg GAE/g dry weight of extract. Ultrasonic extraction breaks the plant cells to simplify penetration of solvent into the cells (27). Therefore, extraction time is important for extraction of phenolic compounds in ultrasonic-assisted method. A longer extraction time causes an increase of total phenolic content extracted (28). In another study on pumpkins and peaches optimal conditions for peach extracts were an extraction temperature of 41.53°C, power of 43.99% and time of 27.86 minutes for total phenolics (29).
4.4. Effect of Ultrasound-Assisted Extraction Time, Temperature and Solvent to Material Ratio on Free Radical Scavenging Activity
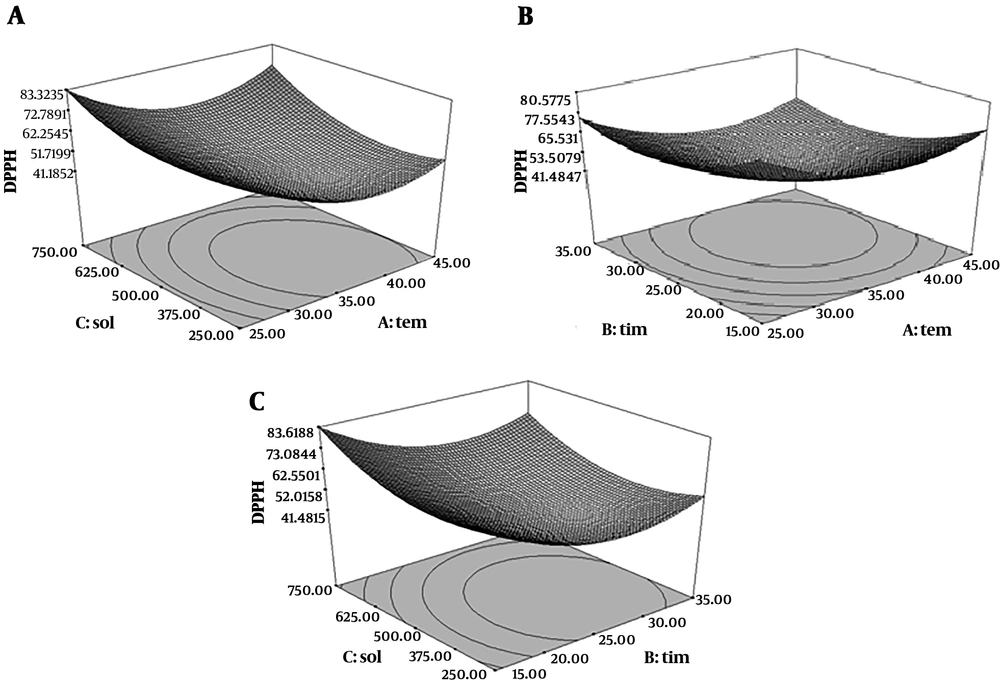
Quadratic model of free radical scavenging activity was significant (P < 0.05), but the lack of fit test was not significant) P > 0.05) (R2 = 0.98). As shown in Figure 3, IC50 was decreased at first with increasing the temperature and increased afterward. Antioxidant activity was decreased in long extraction time and high extraction temperature; because of thermal degradation of antioxidant and phenolic compounds. Higher extraction time and temperature could lead to the hydroxylation or degradation of antioxidants from plants (30). The results of antioxidant activities of this extract were shown by IC50 (mg/mL) for DPPH test. Lower IC50 showed the higher antioxidant activity of extracts. The results exhibited that lowest IC50 value was 27.45 mg/mL, from 25 minutes extraction time, 45ºC extraction temperature and 750 mL/g solvent to material ratio condition which in maceration extract IC50 was 87.45 mg/mL. Therefore, ultrasound caused an increase the inhibitory effect of free radicals of M. fragrans extract. The antioxidant activity of M. fragrans extract from ultrasound-assisted extraction is related to higher phenol content and the phenolic compounds are responsible for the high level of antioxidant activity. Scavenging of DPPH radicals by antioxidants is related to their hydrogen donation. The correlation of scavenging effect and concentration of phenolic compounds is linear and R2 is 0.795. These results showed that the phenolic compounds from M. fragrans seed have a significant effect on scavenging DPPH free radicals. In the Altemimi et al. study, an extraction temperature of 41.60°C, power of 44.88% and time of 27.49 minutes was optimal for free radical scavenging activity (29).
4.5. Effect of Ultrasound-Assisted Extraction Time, Temperature and Solvent to Material Ratio on FRAP Assay
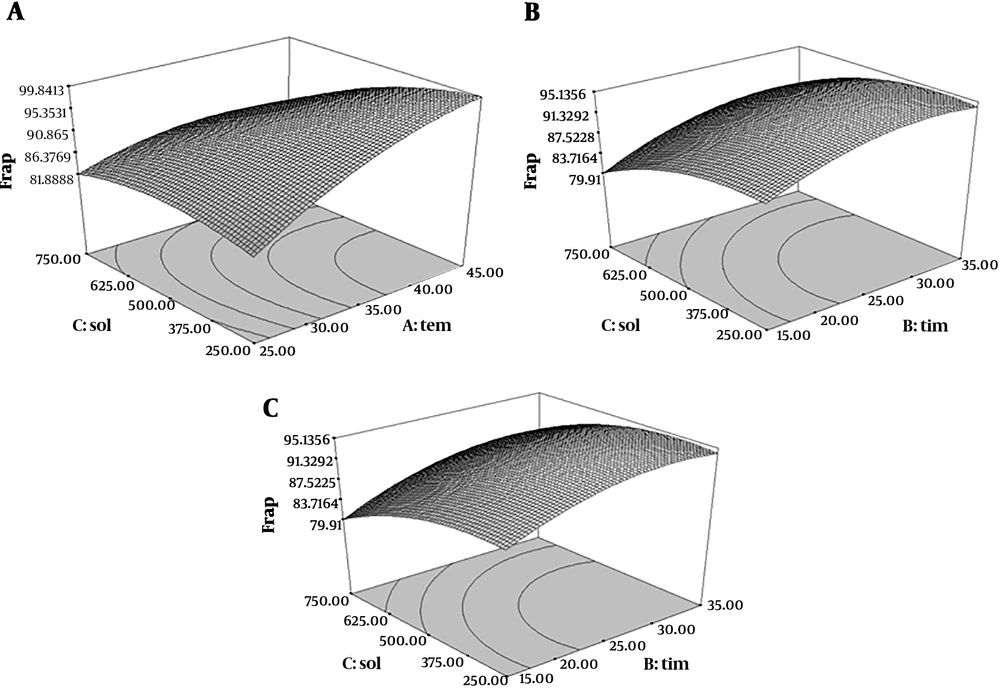
The quadratic degree model of FRAP assay was significant (P < 0.05) but the lack of fit test was not significant (P > 0.05) (R2 = 0.96). Therefore, with increasing extraction time and temperature, the ferric reducing antioxidant power was increased. In addition, as shown in Figure 4, ferric reducing antioxidant power was increased at first with increasing the time and temperature, and then decreased.
4.6. Optimization of Ultrasound-Assisted Extraction and Comparison with Maceration Method
The results showed that the optimum treatment condition in RSM analysis was 374.61 mL/g solvent to material ratio, 29.57 minutes extraction time and 41.89ºC extraction temperature. In this condition, the yield was 18.14%, IC50 = 43.66 mg/ml (DPPH test), FRAP value = 99.38 mmol/g DW, and total phenolic content was 63.41 (mg GAE/g DW).
Maceration method was also used for the extraction of M. fragrans. The results were shown in Table 1. The yields of extraction showed no significant difference (P < 0.05) between ultrasound-assisted extraction and maceration method; but in ultrasound-assisted extraction, time of extraction is reduced; in maceration method, 24-hour time is used and the time of extraction in ultrasound-assisted extraction was 15 minutes. Also, the results showed significant difference (P > 0.05) between ultrasound-assisted extraction and maceration method. Ultrasound-assisted extraction was better than maceration method in extraction of phenolic compounds and antioxidant activity.
5. Conclusions
In the present work, ultrasound-assisted extraction was performed for extraction the phenolic compounds from M. fragrans seeds. The RSM was used to optimize the ultrasound-assisted extraction conditions. The maximum of the yield of extraction, total phenolic content and antioxidant activity obtained using the optimized ultrasound-assisted extraction. The optimized conditions are as follows: 29.57 minutes extraction time, 41.89ºC extraction temperature, 374.61 mL ethanol to g of raw material. In conclusion, ultrasound-assisted extraction method is a green method and has great potential for the extraction of active compounds and antioxidants from natural products.


