
1. Background
Naturally occurring coumarins are structurally distinct dietary constituents found in Rutaceae, Apiaceae and Moraceae families (1-4). More than 1300 coumarins have been identified as secondary metabolites from plants, bacteria, and fungi, showing numerous pharmacological properties such as anticancer, antiviral, and antioxidant effects (5-7). Osthole (7-methoxy-8-(3-methyl- 2-butenyl)-2H-1-benzopyran-2-one), a natural prenylated coumarin isolated from several Apiaceous plants, has exerted numerous pharmacological effects such as antispasmodic (8, 9) anticonvulsant, (10) neuroprotective (11), blood pressure and lipid reducing effects (12). Recent animal studies have shown that osthole is a neuroprotective agent for treatment of neurodegenerative disorders such as Parkinson (13). Therefore, it exhibits various pharmacological properties and the possibility of its development as a promising lead compound for drug discovery has been proposed (12). Unfortunately, no toxicological data are available regarding safety of repeated exposure to osthole. For above reasons, in this study a toxicological evaluation was carried out to investigate its potential toxicity after single and 45-day repeated dosing of osthole in mice and Wistar rats, respectively. In the current study, osthole was isolated from Prangos ferulacea, which has been previously proven as a good source of this natural coumarin (9).
CYP is a family of monooxygenases involving in the oxidative metabolism of various substances including drugs and toxins (14). CYP enzymes are found approximately in all living organisms but the highest level of them is found in the liver endoplasmic reticulum (microsome). Significant clinical interactions can occur when a compound acts as an enzyme substrate, inducer, or inhibitor (15). In the current study, the effect of osthole was investigated on CYP genes expression in male rat hepatic tissues.
2. Objectives
The aim of this study was to evaluate the acute and subchronic toxicities of osthole in rodents. In addition, we investigated the effect of osthole on different hepatic CYP gene expressions in the rats receiving the highest dose of this coumarin.
3. Methods
3.1. Chemicals and Instruments
All chemicals and solvents were of analytical grade. Silica gel (40 - 63) and solvents were purchased from Merck (Germany). The elucidation and purity of osthole were determined by TLC, 1H and 13C NMR, and mass spectroscopy. 1H (500 MHz) and 13C (125 MHz) NMR were recorded on a Brucker instrument, using CDCl3 as the solvent and TMS as the internal standard. Compounds on the TLC (Silicagel 60 GF254 precoated plates, Merck) were detected at 254 and 365 nm followed by cerium sulfate/molibdate (Merck) as spraying reagents. Other chemicals and instruments used in this study were described in the related section.
3.2. Plant Material
P. ferulacea roots were collected from Yasouj in the Kohgiluyeh and Boyerahmad province in June 2011 at an altitude of ca.1800 m above the sea level. The plant was identified at the botany department of Yasouj University, and a voucher specimen (No. 2408) was deposited at the herbarium of the school of pharmacy and pharmaceutical sciences, Isfahan University of Medical Sciences, Isfahan, Iran.
3.3. Extraction and Isolation of Osthole
850 g of roots were extracted with acetone for three days (8 L × 4). The extract was concentrated to a dark brown viscous mass (85 g), which was then winterized using MeOH and chromatographed as described previously (4). In summary, the latter extract was apt to VLC, two open column chromatographies, and recrystallization to get pure osthole. Its structure was elucidated using spectroscopic analysis such as H-NMR and C-NMR and compared to literature (7).
3.4. Animals
The acute toxicity test was carried out on adult female mice weighing between 25 and 35 g.
Mice were obtained from Razi research institute (Hesarak, Karaj, Iran) and segregated according to gender and housed three per plastic cage. Male and/or female Wistar rats, supplied by Central Animal Facilities of Kermanshah University of Medical Sciences, were used for subchronic studies. Initial body weights of the test animals for the subchronic study ranged from 90 to 130 g. They were seven weeks old at the beginning of the study. All animals were maintained in standard environmental conditions (23 ± 2°C, 12:12 h dark/light cycle, frequent air change) and had free access to tap water and food. All procedures used in the present study followed the “Principles of Laboratory Animal Care” from NIH Publication No. 85-23 and they were approved by the Animal Ethics Committee of our university.
3.5. Acute Toxicity Study in Mice
Mice were divided into 4 groups of 4 animals and acclimatized for one week before starting the experiment. They were treated as follows: the first group (control group) was treated with DMSO: H2O, 5:5, while the remaining groups (2 - 4) received osthole at doses of 100, 500, and 1000 mg/kg i.p. in a single administration. Clinical signs exhibited by the mice were observed prior to dosing at 1, 2, 3, 4, 5, 6, 7, and 8 hours post-dosing and daily thereafter for 14 days. Animals were observed for general behavioral change, body weigh change, and mortality for a period of 14 days post treatment (16). The number of dead animals in each group at the end of the study was expressed as percentage. LD50 value was established using the Probit method (17). All of the animals were sacrificed on day 15 and the relative organ weight (weight of organ as proportion of the total body weight of each animal) was calculated.
3.6. Sub-Chronic Oral Toxicity in Rat
Groups of four male and female rats each were administered with 5, 25, and 50 mg/kg of osthole in NaCMC, 0.5%w/v via gavage every day for 45 days, while control rats (group I) received NaCMC, 0.5%w/v as vehicle. The doses were chosen based on the limitation of solubility and the results of acute toxicity. Animals were observed for signs of abnormalities during the treatment period. Besides, the body weights of animals were recorded twice a week.
3.6.1. Measurement of Hematological and Biochemical Parameters in Rats
At the end of the study, animals were fasted overnight, but allowed free access to water. They were then anesthetized with ether, and blood was collected with and without anticoagulant (ethylene diaminetetraacetate) by retro-orbital puncture using capillary tubes for hematological and biochemical studies, respectively (17). The following hematological parameters were determined with the Sysmex K-1000 fully automated hematology analyzer: erythrocyte (RBC), total and differential leukocyte (WBC), hematocrit (Hct), hemoglobin (Hb), platelet count, mean corpuscular volume (MCV), mean corpuscular hemoglobin (MCH), mean corpuscular hemoglobin concentration (MCHC), and platelet. Blood samples for biochemical analyses were centrifuged at 3,000 g for 5 minutes, and the plasma was collected and analyzed for glucose, uric acid, creatinine, albumin, cholesterol, triglycerides, aspartate aminotransferase (AST), alanine aminotransferase (ALT), urea, total protein, calcium, potassium, phosphorous, and sodium using a COBAS Mira S chemistry analyzer (Roche Diagnostic Systems, West Sussex, England).
3.6.2. Histopathological Examination
The animals were killed with an overdose of ether. After sacrificing the treated and control rats, the organs were identified and preserved in 10% neutral buffered formalin for microscopic histopathological examinations. The tissues were embedded in paraffin, and then sectioned, stained with haematoxylin and eosin, and examined microscopically.
3.7. Real Time RT-PCR Analysis
Total RNA from liver samples of control and high dose groups was extracted using TRI reagent (Sigma, Aldrich, USA) according to the manufacturer instructions. Quality and quantity of total RNA were assessed by a spectrophotometer (NanoDrop TM 2000, USA) and samples were stored at - 80ºC until use. Quantitative specific RNA expression was performed in one-step Express one-step SYBR R Green ER™ kit (Invitrogen, cat #11780-200). The primers used in this study were selected from an already published study (Table 1) (14). The performances of all primer pairs were tested by primer concentration to determine the optimal reaction conditions. Thermal cycler conditions were 15 min at 50°C for cDNA synthesis, 10 min at 95°C followed by 40 cycles of 15 s at 95°C to denature the DNA, and 45 s at 60°C to anneal and extend the template. Melting curve analysis was performed to ascertain specificity by continuous acquisition from 65°C - 95°C with temperature transient rate of 0.1°C/S. All reactions were performed in triplicate in a Corbett system (Australia). Expression of target genes was normalized against β-actin. ΔΔCT method was used to measure fold increase of genes compared to the control group.
Table 1.
Primers Sequences Used for Real-Time RT- PCR Reactions
| Gene | Forward Primer | Reverse Primer |
|---|---|---|
| CYP1A2 | CGCCCAGAGCGGTTTCTTA | TCCCAAGCCGAAGAGCATC |
| CYP1B1 | GCTTTACTGTGCAAGGGAGACA | GGAAGGAGGATTCAAGTCAGGA |
| CYP2B1 | AACCCTTGATGACCGCAGTAAA | TGTGGTACTCCAATAGGGACAAGATC |
| CYP2E1 | AAAGCGTGTGTGTGTTGGAGAA | AGAGACTTCAGGTTAAAATGCTGCA |
| CYP2C11 | CACCAGCTATCAGTGGATTTGG | GTCTGCCCTTTGCACAGGAA |
| CYP2B2 | CCATCCCTTGATGATCGTACCA | AATTGGGGCAAGATCTGCAAA |
| CYP2C23 | CGTCCAATCACACGGTCAAG | TTCGGGCTCCTGCTCCTTA |
3.8. Statistical Analysis
The mean (SEM) was calculated for body weights, organ/body weight ratios, hematological and biochemistry factors. The difference between dose groups and control groups was separately evaluated for males and females with one-way analysis of variance (ANOVA) followed by Tukey’s test. P values of 0.05 or less were considered significant.
4. Results
4.1. Acute Toxicity
Two mice were found dead after i.p. administration of 1000 mg/kg osthole and one out of three mice was found dead at 500 mg/kg i.p. administration of osthole. The LD50 value was determined to be 710 mg/kg. The clinical signs observed during acute toxicity study are summarized in Table 2. These changes were reversed or showed a tendency to reverse during 24 hours post- dosing, indicating that the effects of osthole were reversible. Moreover, there were no treatment-related changes in body (Figure 1.) and organ weights. Microscopic findings showed no treatment-related effects.
Table 2.
Acute Toxicity of Osthole Administrated i.p to Mice
| Dose, g/kg | D/T | Latency | Symptoms |
|---|---|---|---|
| 0 | 0/4 | - | None |
| 0.1 | 0/4 | None- | |
| 0.5 | 1/4 | > 4 h < 24 h | Hyperventility, Locomotion, Aggressiveness, Touch sensibility, Tremour, Photophobiaa |
| 1 | 3/4 | > 24 h | Hyperventility, Locomotion, Aggressiveness, Touch sensibility, Tremour, Photophobia |
Abbreviation: D/T, dead/total.
aIn dose 0.5g/kg in mice that died, neurotoxicity was shown and long seizure occurred.
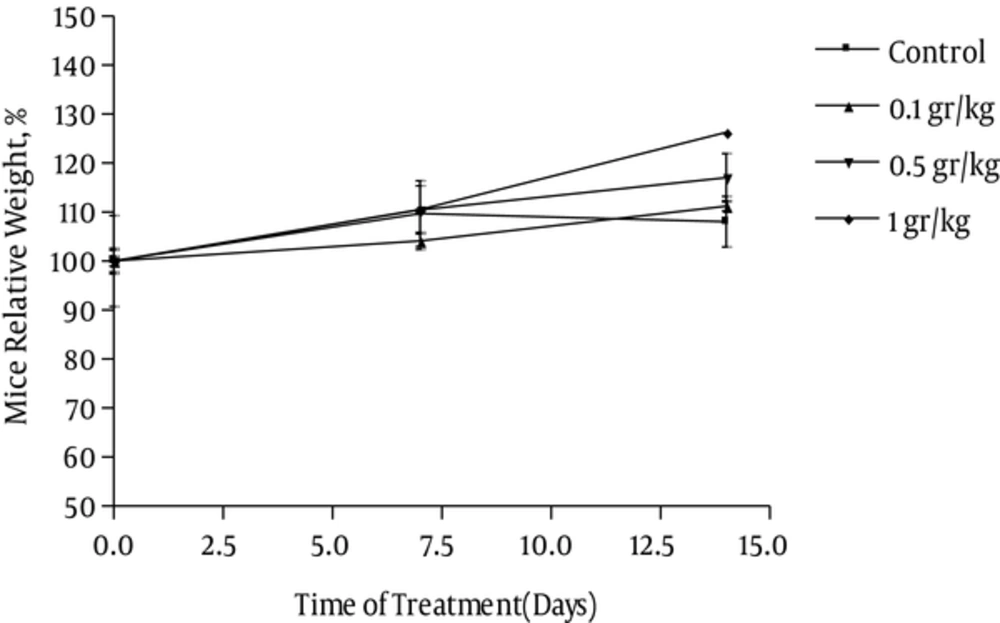
Figure 1.
Each point represents mean ± SEM; N = 4.
4.2. Sub-Chronic Toxicity
4.2.1. Evolution of Animal Weight and Organ Weights
One animal died on the 19th day of treatment. As shown in Figure 2, both control and osthole-treated animals presented a constant increase in body weight. Macroscopic analysis of the target organs of the treated animals (liver, heart, lung, kidney, and spleen) did not show any significant changes in color and texture when compared with the control group. Organ weights measured at necropsy showed increases in relative liver weights of the 25 mg/kg treated male rats (Table 3).
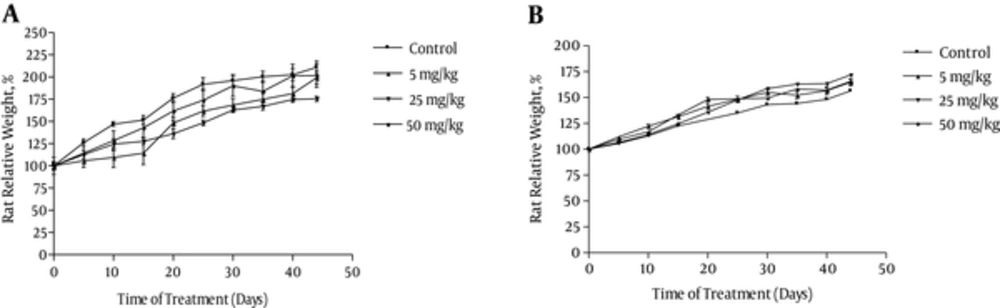
Figure 2.
Each point represents mean ± SEM; N = 4.
Table 3.
Relative Organ Weight at Termination of Treatment (g % Body Weight)a
| Sex | Dose, mg/kg | Liver, % | Kidney, % | Heart, % | Lung, % | Spleen, % |
|---|---|---|---|---|---|---|
| Male | Control | 3.55 ± 0.05 | 0.37 ± 0.022 | 0.40 ± 0.02 | 0.686 ± 0.06 | 0.24 ± 0.02 |
| 5 | 3.93 ± 0.092 | 0.37 ± 0.027 | 0.37 ± 0.01 | 0.74 ± 0.04 | 0.297 ± 0.04 | |
| 25 | 4.15 ± 0.13b | 0.40 ± 0.013 | 0.39 ± 0.006 | 0.7872 ± 0.03 | 0.25 ± 0.007 | |
| 50 | 3.90 ± 0.13 | 0.41 ± 0.018 | 0.36 ± 0.01 | 0.698 ± 0.02 | 0.2272 ± 0.01 | |
| Female | Control | 3.55 ± 0.17 | 0.36 ± 0.002 | 0.36 ± 0.034 | 0.85 ± 0.0717 | 0.25 ± 0.004 |
| 5 | 3.69 ± 0.05 | 0.35 ± 0.024 | 0.36 ± 0.009 | 0.76 ± 0.11 | 0.26 ± 0.03 | |
| 25 | 4.06 ± 0.13 | 0.38 ± 0.035 | 0.35 ± 0.01 | 0.70 ± 0.04 | 0.23 ± 0.01 | |
| 50 | 3.60 ± 0.13 | 0.30 ± 0.004 | 0.39 ± 0.02 | 0.82 ± 0.07 | 0.24 ± 0.01 |
aValues are expressed as mean ± S.E.M. for N = 5.
bSignificantly different from controls: *P < 0.05.
4.2.2. Biochemical and Hematological Parameters
Plasma biochemical data at termination of the study are presented in Tables 4 and 5. Urea levels elevated significantly among the middle and high dose groups of both sexes. Potassium ion concentrations in the 25 mg/kg and 50 mg/kg groups, albumin in the high dose group, and creatinine in the middle and high dose groups of males increased significantly.
Table 4.
Biochemical Parameters of Wistar Rats After 45 Days Treatment with Ostholea
| Sex | Dose, mg/kg | Blood Sugar, mg/dL | Urea, mg/dL | Creatinine, mg/dL | Cholesterol, mg/dL | Triglycerides, mg/dL | Calcium mg/dL | Phosphorus mg/dL | Sodium, mEq/L | Potassium, mEq/L | Total Protein, g/dL | Albumin, g/dL | Globulin, g/dL | SGOT (AST), IU/L | SGPT (ALT), IU/L | LDH, U/L |
|---|---|---|---|---|---|---|---|---|---|---|---|---|---|---|---|---|
| Male | Control | 78.75 ± 3.06 | 45.25 ± 1.887 | 0.55 ± 0.02 | 78.75 ± 1.109 | 75.75 ± 11.707 | 9.15 ± 0.23 | 6.675 ± 0.1797 | 153.5 ± 8.703 | 4.2 ± 0.0707 | 7.85 ± 0.155 | 3.35 ± 0.08660 | 4.475 ± 0.1109 | 135.75 ± 5.10 | 57 ± 6.01 | 822 ± 136.12 |
| 5 | 80 ± 16.563 | 37.333 ± 2.028 | 0.56 ± 0.24 | 85 ± 1.00 | 51.33 ± 3.84 | 9.366 ± 0.58 | 8.366 ± 0.8647 | 160.33 ± 4.66 | 4.6 ± 0.20 | 7.6 ± 0.1155 | 3.3 ± 0.05774 | 4.3 ± 0.15 | 125 ± 5.56 | 56 ± 10.066 | 655 ± 42.93 | |
| 25 | 87.66 ± 16.95 | 57.666 ± 3.4b | 0.70 ± 0.068c | 88.33 ± 9.73 | 57.66 ± 5.84 | 8.1 ± 0.17 | 7.76 ± 1.105 | 159.33 ± 9.615 | 6.03 ± 0.38d | 7.73 ± 0.17 | 3.36 ± 0.08 | 4.366 ± 0.23 | 134 ± 8.08 | 50.33 ± 3.38 | 677 ± 53.05 | |
| 50 | 97 ± 10.53 | 59.5 ± 0.95b | 0.68 ± 0.0095c | 79 ± 5.568 | 57 ± 5.44 | 9.05 ±0.15 | 7.57 ± 0.40 | 158 ± 1.780 | 5.275 ± 0.2213c | 8.1 ± 0.12 | 3.675 ± 0.07c | 4.175 ± 0.32 | 130.5 ± 5.85 | 49 ± 3.697 | 982 ± 242.01 | |
| Female | Control | 55 ± 6.08 | 50.66 ± 2.90 | 0.67 ± 0.025 | 90.66 ± 9.528 | 73.33 ± 0.88 | 9.3 ± 0.63 | 6.83 ± 0.32 | 157 ± 8.021 | 4.133 ± 0.1333 | 7 ± 1.137 | 3.53 ± 0.13 | 4.43 ± 0.14 | 114.33 ± 9.24 | 40 ± 4.58 | 746.33 ± 187.89 |
| 5 | 63.75 ± 4.90 | 56.25 ± 2.39 | 0.70 ± 0.03 | 82.5 ± 4.33 | 62 ± 5.61 | 9.525 ± 0.35 | 6.82 ± 0.25 | 159.25 ± 2.49 | 4.1 ± 0.2380 | 8.175 ± 0.14 | 3.575 ± 0.06 | 4.6 ± 0.14 | 114 ± 6.59 | 39.75 ± 3.09 | 530.25 ± 24.04 | |
| 25 | 89.25 ± 9.23 | 69.25 ± 3.30c | 0.70 ± 0.02 | 91.75 ± 1.93 | 63.25 ± 4.38 | 9.4 ± 0.26 | 8.35 ± 1.248 | 158 ± 2.12 | 5.175 ± 0.3637 | 8.15 ± 0.30 | 3.65 ± 0.11 | 4.5 ± 0.20 | 132.25 ± 6.14 | 52.5 ± 5.18 | 769.25 ± 99.94 | |
| 50 | 132.25 ± 10.16d | 82 ± 6.083b | 0.97 ± 0.15 | 123.5 ± 18.96 | 90 ± 22.77 | 8.65 ± 0.59 | 9.4 ± 1.308 | 187.25 ±32.47 | 5.9 ± 0.622 | 10.85 ± 1.94 | 4.7 ± 0.18 | 6.1 ± 1.10 | 144.5 ± 20.14 | 52.25 ± 8.04 | 786.75 ± 135.75 |
aValues are expressed as mean ± S.E.M. for N = 5.
bSignificantly different from controls: **P < 0.01.
cP < 0.05.
dP < 0.001.
Table 5.
Hematologic Parameters in Wistar Rats After 45 Days of Treatment with Ostholea
| Sex | Dose, mg/kg | WBC, 1000/µL | RBC, 106/µL | Hb, g/dL | HCT, % | MCV, fi | MCH, pg | MCHC, g/dL | Platelets, 1000/µL | Reticulocyte, % |
|---|---|---|---|---|---|---|---|---|---|---|
| Male | Control | 10.55 ± 2.08 | 8.0775 ± 0.19 | 15.525 ± 0.20 | 47.375 ± 0.66 | 58.725 ± 0.86 | 19.25 ± 0.27 | 32.772 ± 0.13 | 1120.75 ± 38.94 | 1.725 ± 0.39 |
| 5 | 8.5 ± 2.45 | 7.5666 ± 0.18 | 14.7666 ± 0.17 | 45.13 ± 0.34 | 59.7333 ± 1.68 | 19.533 ± 0.35 | 32.733 ± 0.35 | 885.33 ± 30.17b | 2.166 ± 0.82 | |
| 25 | 6.225 ± 0.51 | 8.5975 ± 0.29 | 16.175 ± 0.44 | 50.5 ± 1.80 | 58.75 ± 0.65 | 18.825 ± 0.20 | 32.05 ± 0.29 | 1093.5 ± 29.96 | 0.65 ± 0.027 | |
| 50 | 5.575 ± 0.57 | 8.48 ± 0.28 | 16.125 ± 0.57 | 50.675 ± 1.82 | 59.75 ± 0.25 | 19 ± 0.16 | 31.825 ± 0.22 | 1100 ± 23.11 | 1.525 ± 0.50 | |
| Female | Control | 5.4 ± 0.78 | 7.185 ± 0.16 | 13.825 ± 0.61 | 42.15 ± 1.21 | 58.62 ± 0.47 | 19.2 ± 0.44 | 32.75 ± 0.5500 | 990.25 ± 96.02 | 1.566 ± 0.52 |
| 5 | 7.15 ± 1.33 | 7.48 ± 0.14 | 14.575 ± 0.23 | 44.35 ± 0.45 | 59.32 ± 0.82 | 19.525 ± 0.29 | 32.87 ± 0.21 | 1081.5 ± 24.66 | 2.125 ± 0.12 | |
| 25 | 8.45 ± 1.58 | 7.425 ± 0.20 | 14.525 ± 0.39 | 43.52 ± 1.00 | 58.65 ± 0.53 | 19.55 ± 0.15 | 33.37 ± 0.31 | 1171.25 ± 54.99 | 1.675 ± 0.39 | |
| 50 | 4.8 ± 1.20 | 7.3325 ± 0.12 | 14.25 ± 0.15 | 43.12 ± 0.23 | 58.85 ± 0.93 | 19.475 ± 0.47 | 33.02 ± 0.28 | 1075.75 ± 41.482 | 1.7 ± 0.05 |
aValues are expressed as mean ± S.E.M. for N = 5.
bSignificantly different from controls: *P < 0.05.
Moreover, an increase was observed in blood sugar of female rats treated with osthole 50 mg/kg. All the other analyzed biochemical parameters were normal. Animals exposed to osthole did not show any difference in the hematological parameters evaluated compared to controls, except for males (5 mg/kg) that showed a significant decrease in platelet (P < 0.05).
4.2.3. Histopathology
The results of microscopic examination of control and treated animals showed intra alveolar hemorrhage, congestion of alveolar capillaries, and mild inflammatory cell infiltration in lung and congestion of sinusoidal and portal vein and mild portal inflammation in the liver (Figure 3A and 3B).
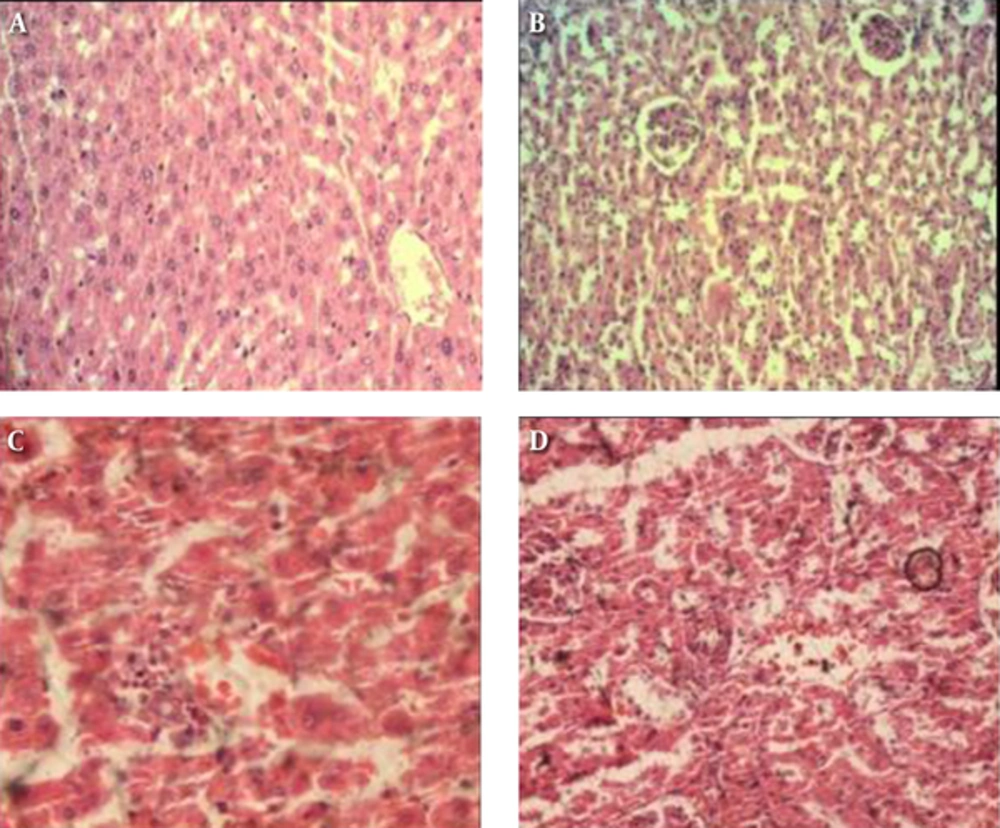
Figure 3.
A; negative control of liver, B; liver of the highest dose group at 40X. Showing congestion of sinusoidal and portal vein and mild portal inflammation; C, negative control of kidney; D, Kidney of the highest dose group at 40X. Showing peritubular capillary congestion, hemorrhage in renal parenchyma, mild tubular dilatation, and mild interstitial infiltration of inflammatory cells.
The change in the kidney included peritubular capillary congestion, hemorrhage in renal parenchyma, mild tubular dilatation, and mild interstitial infiltration of inflammatory cells (Figure 3C and 3D). In the spleen, congestion of blood vessels and sinuses and hemosiderosis were seen only in the middle and highest dose groups. These lesions were observed in treated but not in control animals. In the heart, slight treatment related histological changes were observed at 25 mg/kg and 50 mg/kg groups (Table 6). The determination of other parameters demonstrated no treatment related lesions in the organs examined.
Table 6.
Selected Histopathological Findings at Termination of Treatmenta
| Organs Finding | Dose, mg/kg | |||
|---|---|---|---|---|
| 0 | 5 | 25 | 50 | |
| Liver | ||||
| Sinusoidal congestion and portal vein congestion | - | - / + | + + | + + + |
| Mild portal inflammation | - | - / + | + + | + + + |
| Lung | ||||
| Intra-alveolar hemorrhage | - | - / + | + | + + |
| Congestion of alveolar capillaries | - | - / + | + | + + |
| Mild inflammatory cell infiltration | - | - / + | + | + + |
| Kidney | ||||
| Peritubular capillary congestion | - | + | + / + + | + + + |
| Hemorrhage in renal parenchyma | - | + | + / + + | + + + |
| Mild tubular dilatation | - | + | + / + + | + + + |
| Mild interstitial infiltration of inflammatory cells | - | + | + / + + | + + + |
| Spleen | ||||
| Congestion of spleen sinuses | - | - | + / + + | + + |
| Blood vessels congestion | - | - | + / + + | + + |
| Hemosiderosis | - | - | + / + + | + + |
| Heart | ||||
| Intraparenchymal hemorrhage | - | - | + | + |
| Architectural distortion | - | - | + | + |
aMild (+), moderate (+ +), severe (+ + +).
4.3. Effect of Osthole on CYP genes Expression in the Liver
To examine the effect of osthole on the expression of various CYP genes, the latter was measured in the control and high dose groups of the rats using real time RT-PCR method. Our results demonstrated that treatment of rats with osthole (50 mg/kg) caused an induction of CYP1A2. The induction was 2.64 fold higher compared to controls (Figure 4). On the other hand, osthole induced CYP2E1 and CYP2C11 about 2.88 and 4.4 fold higher compared to controls, respectively. In addition, there was a trend towards inhibition of CYP1B1 and CYP2B1 but these did not reach statistical significance. Our results showed that osthole did not significantly alter CYP2B2 and CYP2C23 mRNA expression.
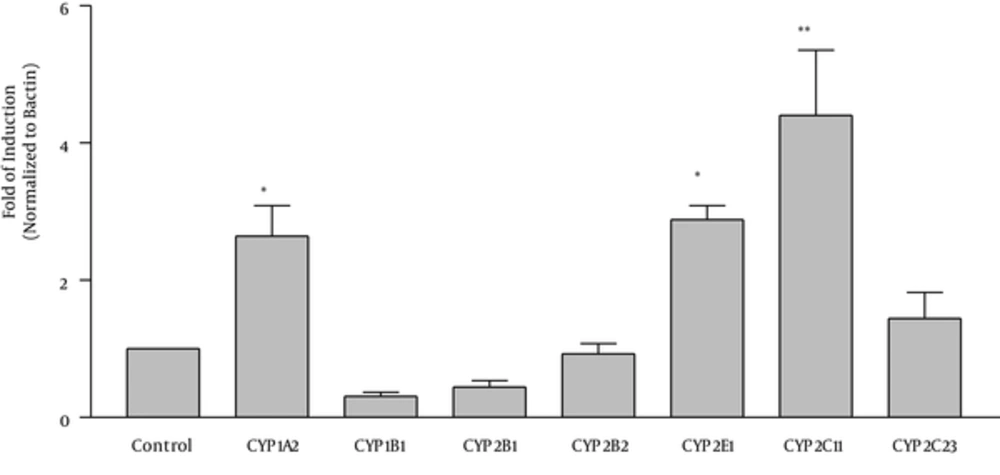
Figure 4.
Male rats were treated for 45 days with osthole 50 mg/kg). Thereafter, liver total RNA was isolated and the expression of the genes was determined by real-time RST PCR. Fold of induction was calculated as target gene expression normalized to B actin (divided by the control value set as 1). Values are the mean ± SEM from 5 different treatments. *P < 0.05, ** P < 0.01 compared to controls.
5. Discussion
In the present study, acute and subchronic toxicity of osthole, an active coumarin isolated from the roots of P. ferulacea, was evaluated in rodents. Generally, the first toxicity test usually performed on a compound is acute toxicity, determined from the administration of a single exposure. The main objective of acute toxicity testing is to provide an approximation of the intrinsic toxicity of substances often expressed as median lethal dose (LD50) (15). Chemicals can be allocated to one of the six toxicity categories based on acute toxicity. According to the common classification of relative toxicity of chemicals, substances that cause death in laboratory animals exposed to 0.5- 5 g/kg are moderately toxic. Therefore, osthole is a moderately toxic substance when administered i.p (LD50 = 710 mg/kg) (18). Yim et al. evaluated acute toxicity of osthole in biopesticides in two aquatic organisms Daphnia magna and Danio rerio (19). The obtained results showed that osthole had considerable toxicity, because the median lethal concentration value of osthole was 19.3 μM and 30.6 μM in Daphnia magna and Danio rerio, respectively. A subchronic study was done to further identify and characterize specific organs affected by osthole. Analyzing blood parameters showed that osthole does not interfere with the formation of erythrocytes and leukocytes nor causes microcytosis or macrocytosis in rats. Hence, there were no toxicologically significant alterations in the hematological parameters. The results of subchronic studies indicated that the kidney of test animals was significantly affected by osthole. Kidney function was assessed by determining serum urea, creatinine, potassium, and sodium. Creatinine is found in serum after chemical creatinine broken down by the body in order to make energy (20). The kidney is normally able to filter out large amounts of creatinine. Hence, high blood creatinine is a reliable indicator of a negative impact on kidney function or impaired glomerular filtration (21). The creatinine level significantly increased at 25 and 50 mg/kg in male rats compared to the controls, and thus showed negative impacts on the kidney. Serum urea increases as a result of toxic effects on renal tubules, renal parenchyma, decrease of cardiac output, and urinary tract obstruction (21). In the present study, serum urea was observed to increase with increasing dose in female and male rats. It must be noted that the relationship between creatinine and urea and the actual GFR is hyperbolic rather than linear. Hence, initial elevation of serum concentrations of these substances indicates a large decrease in renal performance (22).
Another finding was the increase in potassium concentration at 25 and 50 mg/kg in male rats. Potassium plays an important role in controlling activity of smooth and skeletal muscles, and in the muscles of the heart. It has also an important role in normal transmission of electrical signals throughout the nervous system. Potassium is normally cleared by the kidneys, so, impairment in the function of the kidneys can result in hyperkalemia (23, 24). Therefore, these results show that osthole caused nephrotoxicity. This was also confirmed by histopathological examination of the kidneys of treated and control rats showing peritubular capillary congestion, hemorrhage in renal parenchyma, mild tubular dilatation, and mild interstitial infiltration of inflammatory cells. Liver function was evaluated by determining serum proteins, SGOT, and SGPT. These markers usually help detect chronic liver disease (25). In the current study, there was no statistical difference in AST and ALT concentrations between control and treated groups. It was previously indicated that coumarin itself is potent to cause hepatotoxicity, perhaps in the tiny subset of people who take enough and have insufficient CYP2A6 activity to break coumarin down into safe catabolites. Since cytochrome 2A6 is responsible for 7-hydroxylation of coumarin, people who lack significant CYP2A6 activity may be at increased risk of coumarin hepatotoxicity (26).
Albumin was significantly higher in the group of male rats that received the highest dose of osthole. Albumin is produced only in the liver and it is the major plasma protein. This was regarded as toxicologically irrelevant because there are no pathological conditions that cause the liver to produce extra levels of albumin. Possibly, an increased level is a reflection of dehydration. Histopathology evaluation indicated that all removed organs were affected by subchronic exposure to osthole. In addition, osthole induced marked alteration of congestion, inflammatory cell infiltration, and mitochondrial swelling in the liver, lung, spleen, and heart. Hemorrhage was observed in the lung, kidney, and heart. These damages mediated by osthole might be due to the anticoagulant effects of coumarins, something that is not prevalent in all coumarins despite common knowledge (26). Coumarins, which are vitamin K antagonists, exert their anticoagulant effects by interfering with the cyclic inter conversion of vitamin K and vitamin K epoxide. One of the major spleen functions is to remove damaged erythrocytes; therefore, increased hemosiderin deposition in the spleen might be due to the elevated destruction of erythrocytes. In conclusion, a number of significant clinical and pathological changes were associated with the subchronic oral administration of osthole to Wistar rats. Several observations support the conclusion that kidney is plausible target organ. The CYP450 enzyme is of the most important xenobiotic-biotransformation enzymes that has high catalytic potential. It detoxifies xenobiotic or activates it to reactive intermediates (14). The highest level of CYP enzymes are found in the liver endoplasmic reticulum (microsome). By inducing CYP450, one drug can stimulate the metabolism of second drug and thereby decrease or ameliorate its clinical effects (15). Various compounds modulate isozymes of the monooxygenases to cause significant drug interaction. Previous studies showed that naturally occurring coumarins are able to modulate xenobiotic metabolizing enzymes. For example, multiple oral doses of imperatorin and isopimpinellin increased enzyme activities of P450s 1A1/2, 2B9/10, and 3A11. In the current study, osthole caused a significant induction of several CYP genes at the mRNA level. To the best of our knowledge, this is the first study to investigate the effect of osthole on CYP gene expression. Based on current study it can be concluded that kidney is a possible target organ of osthole. In addition, it was indicated that no-observed adverse effect level (NOAEL) of the osthole is less than 5 mg/kg for male and female rats. On the other hand, osthole demonstrated a potential for drug interactions in rats via CYP-mediated metabolism on subchronic administration.
