1. Background
Ketorolac tromethamine (KT) is described as a nonsteroidal anti-inflammatory drug (NSAID). Among various NSAIDs, KT is generally used for postoperative and emergency pain relief and is administered orally, intramuscularly, and intravenously for short periods (1). Considering the low molecular weight and significant analgesic activity of ketorolac, it is regarded as a proper agent for transdermal application. Additionally, KT inhibits cyclooxygenase-2 in dermal fibroblasts and exhibits major anti-inflammatory activity; consequently, it increases the potential for an advantageous transdermal product (2).
While transdermal administration of ketorolac is effective in noninvasive drug delivery, the drug must cross the epidermal and dermal layers before reaching the target tissues (3). Therefore, transdermal administration allows the drug to deeply penetrate into the skin. It should be noted that ketorolac has a hydrophilic nature, with poor skin absorption. Therefore, different methods have been proposed for improving the transdermal delivery of ketorolac (1).
Microemulsions (MEs) are effectively used for transdermal and topical delivery of drugs. Considering their high solubilizing potential, one of the main advantages of MEs is the large quantity of drugs, which can be merged into the formulation; therefore, the skin thermodynamic activity is improved, allowing a wide range of concentrations from the ME vehicle to the skin. In addition, drug permeation can be improved by the use of MEs owing to the synergistic effects of components for enhancing drug delivery.
Moreover, major components of MEs, including the water phase, surfactant-cosurfactant (S/C) mixture, and oil phase, can be synergistically mixed to improve the flux of drugs (4). Moreover, the ME surfactant and oil phase can enhance permeation through interacting with the lipid bilayer (5). According to various studies, ME formulations can improve transdermal and dermal delivery (6). An important stage of percutaneous absorption is the skin permeation of drugs.
Permeation is described as penetration from one skin layer into another. The lipid matrix of the stratum corneum is important in describing the skin permeability of a substance. The physicochemical properties of the drug and vehicle affect percutaneous absorption. Passive drug permeation, which is dependent on the partition coefficient and solubility of the drug, contributes to transdermal delivery (7, 8). The present study aimed to determine and evaluate the ex vivo skin permeation and physicochemical characteristics of ketorolac.
2. Objectives
The present study aimed to determine and evaluate the ex vivo skin permeation and physicochemical characteristics of ketorolac.
3. Methods
3.1. Materials
Ramopharmine Company (Iran) provided the KT powder, while Merck (Germany) provided Tween 80, isopropyl myristate, and PEG400. In addition, Gattefosse Co. (France) supplied pleurol oleic and caprylocaproyl macrogolglycerides (Labrasol). Minitab 17 was used to determine the effects of variables on different responses in an experimental design. In addition, Sigma plot 14 was applied for plotting the ternary phase diagrams. The solvents, as well as the chemicals, were of an analytical grade, and in all experiments, fresh double-distilled water was used. In addition, Tuba Azma Co. (Tehran, Iran) provided the dialysis bags.
3.2. Animals
We evaluated male adult Wistar rats (200 - 250 g) after the Ethics Committee of Ahvaz Jundishapur University of Medical Sciences approved this study (No. IR.AJUMF.REC.1395.131).
3.3. Ketorolac Assay
Using a UV spectrophotometer at 325 nm, the ketorolac content in a phosphate-buffered solution (PBS; pH, 7.4) was determined.
3.4. Oil, Surfactant, and Cosurfactant Screening
The ketorolac solubility in oil (isopropyl myristate,), surfactant (Labrasol, Tween 80), and cosurfactant (Pleurol Oleic, PEG400) was measured after more ketorolac was dissolved in 5 mL of these components. A shaking water bath was used to mechanically agitate the samples at 25 ± 0.5°C for 48 hours at 200 rpm in order to reach equilibrium. For removing the undissolved drug, centrifugation was performed at 10000 rpm for 30 minutes. A polytetrafluoroethylene membrane filter was used for filtering the clear supernatants (φ, 0.45 µm). The filtrates were then examined via UV spectrophotometry (9).
3.5. Construction of the Pseudoternary Phase Diagram
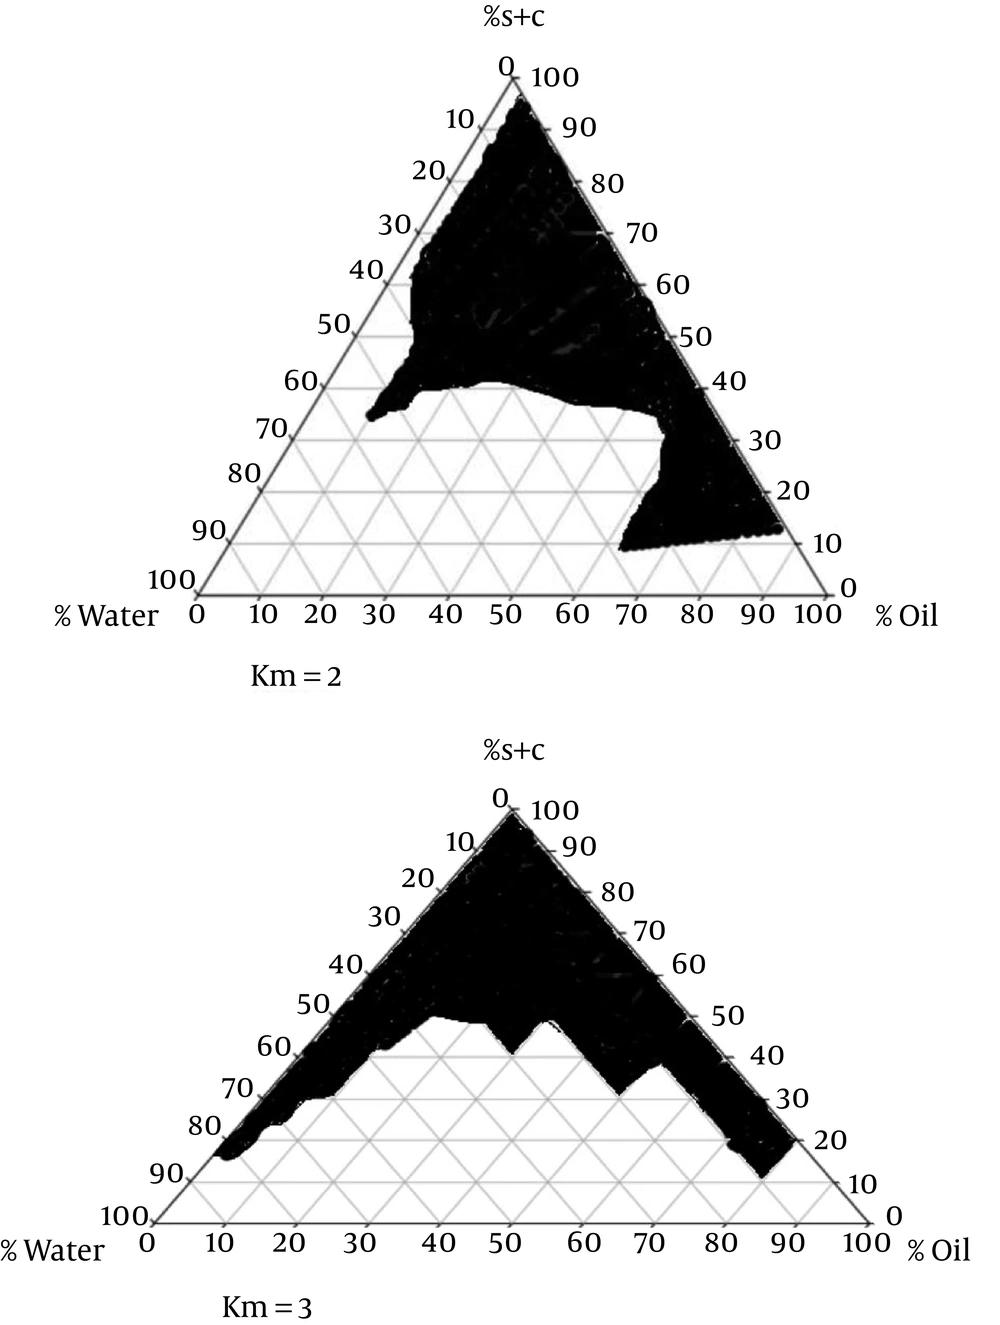
The titration method was used to map the pseudoternary phase diagrams, using liquid mixtures of oil, surfactant, and cosurfactant in water at room temperature to collect the desired concentrations for ME regions without the drug. Two phase diagrams at mass ratios of 2:1 and 3:1 were designed, respectively (Tween 80-Labrasol/Pleurol Oleic-PEG400).
The surfactant mixture and oil phase were mixed at different mass ratios (1:9, 2:8, 3:7, 4:6, 5:5, 6:4, 7:3, 8:2, and 9:1). The mixtures were then diluted in double-distilled water at 25 ± 1°C in a dropwise manner via moderate agitation. The samples were categorized after the appearance of clear liquids, based on polarized light microscopy. Polarized microscopy and visual inspection were used to characterize the phases (9).
3.6. Polarized Light Microscopy
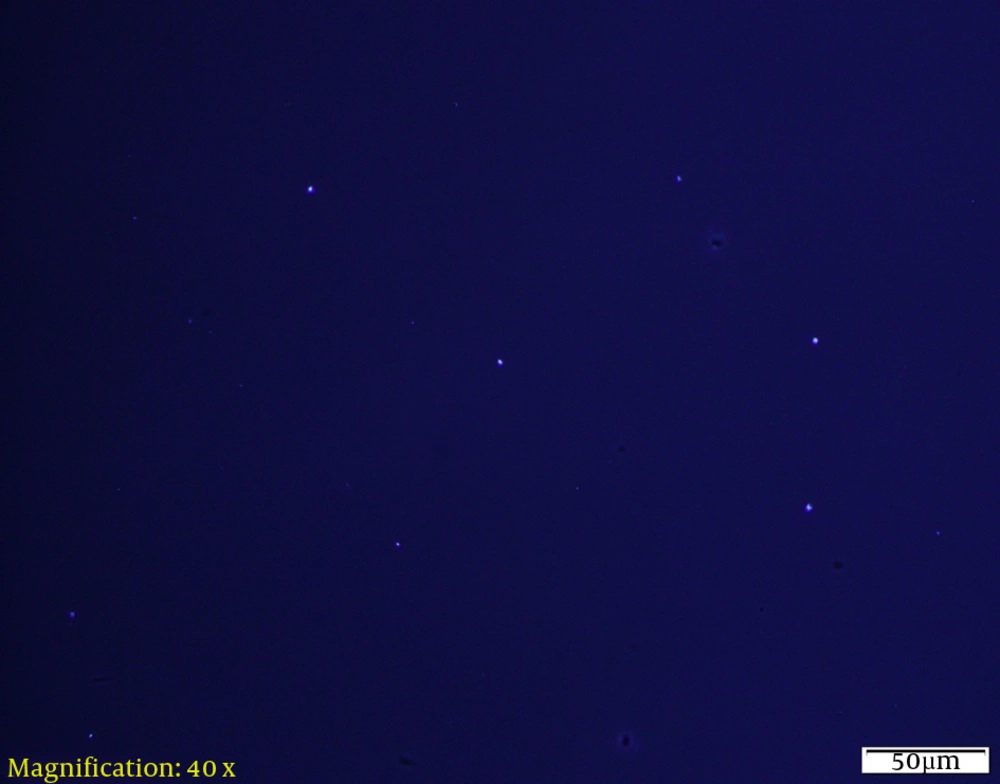
Cross-polarized light microscopy (Olympus BX51U-AN 360, Tokyo, Japan) was utilized to confirm the isotropic nature of MEs. After adding a drop of ME sample between the glass slide and coverslip, observations were made under cross-polarized light. Unlike anisotropic liquid crystals, the isotropic substance does not interrupt the polarized light, thereby establishing a dark field of view (10).
3.7. Preparation of KT MEs
According to the composition presented in Table 1, the ME samples were prepared. To prepare eight formulations of ME, a full factorial design was applied at two levels, consisting of three variables. The most important factors in determining the characteristics of MEs include oil percentage (%oil), water percentage (%W), and S/C mixture. Eight ME formulations, containing low and high concentrations of water (10% and 20%), oil (5% and 50%), and S/C mixture (2:1 and 3:1), were prepared. After adding KT 2% (11) to the oil phase, double-distilled water and S/C mixture were added dropwise to the mixture. At ambient temperature, the mixture was stirred until collecting a transparent mixture (12).
3.8. Droplet Size Measurements
For measuring the ME droplet size, dynamic light scattering was used (SCATTER SCOPE 1 QUIDIX, South Korea) at room temperature.
3.9. Measurements of Viscosity and pH
A digital pH meter (Mettler Toledo SevenEasy, Switzerland) was used to determine the pH of MEs at room temperature. In addition, a viscometer (DV-II+Pro, Brookfield, USA), with spindle No. 34, was used to measure viscosity at 25 ± 0.5°C.
3.10. Differential Scanning Calorimetry (DSC)
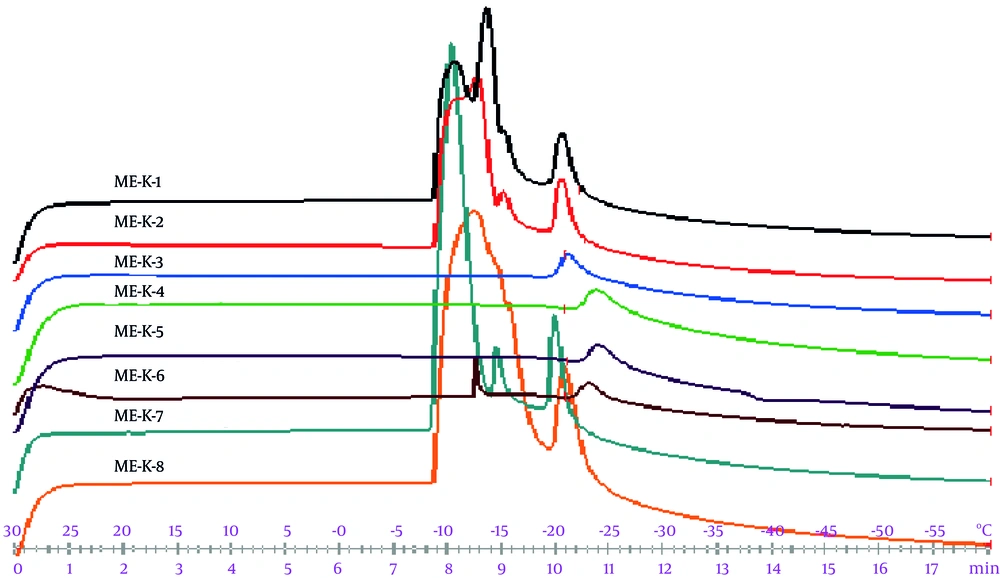
For DSC measurements, a DSC1 Star® system (Mettler Toledo) was used, which was equipped with a cooling system. For preventing water evaporation, nearly 5 - 10 mg of ME samples were added to aluminum pans and then pressure sealed; the reference was an empty hermetically sealed pan. At a scan rate of 5°C/min, the samples were exposed to a temperature range of -50°C to +30°C. In DSC thermograms, enthalpy (∆H) changes were determined based on the exothermic and endothermic peaks (12).
| Formulation | Factorial State | S:C | %Oil | %S + C | %Water |
|---|---|---|---|---|---|
| ME-k-1 | + + + | 3:1 | 50 | 30 | 20 |
| ME-k-2 | + + - | 3:1 | 50 | 40 | 10 |
| ME-K-3 | + - + | 3:1 | 5 | 75 | 20 |
| ME-K-4 | + - - | 3:1 | 5 | 85 | 10 |
| ME-K-5 | - - + | 2:1 | 5 | 75 | 20 |
| ME-K-6 | - - - | 2:1 | 5 | 85 | 10 |
| ME-K-7 | - + - | 2:1 | 50 | 40 | 10 |
| ME-K-8 | - + + | 2:1 | 50 | 30 | 20 |
3.11. Analysis of Drug Release
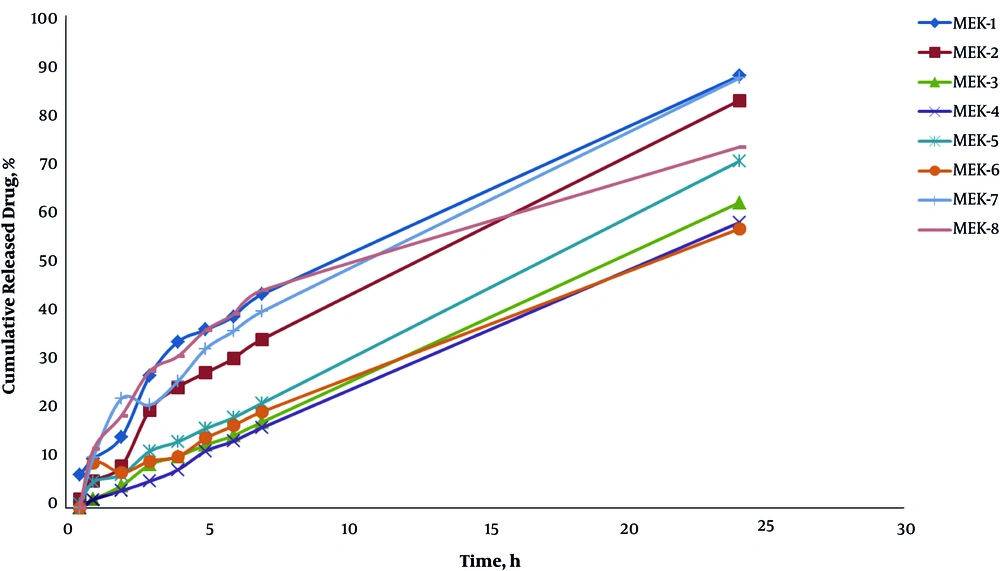
For describing drug release from different formulations, Franz diffusion cells were used with a contact area of 3.46 cm2. After hydrating the cellulose membrane at 25°C in distilled water for 24 hours prior to each experiment, it was clamped between the receptor and donor compartments. After weighing the ME samples (5 g), they were placed on the membrane, and 30 mL of PBS (pH, 7.4) was added to the diffusion cells. During the experiment, externally driven magnetic bars were used to stir the receptor fluid at 200 rpm.
The sample (2 mL) was removed from the receptor compartments at intervals of 0.5, 1, 2, 3, 4, 5, 6, 7, 8, and 24 hours. Afterwards, spectrophotometric analysis was carried out. The sample was instantly replaced with a fresh receptor medium for maintaining sink conditions. A UV spectrophotometer was used at 352 nm for the analyses. In addition, the cumulative percentage of the released drug was plotted against time, and three kinetic models (i.e., zero, first, and Higuchi orders) were used for describing behaviors. Maximum r2 was regarded as the most likely mechanism of release (13).
3.12. Physical Stability of MEs
The temperature stability study and centrifuge stress test were used to examine the physical stability of ME formulations. Based on the ICH guidelines, the formulations were kept for six months at different temperatures (4°C, 25°C, 37°C, and 75% ± 5% RH). They were then examined via monitoring temperature- and time-dependent changes in physicochemical properties, including phase separation, clarity, particle size, and viscosity. In addition, the formulations were centrifuged at 10000 rpm, using a brushless centrifuge system (high-speed MPV-350R, Poland) at ambient temperature for 30 minutes. Following centrifugation, physical instability was determined visually with respect to phase separation (14).
3.13. Permeability Experiments
To describe permeation in vitro, vertical diffusion cells were used with an effective diffusion area of nearly 3.4618 cm2. In addition, PBS (30 mL; pH, 7.4) was added to the receptor compartment. After the skin samples were hydrated, they were mounted between the receptor and donor compartments with the stratum corneum opposite to the donor medium. Every ketorolac ME sample (5 g) was used as the donor phase. After placing the diffusion cells on a heater-stirrer at 37 ± 0.5°C, the receptor phase was continuously stirred at 200 rpm. After removing a 2-mL sample from the receptor medium at each interval, an equivalent volume of PBS was used to replace it. For determining the permeated amount of ketorolac in the samples, a UV spectrophotometer was used at 325 nm. The free drug MEs and 2% ketorolac water solution were used as the negative and positive controls, respectively (5).
3.14. Data Analysis
The cumulative permeated level of ketorolac was measured in every unit area and plotted versus time. The steady-state flux was measured, based on the linear part of the permeation curve slope, and the ketorolac permeability coefficient (KP) was measured in Equation 1:

where Jss and Cv respectively denote the steady-state flux and ketorolac level in the donor medium (4, 5).
The enhancement ratio (ER) was determined to describe the relative improvement of permeability parameters in ME samples with respect to the control (2% ketorolac water solution) parameters. The ER was measured as follows:
Enhancement ratio (ER) = Amount of permeability in ME formulation/amount of permeability in the control
The experiments were carried out in triplicate, and data were analyzed using one-way ANOVA. P < 0.05 is indicative of a significant difference.
4. Results
4.1. Ketorolac Solubility
Table 2 presents the ketorolac solubility.
| Phase Type | Excipient | Solubility (mg/mL) |
|---|---|---|
| Oil | Isopropyl myristate | 6.2 ± 0.12 |
| Surfactants | Tween 80 | 18.4 ± 0.25 |
| Surfactants | Labrasol | 20 ± 0.6 |
| Cosurfactant | Pleurol Oleic | 21.5 ± 0.1 |
| Cosurfactant | PEG400 | 12.1 ± 0.5 |
4.2. Phase Studies
Figure 1 presents the pseudoternary phase diagrams of isopropyl myristate/Tween 80-Labrasol/Pleurol Oleic-PEG400/water. Cross-polarized light microscopy was used to determine the structures of MEs. Figure 2 demonstrates the black background of ME-K-4, as indicated by polarized light microscopy.
4.3. Characterization of Ketorolac MEs
Table 3 presents the mean droplet size, viscosity, polydispersity index (PI), and pH of ketorolac MEs.
| Formulation Code | pH | Viscosity (cps) | Mean Droplet Size (nm) | PI | Mean Droplet Size (nm) After 6 Months |
|---|---|---|---|---|---|
| ME-k-1 | 5.1 ± 0.2 | 41 ± 0.7 | 61.06 ± 1.2 | 0.389 ± 0.01 | 61.12 ± 0.8 |
| ME-k-2 | 5.2 ± 0.2 | 50 ± 0.3 | 37.2 ± 1.3 | 0.436 ± 0.02 | 50.3 ± 0.5 |
| ME-K-3 | 5.4 ± 0.4 | 108 ± 1.2 | 60.86 ± 3.8 | 0.392 ± 0.04 | 59.7 ± 1 |
| ME-K-4 | 5.4 ± 0.3 | 124 ± 1 | 56.16 ± 3.9 | 0.418 ± 0.03 | 57.1 ± 0.3 |
| ME-K-5 | 5.5 ± 0.3 | 117 ± 0.5 | 63.9 ± 3.7 | 0.396 ± 0.05 | 64.2 ± 1.2 |
| ME-K-6 | 5.6 ± 0.1 | 135 ± 0.2 | 28.36 ± 0.7 | 0.382 ± 0.03 | 29 ± 0.2 |
| ME-K-7 | 5.6 ± 0.2 | 50 ± 1.1 | 81.4 ± 1.4 | 0.403 ± 0.01 | 80.8 ± 1.1 |
| ME-K-8 | 5.7 ± 0.1 | 38 ± 0.2 | 42.86 ± 1.3 | 0.394 ± 0.02 | 43.2 ± 0.7 |
Figure 3 demonstrates the release profile of different formulations. In 24 hours of the experiment (R24h), 88.04% of the drug was released in ME-K-1. Table 4 presents the drug release percentage and release kinetics of ME formulations.
| Formulation Code | % Release (2 h) | % Release (24 h) | Kinetic of Release | r2 |
|---|---|---|---|---|
| ME-K-1 | 14.44 ± 0.8 | 88.04 ± 0.17 | first | 0.9968 |
| ME-K-2 | 8.56 ± 0.82 | 83.02 ± 1.52 | Higuchi | 0.9963 |
| ME-K-3 | 4.50 ± 0.62 | 62.20 ± 6.80 | Zero | 0.9989 |
| ME-K-4 | 3.48 ± 0.58 | 58.16 ± 0.06 | Zero | 0.9992 |
| ME-K-5 | 6.77 ± 0.15 | 70.66 ± 0.25 | Zero | 0.9976 |
| ME-K-6 | 7.16 ± 0.24 | 56.87 ± 1.29 | Zero | 0.9909 |
| ME-K-7 | 22.29 ± 0.16 | 87.58 ± 0.24 | Higuchi | 0.9966 |
| ME-K-8 | 18.82 ± 0.14 | 73.54 ± 0.18 | Higuchi | 0.9948 |
Figure 4 indicates the DSC cooling thermograms of ME formulations. In addition, Table 5 presents the enthalpy and transition temperature of MEs.
| Code Formulation | Tm2(°C) | ∆H (mJ/mg) |
|---|---|---|
| ME-K-1 | -11 ± 0.3 | 5.79 ± 0.3 |
| ME-K-2 | -13 ± 0.2 | 60.53 ± 1.1 |
| ME-K-3 | -21 ± 0.5 | 3.41 ± 0.2 |
| ME-K-4 | -25 ± 0.9 | 4.19 ± 0.1 |
| ME-K-5 | -23 ± 0.7 | 2.54 ± 0.15 |
| ME-K-6 | -14 ± 0.1 | 2.41 ± 0.12 |
| ME-K-7 | -12 ± 0.1 | 3.11 ± 0.2 |
| ME-K-8 | -13 ± 0.2 | 8.79 ± 0.3 |
All ketorolac ME formulations showed adequate homogeneity and stability during six months. The average viscosity and droplet size of ME formulations were not significantly different at baseline and after six months (P > 0.05) (Table 3). Table 6 presents the permeability parameters of the samples.
| Formulation | Jss (mg/cm2.h) | Dapp (cm2/h) | P (cm/h) | Tlag (h) | ERflux | ERD | ERp |
|---|---|---|---|---|---|---|---|
| Control | 0.013 ± 0.0002 | 0.043 ± 0.004 | 0.0007 ± 0.00001 | 1.24 ± 0.12 | ---- | --- | --- |
| ME-k-1 | 0.0534 ± 0.002 | 0.297 ± 0.033 | 0.00267 ± 0.0001 | 0.52 ± 0.05 | 3.94 ± 0.13 | 6.49 ± 1.7 | 3.94 ± 0.3 |
| ME-k-2 | 0.0233 ± 0.009 | 0.01 ± 0.007 | 0.0012 ± 0.0004 | 7.2 ± 0.5 | 1.73 ± 0.73 | 0.23 ± 0.14 | 1.72 ± 0.73 |
| ME-k-3 | 0.0272 ± 0.002 | 0.05917 ± 0.03 | 0.00136 ± 0.0001 | 1.12 ± 0.68 | 2.01 ± 0.21 | 1.41 ± 0..96 | 2.01 ± 0.21 |
| ME-k-4 | 0.02545 ± 0.0003 | 0.0239 ± 0.001 | 0.00127 ± 0.00001 | 2.266 ± 0.12 | 1.88 ± 0.05 | 0.55 ± 0.02 | 1.87 ± 0.05 |
| ME-k-5 | 0.0561 ± 0.003 | 0.0742 ± 0.02 | 0.0028 ± 0.0001 | 0.79 ± 0.3 | 4.14 ± 0.16 | 1.68 ± 0.51 | 4.13 ± 0.16 |
| ME-k-6 | 0.0432 ± 0.010819 | 0.1372 ± 0.017 | 0.00216 ± 0.0005 | 1.003 ± 0.5 | 3.19 ± 0.7 | 3 ± 0.3 | 3.18 ± 0.7 |
| ME-k-7 | 0.0585 ± 0.0005 | 0.0585 ± 0.0027 | 0.002925 ± 0.00002 | 0.92 ± 0.04 | 4.32 ± 0.1 | 1.35 ± 0.06 | 4.3 ± 0.1 |
| ME-k-8 | 0.114 ± 0.008 | 0.1323 ± 0.001 | 0.0057 ± 0.0004 | 0.4 ± 0.004 | 8.42 ± 0.7 | 3.1 ± 0.3 | 8.41 ± 0.7 |
5. Discussion
In this study, suitable amounts of surfactant, cosurfactant, and oil were used after determining the concentration of dissolved KT to evaluate ME formulations. With respect to KT solubility in oil, surfactant, and cosurfactant, the best combinations for ketorolac ME preparations included isopropyl myristate (oil phase), Tween 80-Labrasol (surfactant mixture), and Pleurol oleic-PEG400 (cosurfactant mixture). Based on the phase diagrams, the width of the ME region increased with the S/C ratio (15).
In our study, the average viscosity, pH, and droplet size of ME formulations were 38 - 135 cps, 5.1 - 5.7, and 28.36 - 61.06 nm, respectively. Based on the results of ANOVA test, pH had a significant association with the independent variable (%oil) (P < 0.05); in fact, pH increased at lower percentages of the oil phase in some ME formulations.
Based on the ANOVA test, a significant correlation was found between viscosity and independent variables (%oil, %water, and S/C ratio) (P < 0.05). Viscosity improved as the percentage of water, oil, and S/C ratio of ketorolac MEs decreased; this finding is in agreement with a study by Moghimipour et al. (16).
In addition, the results of ANOVA showed an insignificant correlation between the independent variables and the mean droplet size (P > 0.05). Reduction in the particle size was associated with a great increment in the surface area, thereby improving skin permeability and bioavailability (17). PI generally describes the droplet size uniformity. The index value was below 0.5 in our study, and therefore, the droplet size had a narrow distribution in ME formulations; this finding is in line with reports from the literature (10). In addition, ME samples had a pH range of 5.1 - 5.7, which is appropriate for topical products.
According to the drug release profile, 88.04% of the drug was released within 24 hours (R24h) for ME-K-1, which consisted of 20% water, 22.5% surfactant, 50% oil phase, and 7.5% cosurfactant. As indicated by ANOVA, the independent variables (S/C ratio and %oil) had a significant correlation with the amount of released drug in two hours (R2h) (P < 0.05). In ketorolac ME formulations, R2h increased at lower oil phase percentages and S/C ratios.
Furthermore, the amount of released drug in 24 hours (R24h) was significantly associated with the independent variables (%oil and %water) (P < 0.05); in fact, any increase in the oil and water percentage phases increased R24h in the ME formulations. Our results show that ketorolac ME formulations with low levels of oil phase (5%) have a zero-order release mechanism.
Based on the cooling curves, free and bound water was collected at 0°C and -11°C - 25°C, respectively. According to ANOVA, independent variables were significantly associated with the bound melting transition temperature (Tm2) (P < 0.05); an increase in the oil percentage phase was associated with a significant increase in Tm2. In addition, the exothermic peak enthalpy of bound water was affected by the independent variables (P < 0.05). Owing to an increase in the oil percentage and S/C ratio, enthalpy was improved. In this regard, Podlogar et al. (18-20), reported similar behaviors; free water and bound water were respectively collected at -8°C to 0°C and -17°C to -26°C.
Based on the stability studies, a narrow PI was found in ketorolac ME formulations. This parameter indicates the ME vehicle stability. The vehicles were isotropic with transparent dispersions; no phase separation was observed after centrifugation. According to previous research on the stability of MEs, a complex relationship was found between thermodynamic stability and zero interfacial tension (21).
In permeability experiments, the Jss parameter and independent variables (%water, %oil, and S/C ratio) were significantly associated (P < 0.05). An increase in water and oil phase percentage and reduction in S/C ratio caused an increase in Jss parameter in ketorolac ME formulations. The association between the independent variables and permeability coefficient (P) and apparent diffusivity coefficient (Dapp) was insignificant (P > 0.05).
Tlag was also significantly associated with the independent variables (%water and S/C ratio); in other words, an increase in Tlag was related to a reduction in the water phase percentage or an increase in the S/C ratio of ketorolac ME formulations. On the other hand, the independent variables had an insignificant correlation with the permeability coefficient (P) (P > 0.05).
The Jss and Papp parameters in ME-K-8 formulation, containing 20% water, 20% surfactant, 50% oil phase, and 10% cosurfactant were 0.114 mg/cm2.h and 0.057 cm/h, respectively (8.42 and 8.41 times higher than the control, respectively). The ME-K-8 formulation was found to be more suitable for transdermal ketorolac delivery, although further research is necessary.
The higher ketorolac permeability from ME formulations is probably attributed to the amount of cosurfactant, enhancing penetration (22). Therefore, comparison of Jss parameter in ME-K-1 (0.013 mg/cm2.h) and ME-K-8 (0.114 mg/cm2.h), with equal oil and water percentages and different surfactant and cosurfactant contents, may be related to the reduction in the cosurfactant content. Therefore, the amount of cosurfactant affects skin permeability in the formulations.
According to previous studies, the S/C content in ME vehicles majorly influences the skin permeation of hydroquinone (23). Glycols (PEG400) can improve skin permeation through different mechanisms, including lipid and protein extraction, swelling of the stratum corneum, enhancing drug partitioning into the skin, and improving drug solubility in the formulation (22). Tween 80 could accelerate hydrocortisone permeation (24).
The permeability coefficient and flux from the rat skin increased significantly in all ME formulations with different features and compositions. In addition, several studies have confirmed the advantages of ME vehicles as promoters of dermal delivery (23, 25), which can increase skin permeation by changing drug diffusion or partitioning coefficient (22).
The effectiveness of ME formulations in the topical delivery of drugs has been attributed to different mechanisms. Considering the high solubilizing capacity of MEs, drugs can be used at large amounts in ME formulations. Also, the steady-state flux of the drug may be increased from ME formulation, as drug affinity to the internal ME phase may be changed effortlessly to support partitioning into the stratum corneum through a different internal phase (15, 26-28). Based on the findings, ketorolac ME formulations can promote permeation to improve transdermal drug delivery.
5.1. Conclusions
The present findings revealed that the amount of water, oil, and S/C components in the ME formulation majorly affects the physicochemical properties and permeability parameters. The kinetics of drug release from all the selected MEs were roughly described by the Higuchi model and showed a prolonged release compared to the ketorolac solution. The stability of ketorolac improved using the ME system. The studied MEs increased the skin permeation rate and permeability coefficient in rats.


