1. Background
Nanoparticles (NPs) are often reportedly accumulated in testis, spleen, liver, kidneys, and brain of rodents (1). Among the various nanomaterials, special attention has been paid to Titanium dioxide nanoparticles (NTiO2) due to their specific applications in cosmetic products, sunscreen, paints, pharmaceuticals, food colors, kinds of toothpaste, beverages, and food additives (2). Although the daily NTiO2 exposure level is not previously determined for human, the health risk exists for individuals exposed to high NTiO2 level. The toxicity of NTiO2 has been reported on different tissues, including testis, liver, and kidney (1). NTiO2 causes liver damages by reducing antioxidant levels, enhancing oxidative stress, and causing inflammation (3). Exposures to NPs were found to increase the activities of intracellular enzymes such as transaminases and alkaline phosphatase (ALP), indicating loss of cell membrane integrity of hepatocytes (4).
Nowadays, the treatment of liver injury with synthetic antioxidants can cultivate tumor formation as well as result in huge costs because of common hepatic treatments. From this point of view, the application of natural antioxidants has received more attention (5). Quercetin (QCT) is a plant pigment present in vegetables and fruits. It has received considerable attention because of its antioxidant activity against the free radicals in the body and its anti-inflammatory impact (6, 7). According to the previous studies, QCT has hepatoprotective impacts against paracetamol, lead, ischemia, and reperfusion injury (8-10).
2. Objectives
In this study, the impact of QCT on liver toxicity induced by NTiO2 in rats was examined.
3. Methods
3.1. Chemicals
All of the compounds used in the study, such as thiobarbituric acid (TBA), Quercetin, NTiO2, were purchased from Sigma Chemical Co. (St. Louis, Missouri, USA).
3.2. Animals
The study animals were 32 adult healthy female Wistar rats with the age range of 8 - 10 weeks and the weight range of 180 - 200 g. The rats were purchased from the Experimental Research Center at the Ahvaz Jundishapur University of Medical Sciences (AJUMS) in Iran. Our research was approved by the Ethics Committee of AJUMS, with the code of ethics of IR.AJUMS.REC.1396.668. They were maintained in the clean cages with free access to pellet food and tap water at 12 hours of dark and 12 hours of light conditions with humidity of 50 ± 5% at a temperature of 22 ± 3°C.
3.3. Experimental Design
The rats were assigned into four groups with eight members:
• Control: the administration of only saline for 21 days.
• QCT: the administration of 75 mg/kg QCT for 21 days (8).
• NTiO2: the administration of oral 50 mg/kg of NTiO2 initiated on the 7th day after daily administration of 0.2 mL saline and was continued until the study was terminated on day 21.
• QCT + NTiO2: the administration of oral 50 mg/kg of NTiO2 was initiated in the 7th day after daily administration of QCT and continued until the end of the 21st day.
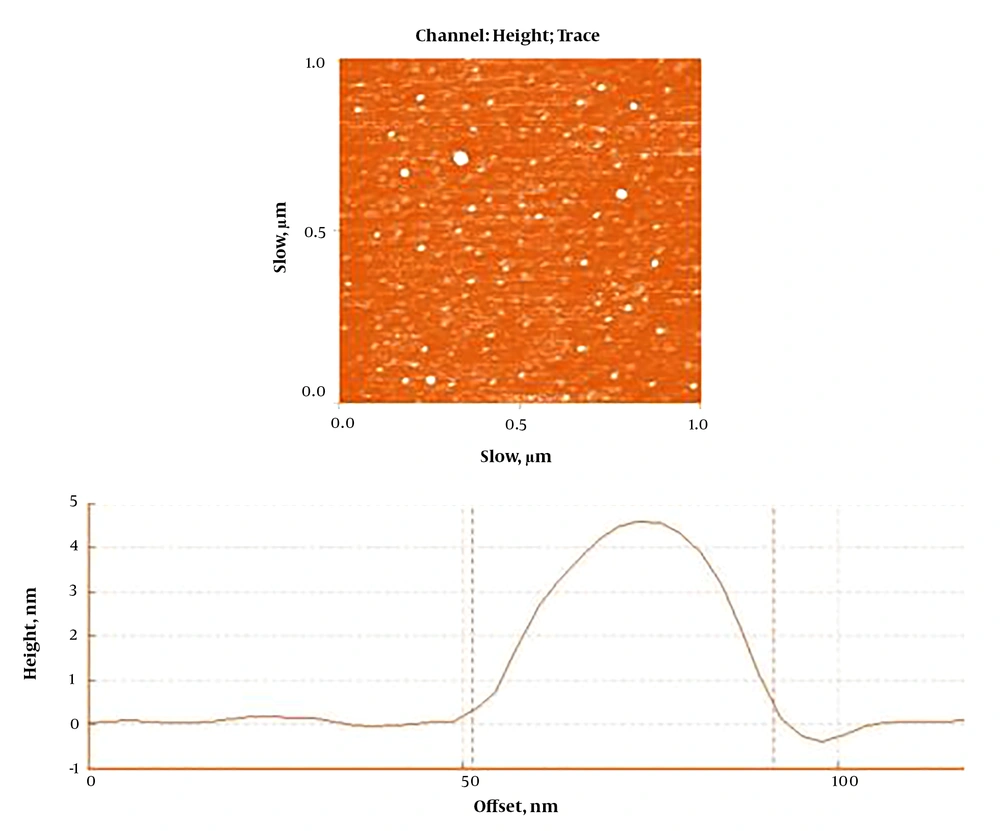
The data from earlier investigations and pilot study were used to determine the doses of NTiO2 and QCT (8, 10). The feeding method was gavage. According to a protocol proposed by Shakeel et al. (9), the NTiO2 (Sigma-Aldrich) stock solution was made in Milli-Q water. An atomic force microscope was employed to explore the morphology and to calculate the particle size of the synthesized NTiO2. Based on the findings illustrated in Figure 1, the NPs had a spherical shape with a uniform particle size of < 100 nm on average. After the last administration, blood samples were collected from the jugular vein under deep anesthesia with ketamine/xylazine (60/6 mg/kg, i.p.). The animals were then killed and their livers dissected, and mall pieces of the hepatic tissue were stored in -80 °C for assessment of the MDA, CAT, and SOD. Other pieces were stored in 10% formalin. The other pieces were homogenized (1/10 w/v) in ice-cold Tris-HCl buffer (0.1 M, pH 7.4).
3.4. Biochemical Tests
The collected blood samples were centrifuged to measure the serum alanine aminotransferase (ALT), aspartate aminotransferase (AST) and alkaline phosphatase (ALP) using commercially available kits (Pars Azmon, Iran).
3.5. Lipid Peroxidation Assay
After centrifugation of taken liver tissues, 500 μL of the supernatant was transferred into 1.5 mL of 2-thiobarbituric acid 10% (TBA). The resulting mixture was then centrifuged for 15 minutes at 7500 × g to obtain the supernatant, 2 mL of which was added by 2 mL of TBA 0.68%, boiled, and cooled down. Each sample was added by 2 mL of n-butanol and centrifuged for 15 minutes at 7500 × g. The absorbance, or optical density (OD), was read for the supernatants using a spectrophotometer at a wavelength of 535 nm (11). Protein content in homogenates was measured as previously described by Bradford assay (12).
3.6. The Activity of SOD Enzyme
The SOD activity was determined using a Ransod kit (SD125; Randox Labs, UK). In this way, an aqueous-soluble formazan dye upon reduction with the superoxide anion is generated. The protein amount in homogenates was measured by Bradford method. The rate of the reduction is related to the xanthine oxidase activity, which is prevented by SOD. The inhibition activity of SOD was measured by a spectrophotometer at 505 nm (11).
3.7. The Activity of CAT Enzyme
A method of (13) was used to measure the activity of CAT enzyme. Protein content in homogenates was determined as previously described. Thus the sample containing CAT catalyzes the conversion of hydrogen peroxide (H2O2) to H2O and O2. The OD of unconverted H2O2 is obtained at a wavelength of 570 nm (12).
3.8. Histological Examinations
Six tissue cross-sections were considered for each animal. The sections were stained by hematoxylin and eosin (H&E) staining, followed by histological examinations in terms of inflammatory cell infiltration, nuclear pyknosis, vacuolization of hepatocytes (fat deposit), and accumulation of red blood cells (RBCs). The leukocyte infiltration and the erythrocyte accumulation were examined in the four groups, grading 0 as normal, 1 as weak, 2 as moderate, and 3 as intense. The average percentage of nuclear pyknosis or vocalized hepatocytes were also determined.
3.9. TUNEL Assay
TUNEL assay was performed by using In Situ Detection Cell Death kit (Roche, 11684795910). After deparaffinization of the tissue sections, the 30-minute incubation was performed in the presence of proteinase K at a temperature of 26°C, and then exposed to the reaction mixture of TUNEL assay inside a humidity chamber at temperature of 37°C for 1 hour. The tissue cross-sections were incubated with Anti-Fluorescein-AP at a temperature of 37°C for 30 minutes, rinsed by deionized water, and exposed by DAB for 5 minutes. The TUNEL-positive cells were those possessing a homogeneous dark brown nucleus.
3.10. Statistical Analysis
The analysis of the collected data reported as mean ± SEM was performed using GraphPad Prism (version 5.04) using one-way ANOVA test and Tukey’s post hoc analysis at statistically significance level of P < 0.05.
4. Results
4.1. Biochemical Tests
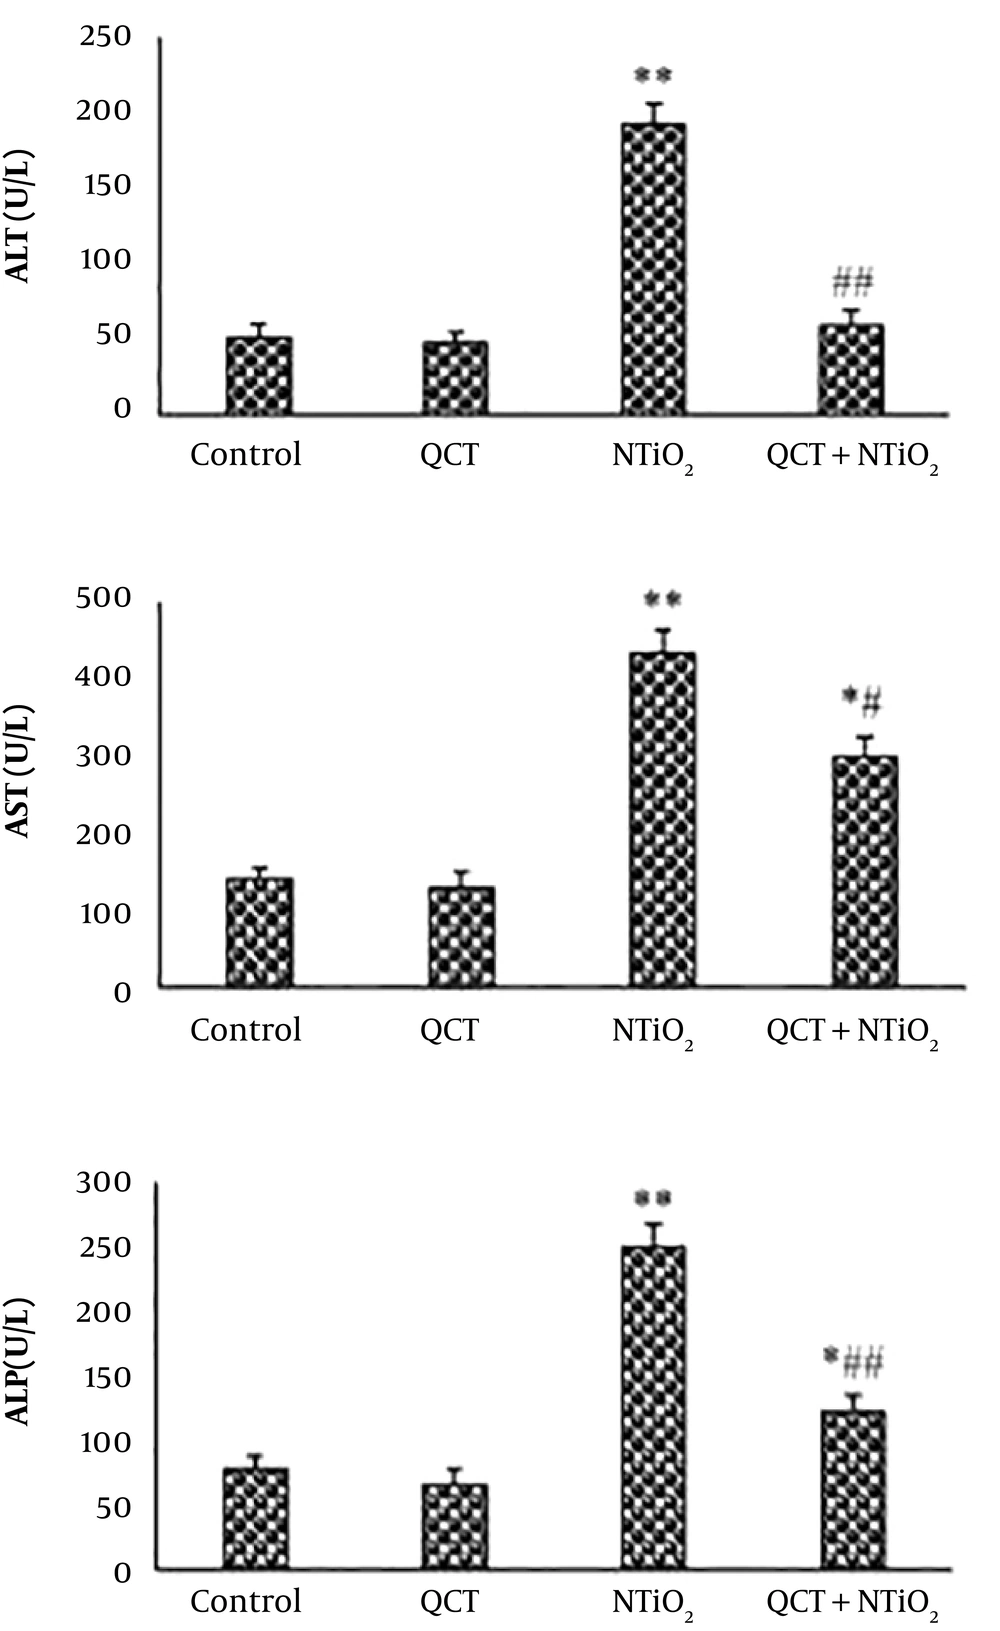
Serum levels of ALP, ALT, and AST were slightly reduced in QCT-treated animals compared to the control group. The serum concentrations of all biomarkers were markedly enhanced in NTiO2 group (P < 0.01). The rats treated with QCT + NTiO2 showed a marked reduction in the level of biochemical parameters compared to those treated with NTiO2 alone (P < 0.01) (Figure 2).
4.2. The Activity of SOD and CAT Enzymes and MDA Level
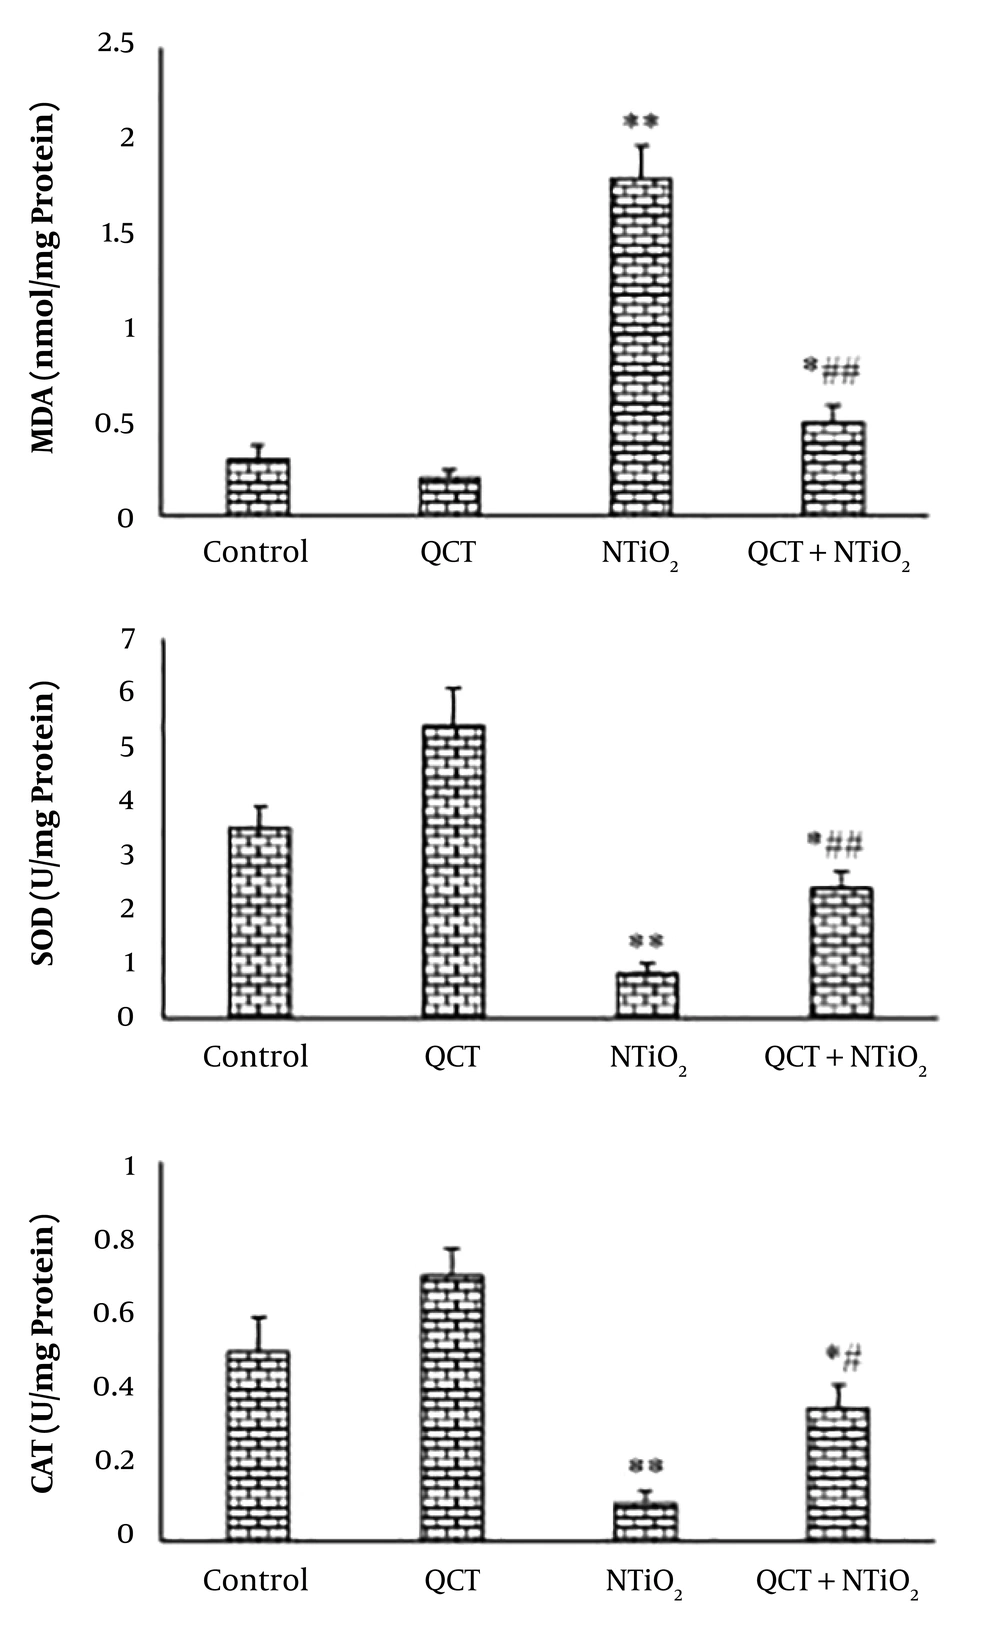
NTiO2 caused a significant elevation in MDA level of the liver tissue in comparison to the control. The elevation of MDA was ameliorated by QCT (P < 0.01). The NTiO2 significantly decreased the activities of SOD and CAT enzymes compared with the control group (P < 0.01). The SOD and CAT activity was increased significantly following the QCT pretreatment compared with the NTiO2 group (P < 0.05). Figure 3 illustrates the NTiO2 and QCT effects on MDA, SOD, and CAT.
4.3. Histological Changes
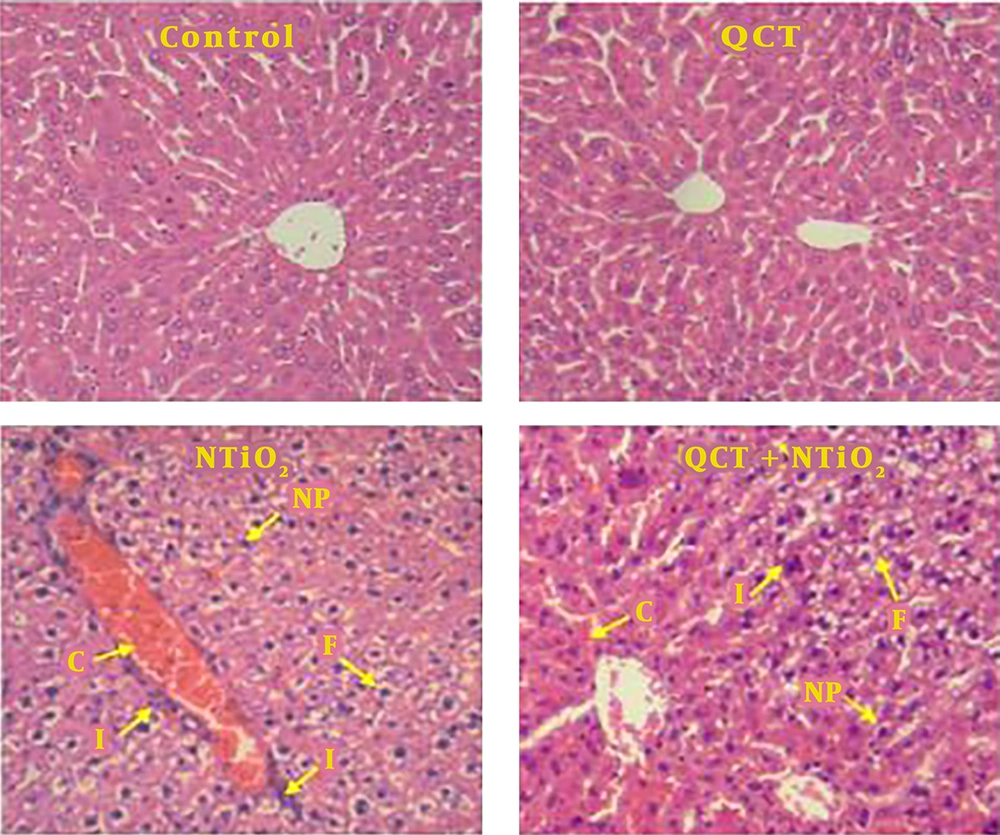
Normal liver structures were observed in the control and QCT groups. In NTiO2-intoxicated rats, congestion of RBCs, inflammatory cell infiltration, nuclear pyknosis, and hepatocytes vacuolization (fat deposit) were observed. These histological changes were markedly reduced by QCT pretreatment (Table 1 and Figure 4).
Light microscopy of H&E stained sections of liver from the control and experimental groups. A, control group; B, QCT group; C, NTiO2-intoxicated group; D, QCT + NTiO2 group. C, congestion of RBCs; F, fat deposit; I, infiltration of inflammatory cells; NP, nuclear pyknosis. Magnifications: × 250.
| Groups | Congestion of RBC | Infiltration of Inflammatory Cells | Nuclear Pyknosis (%) | Fat Deposit (%) |
|---|---|---|---|---|
| Control | 0.07 ± 0.02 | 0.05 ± 0.00 | 0.01 ± 0.00 | 0.03 ± 0.00 |
| QCT | 0.06 ± 0.00 | 0.04 ± 0.00 | 0.02 ± 0.00 | 0.02 ± 0.00 |
| NTiO2 | 2.12 ± 0.43** | 1.33 ± 0.24** | 26.3 ± 3.65** | 18.9 ± 3.20** |
| QCT + NTiO2 | 0.56 ± 0.16*## | 0.43 ± 0.15*# | 12.45 ± 2.21**# | 4.57 ± 1.52**## |
aValues are expressed as mean ± SD.
b*P < 0.01, **P < 0.001, #P < 0.05, ##P < 0.01; * and # symbols indicate the comparison of the control and NTiO2 groups, respectively.
4.4. TUNEL Staining
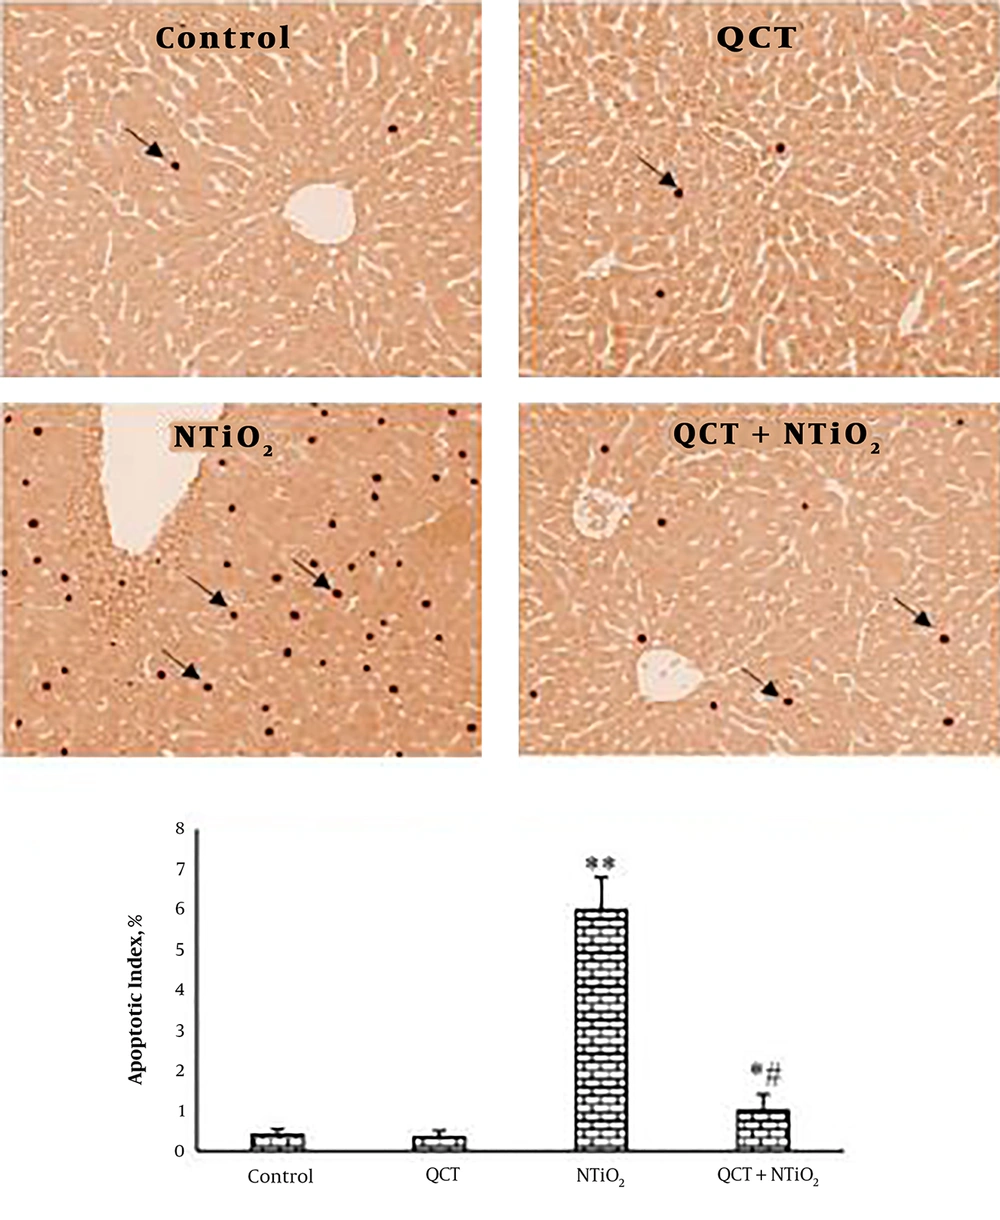
As shown in Figure 5, TUNEL-positive staining was seen in a few hepatocytes in the QCT and control groups. In the group exposed to NTiO2, there was a significant elevation in the TUNEL-positive cells (P < 0.001). In the QCT + NTiO2 group, the index of apoptosis was markedly reduced in comparison to the NTiO2 group (P < 0.001).
TUNEL-positive cells in the liver sections (magnifications: × 250) and apoptotic index. A, control group; B, QCT group; C, NTiO2-intoxicated group; D, QCT + NTiO2 group. Arrows indicate TUNEL-positive cells. Values are expressed as mean ± SD for 8 rats. * P < 0.05, ** P < 0.01, # P < 0.05, ## P < 0.01; * and # symbols indicate the comparison of the control and NTiO2-intoxicated groups, respectively.
5. Discussion
According to the results of our research, the NTiO2-induced liver damage was prevented by QCT in rats. NTiO2 markedly enhanced the levels of ALT, AST, and ALP. Increasing the level of ALT and AST is the main indices, reflecting hepatocytes damage because of these enzymes released from hepatocytes into the bloodstream after liver toxicity. The level of ALP reflects the functional efficiency of the liver, and is dramatically enhanced in response to any disease of the liver (13). The reversal of these enzymes levels by QCT indicates that QCT can stabilize hepatocyte membrane, and hence block the leakage of biomarkers into the circulation. Bona et al. showed that a marked increase in serum levels of AST and ALT was reversed with QCT after inhalation of chloroform in rats (14). According to the results, NTiO2 markedly destructed the lobular structure, increased fat deposit in hepatocytes, elevated congestion of RBCs, enhanced leukocytes infiltration, and increased nuclear pyknosis percentage in liver tissue. These findings were in line with other studies showing the histological changes induced by NTiO2. Ma et al. showed that NTiO2 induced histological alterations, including vascellum congestion, fatty change, and apoptosis in the liver tissue (15). In this study, QCT improved the lobular structure, decreased fat deposit in hepatocytes, reduced congestion of RBCs, and suppressed inflammatory cell infiltration. The improved structural changes of the liver with pretreatment of QCT was accompanied by reducing biomarker levels. QCT effectively ameliorated lead-induced structural changes and infiltration of leukocyte in rat liver (7). In this study, the NTiO2 significantly elevated the MDA content in the liver tissue, while SOD and CAT levels were markedly reduced. Previous studies demonstrate that NTiO2 induces oxidative stress and lipid peroxidation in the liver of rodents. Shukla et al. showed that NTiO2 caused apoptosis and DNA toxicity in hepatocytes (16). The role of oxidative stress in the liver toxicity induced by NPs was reported by Liang et al. (17). One of the markers for the intensified peroxidation process is the MDA content (18). The QCT attenuated the NTiO2-induced increase in the hepatic MDA content. Boadi et al. demonstrated that QCT reduced lipid peroxidation (19). Gnoni et al. also showed that QCT prevented the generation of triacylglycerol and fatty acid in hepatocytes of rats (20). As mentioned above histological analysis of our study also showed that QCT effectively reduced the fat deposit of hepatocytes. The markedly reduced in SOD and CAT levels point out the liver injury in the rats exposed to the NTiO2. While, pretreatment with QCT caused a marked increase in the level of these enzymes, which revealed the antioxidant property of the QCT. Gonzalez-Esquivel et al. showed that QCT altered the hepatic levels of MDA, antioxidant enzyme activities in male rats exposed to NTiO2 (21). In a study by Liu et al. in 2013, the ROS generation was suppressed by the QCT, followed by an increase in the total antioxidant capacity in the liver of rats (22). El-Faras et al. demonstrated that the antioxidative property of QCT played an important role in its hepatoprotective impacts on paracetamol-induced liver toxicity (8). Ma et al. demonstrated that the prevention of CCl4-induced inflammation by QCT was due to its antioxidant property (23). The marked decrease in structural changes of the liver and the biomarker levels with pretreatment of QCT was accompanied by significant reducing in oxidative stress.
Oxidative stress triggers various intracellular events such as apoptosis (24). As shown in the results, NTiO2 significantly increased the apoptotic index in the hepatocytes. Wang et al. reported that NTiO2 induced DNA damage, and apoptosis in human lung cancer A549 cells (25). Park et al. also reported NTiO2 induced apoptosis and oxidative stress in a bronchial epithelial cell line (26). NTiO2 induced apoptosis in mouse epidermal (JB6) and human bronchial epithelial (BEAS-2B) cell lines (27). Alarifi et al. have also demonstrated apoptotic effects of NTiO2 in the liver of rats (28). In the present study, QCT intensively decreased the apoptotic index in the liver of rats exposed to NTiO2. Ansar et al. showed that QCT protected the liver against DNA damage induced by acrylamide (29). The QCT inhibits apoptosis in alcohol-induced liver toxicity (30), prevents apoptosis in hepatocytes of diabetic rats (31), and suppresses the apoptosis in mesangial cells of kidney exposed to H2O2 (32). Anti-apoptotic impacts of QCT against traumatic brain injury were also reported by Yang et al. (33). According to the results, the decrease in apoptosis by pretreatment of QCT was accompanied by reducing biomarker levels and oxidative stress in the liver.
5.1. Conclusions
In summary, the present study suggests that QCT suppresses liver toxicity induced by NTiO2 in rats. These results suggest that QCT may have potential clinical applications for treating hepatotoxicity induced by metal NPs.

