

1. Background
Obesity stands as one of the most pressing global health challenges. Both in developed and developing nations, the proliferation of overweight and obesity is fueled by lifestyle changes and poor dietary habits characterized by the consumption of high-fat foods and reduced physical activity (1). Obesity contributes to elevated blood lipid levels, hypertension, atherosclerosis, and an increased risk of insulin resistance and type 2 diabetes, all of which pose a considerable economic burden (2). Skeletal muscle, the body’s largest organ, secretes various factors known as myokines. These myokines are released in response to physical activity and play a regulatory role in muscle function and other organs (3, 4).
The discovery of myokines has deepened our understanding of the impact of exercise training, revealing that muscles have the capacity to communicate with other organs, including bones, the liver, adipose tissue, and the brain (5). Myonectin, one such myokine, is secreted by skeletal muscles and exerts a significant influence on lipid metabolism and glucose regulation (6). Myonectin’s expression and circulating levels are influenced by factors such as diet, metabolism, and physical activity.
In the realm of nutrition, myonectin serves as a metabolic regulator. Myonectin is secreted by skeletal muscles and exerts its effects on adipocytes and liver tissue, influencing lipid metabolism (3). Recent research has delved into the impact of exercise training and nutrition on myonectin expression (7, 8).
Seldin et al. demonstrated that starvation leads to the suppression of myonectin, with its levels significantly increasing upon re-feeding. Conversely, in cases of obesity with dietary influences, both messenger ribonucleic acid (mRNA) levels and circulating myonectin levels decrease. Therefore, myonectin can be regarded as a nutrient-sensitive myokine that plays a role in the regulation of uptake and storage (8). Given the distinct molecular and genetic adaptation mechanisms induced by strength and endurance training, each type of physical activity activates specific cellular signaling pathways and genes (9).
Regarding the impact of exercise on myonectin, physical activity enhances myonectin expression by improving insulin resistance and influencing myocyte metabolism (10). In a 2012 study, Seldin and Wong investigated the effect of voluntary exercise on myonectin gene expression in adult male rats, reporting an increase in myonectin gene expression and circulating levels (11). Conversely, a 2014 study by Patterson et al. examined the effect of aerobic treadmill running for 9 weeks (5 days per week) on myonectin levels in obese and lean Zucker mice, indicating a significant reduction in the myonectin index due to aerobic exercise, irrespective of obesity status (12). Additionally, in 2015, Kazemi and Mizani compared the impact of 8 weeks of concurrent exercise (combining endurance and strength training 3 sessions per week) in elderly women. They observed no significant difference in myonectin levels and plasma insulin levels between the training and control groups but did observe a significant reduction in the insulin resistance index in the training groups (13).
Given the outcomes of prior research, this study aimed to address the question of whether there is a disparity in the effects of 8 weeks of aerobic and resistance training on serum myonectin levels and insulin resistance in overweight and obese women.
2. Methods
2.1. Patients
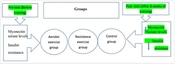
This study employed an applied, semi-experimental, and double-blind experimental design. In this study, 3 experimental groups were compared to each other using a pre-test and post-test design. The statistical sample for this study comprised 45 overweight and obese women aged between 30 and 50 years from Ilam, Iran. The subjects were selected through available and targeted sampling, and subsequently, they were randomly allocated to 3 groups: Control (CON), aerobic exercise (AR), and resistance exercise (RT) (Table 1, Figure 1).
| Groups and Stages | Age (y) | Height (cm) | Weight (kg) | BMI (kg/m2) |
|---|---|---|---|---|
| RT | ||||
| Pre-test | 41.08 ± 3.66 | 169.29 ± 4.34 | 79.22 ± 5.48 | 27.79 ± 1.14 |
| Post-test | - | - | 78.16 ± 2.21 | 27.32 ± 1.06 |
| AT | ||||
| Pre-test | 41.63 ± 3.28 | 166.14 ± 6.21 | 73.35 ± 4.80 | 26.67 ± 0.68 |
| Post-test | - | - | 70.14 ± 3.25 | 25.50 ± 1.08 |
| Con | ||||
| Pre-test | 40.41 ± 2.36 | 168.81 ± 3.24 | 82.19 ± 5.71 | 29.14 ± 1.21 |
| Post-test | - | - | 83.47 ± 3.22 | 29.59 ± 1.48 |
Descriptive Characteristics of the Study Subjects

A diagram related to participation and grouping
The sample size for each group was determined using MedCalc software (version 10.0.2.0), taking into account a significance level of 5% and a test power of 0.8, resulting in approximately 15 individuals per group. The normality of the data was assessed using the Shapiro-Wilk statistical method during the statistical analysis.
2.2. Exercise Protocol
2.2.1. Aerobic Training Group
The aerobic training program spanned 8 weeks, with 3 sessions per week focusing on running. In the initial session, the participants ran for 25 minutes at an intensity set at 50% of their maximum heart rate. As participants’ physical fitness levels improved and in accordance with the overload principle, the exercise intensity and duration gradually increased. By the end of the eighth week, the maximum heart rate reached 70%, and the exercise duration extended to 45 minutes. Additionally, the participants performed a 10-minute warm-up at the start of each session and a 5-minute cool-down at the end of each training session (Table 2) (14).
| Order of Weeks | Intensity (Heart Rate); % | Period (min) |
|---|---|---|
| 1 - 2 | 50 - 55 | 25 - 30 |
| 3 - 4 | 55 - 60 | 30 - 35 |
| 5 - 6 | 60 - 65 | 35 - 40 |
| 7 - 8 | 65 - 70 | 40 - 45 |
Protocol of Aerobic Exercises
2.2.2. Resistance Training
The training program encompassed exercises targeting both the upper body (including chest presses, pulley-based underarm stretches, and forearm and tricep exercises with a barbell) and the lower body (hamstring and quadriceps exercises using a pulley) and sit-ups to strengthen the abdominal muscles and the trunk. These exercises were performed in a circuit fashion, adhering to the overload principle.
During the first and second weeks, the participants exercised at an intensity level equivalent to 60 - 65% of their 1-repetition maximum (1RM) for three sets, with each set consisting of 14 to 16 repetitions (with 1 - 2 minutes of rest between repetitions and 3 - 5 minutes of rest between sets). Subsequently, every two weeks, the training intensity was increased by 5% of the 1RM. At the end of each two-week interval, the participants’ 1RM was recalculated, and the training program was adjusted based on this new 1RM (Table 3). Additionally, a 10-minute warm-up routine was performed at the beginning of each training session, and a 10-minute cool-down period was included at the end of each session (14).
| Order of Weeks | Intensity (%1RM) | Period (Times) | Repetitions | Rest Between Periods (min) | Rest Between Cycles (min) |
|---|---|---|---|---|---|
| 1 - 2 | 50 - 55 | 3 | 14 - 16 | 1 - 2 | 3 - 5 |
| 3 - 4 | 55 - 60 | 3 | 12 - 14 | 1 - 2 | 3 - 5 |
| 5 - 6 | 60 - 65 | 3 | 10 - 12 | 1 - 2 | 3 - 5 |
| 7 - 8 | 65 - 70 | 3 | 8 - 10 | 1 - 2 | 3 - 5 |
Resistance Training Protocol
2.3. Biochemical and Physiological Measurements of Variables
In each blood sampling, a portion of the blood samples was collected in tubes containing ethylenediaminetetraacetic acid (EDTA) anticoagulant. Following centrifugation (12 minutes at 3000 revolutions per minute using a Hettich centrifuge from Germany) and plasma separation, blood glucose was measured photometrically. Plasma myonectin levels were measured through an enzyme-linked immunosorbent assay (ELISA) kit manufactured by Hangzhou Steve Form, China, with a sensitivity of 0.01, utilizing the radioimmunoassay (RIA) method. Blood glucose levels were measured with a specialized kit from Pars Azmoun Company, Iran; nevertheless, plasma insulin levels were measured using a dedicated kit from Diametra, Italy, featuring a sensitivity of 0.01. The insulin resistance index was calculated using the following homeostatic model assessment of insulin resistance (HOMA-IR) equation:
To establish the cutoff point for insulin resistance, THE samples were selected based on the criteria, including non-diabetic (fasting blood sugar below 126 mg/dL), body mass index (BMI) equal to or above 25 kg/m2, and no history of blood pressure or metabolic diseases. In this cohort, the 90th percentile of the HOMA distribution was considered the threshold for insulin resistance in the studied population (2.3 mUmmol/L2) (13). Subsequently, the remaining serum samples were preserved in 0.5 ml microtubes at -80ºC in a freezer for future research purposes.
2.4. Ethical Considerations
This study has received ethical approval under the code IR.IAU.ILAM.REC.1401.046. This study was also registered at the Iranian Registry of Clinical Trials.
2.5. Statistical Analysis
Statistical analyses included the Shapiro-Wilk test, two-way analysis of variance in repeated measures, and Bonferroni’s post hoc test, all performed at a significance level of P < 0.05.
3. Results
The results of the two-way analysis of variance with repeated measurements concerning the changes in myonectin levels before and after the intervention revealed a significant difference in the effects of time (P = 0.016), group (P = 0.04), and interaction (P = 0.001) (Table 4).
Changes in Myonectin Serum Levels Before and After the Intervention
The post hoc test results indicated a significant increase in serum myonectin levels in both the aerobic training group (P = 0.024) and the resistance training group (P = 0.002) compared to the control group (Figure 2).
.")
Myonectin serum mean ± standard deviation in study groups (* indicates that there is a significant difference).
Additionally, the results of the two-way analysis of variance with repeated measurements concerning changes in insulin resistance before and after the intervention demonstrated a significant difference in the effects of time (P = 0.001), group (P = 0.024), and interaction (P = 0.001) (Table 5). The post hoc test results indicated a significant decrease in insulin resistance in both the aerobic training group (P = 0.028) and the resistance training group (P = 0.001) compared to the control group (Figure 3).
Changes in Insulin Resistance Levels Before and After the Intervention
.")
Insulin resistance mean ± standard deviation in study groups (* indicates that there is a significant difference).
4. Discussion
The results of the present study indicated a significant increase in serum myonectin levels in both the aerobic and resistance training groups, compared to the control group, with no significant difference observed between the aerobic and resistance training groups. Myonectin, primarily expressed in skeletal muscles, is stimulated by physical activity and dietary factors. Therefore, the elevation in myonectin levels following muscle contractions can activate cellular cascades and increase energy requirements during contractions (15). According to Seldin and Wong, exercise training leads to an increase in calcium and cyclic adenosine monophosphate (cAMP) levels due to muscle contractions. The surge in calcium levels within muscle cells, induced by ionomycin, results in a substantial elevation in myonectin levels. Simultaneously, an intracellular increase in cAMP is instigated by forskolin and epinephrine. It is possible that this calcium and cAMP secretion process contributes to the increase in myonectin levels, although further studies are required to clarify this mechanism (11).
In response to exercise, myonectin enhances the expression of CD36, fatty acid transfer proteins (FATP), and fatty acid binding proteins (FABP) in liver and fat cells, consequently promoting free fatty acid (FFA) absorption (16). Myonectin’s association with insulin resistance is well-documented, with circulating FFAs inducing insulin resistance (17). Consequently, the rise in serum myonectin levels leads to increased FFA absorption, ultimately reducing insulin resistance (18). Exercise training plays a pivotal role in glucose uptake by muscles without insulin intervention, with GLUT4 playing a crucial role in this process. As exercise training and adaptation continue, insulin receptors become more responsive to lower insulin levels, leading to decreased blood sugar levels and diabetes prevention (19).
Hashemi et al.’s study revealed a significant negative correlation between circulating myonectin levels and insulin resistance, with insulin resistance serving as an independent predictor for myonectin levels (20). Myonectin also contributes to liver autophagy by activating the PI3K/AKT/mTOR pathway (21). Inhibiting autophagy protects against obesity and insulin resistance by promoting brown adipose tissue development (22). Consequently, it is plausible that myonectin might prevent obesity and insulin resistance by inhibiting autophagy. Moreover, physical activity and muscle contractions modulate the autophagy process by enhancing myonectin expression through the activation of the PI3K/AKT/mTOR pathway. The impact of myonectin on glucose and fat metabolism has opened up potential therapeutic avenues for researchers. Nevertheless, it remains unclear whether the increase in myonectin levels is a direct consequence of exercise or an outcome of enhanced glucose and fat absorption immediately following physical activity (23).
The results of the present study also showed a significant reduction in insulin resistance in both the aerobic and resistance training groups, compared to the control group, with no significant difference observed between the two aerobic and resistance training groups. Exercise training has been demonstrated to improve and regulate metabolic status by reducing plasma lipids and blood glucose, decreasing oxidative stress, and mitigating insulin resistance (24). Several mechanisms contribute to the enhancement of insulin sensitivity following exercise training. These mechanisms include enhanced insulin precursor signaling, increased glucose transporter mRNA and protein expression, elevated levels of glycogen synthase and hexokinase, reduced release, and heightened clearance (absorption) of FFAs, in addition to increased glucose uptake from the bloodstream into muscles, and finally, the increased change in muscle tissue (25).
Among the above-mentioned mechanisms, glucose transport across the cell membrane and its subsequent intracellular metabolism, initiated by hexokinase, is of particular importance (26). Glucose transport is facilitated by GLUT4, and exercise training prompts the translocation of GLUT4 from intracellular stores to the plasma membrane and sarcolemmal transverse channels. The regulation of glucose transport is influenced by signals associated with the excitation-contraction coupling. Notably, an increase in Ca++ levels within the sarcoplasmic reticulum is a crucial signal in this process (27). Moreover, feedback signals reflecting the state of muscle cell metabolism, including AMP, phosphocreatine (PCr), and glycogen, also regulate glucose transport (28).
Exercise training leads to structural and biochemical changes in muscles, resulting in increased maximum oxygen consumption (e.g., increased oxidative enzyme activity and capillary density), thereby enhancing the glucose transport process and improving insulin resistance (28). Aerobic exercise induces an augmentation in vascular density, improvements in maximum oxygen consumption, and increased oxidative enzyme activity in skeletal muscles. Furthermore, aerobic exercise heightens muscle sensitivity to insulin, reducing the amount of insulin required to regulate blood glucose post-exercise compared to pre-exercise levels. This improvement in insulin sensitivity is closely tied to the capacity of insulin to bind to each muscle cell’s receptors (29).
It is important to acknowledge certain limitations of this study, including the inability to control the genetic characteristics of subjects, challenges in accurately monitoring activities outside the subjects’ training hours, and the inability to regulate the subjects’ morale and motivation levels during the exercise program. Given that the study involved obese or overweight subjects, future research could consider involving individuals with diabetes, metabolic syndrome, or cardiovascular diseases and comparing the outcomes to those of the current study.
4.1. Conclusions
The findings of this study revealed that 8 weeks of separate aerobic and resistance training in overweight or obese women elevated serum myonectin levels and improved insulin resistance. The aforementioned outcomes indicate an enhancement in metabolic status, contributing to overall health improvement.
4.2. The Whole Message of This Study
Considering that both aerobic and resistance exercises have elevated serum myonectin levels and improved insulin resistance in overweight and obese women, individuals with obesity or overweight conditions should engage in exercise training to control obesity-related diseases, including diabetes and cardiovascular disorders.
