


1. Background
Diabetes mellitus (DM) is a metabolic disorder marked by elevated blood glucose levels caused by inadequate insulin production or insulin resistance (1). The two most prevalent forms of diabetes are type 1 and type 2 (2). Insulin resistance and relative insulin insufficiency cause type 2 diabetes mellitus (T2DM). The individual disease burden of patients owing to macro-and microvascular effects and the costs to the health system is substantial due to its high prevalence and incidence (3). Diabetic patients are at a greater risk of having several life-threatening serious health issues, resulting in higher medical costs, a worse quality of life, and a higher death rate.
T2DM affects 1.2 % to 14.6 % of Asians, 4.6 % to 40% of Middle Easterners, and 1.3 % to 14.5% of Iranians (4). Diabetes is one of the non-communicable diseases (NCDs) in developing countries, including Iran. It has been considered one of the leading causes of mortality and morbidity (5). In a previous study in Tehran, Iran, the prevalence of T2DM in individuals aged ≥ 60 years was 14.4%. (6). By the year 2030, it is estimated that the number of diabetic Iranian individuals will be 9.2 million (7). In 2015, 9309 individuals died because of diabetes in Iran (8). In line with the global effort to reduce the burden of diabetes, in Iran, the National Diabetes Prevention and Control Program (NPPCD) has made great strides toward effective prevention and continuous care of diabetic patients since 2004. However, despite the ongoing efforts of the NPPCD, the burden of diabetes remains poorly characterized among patients with diabetes in Iran. Thus, it is important for health providers to have an overview of each part of the country's T2DM current trends along with insights for the future (7). In a cross-sectional study conducted in the urban and rural populations of Semnan province in 2009, the prevalence of diabetes and impaired fasting glucose (IFG) was estimated to be 9% and 15.4%, respectively (9).
2. Objectives
Because of the relatively high prevalence of diabetes and IFG in Semnan province, the goal of this study was to provide relevant information on the incidence of diabetes in Semnan province during the years 2015 - 2020 and the prediction of its incidence until 2025 so that relevant authorities can develop programs for diabetes screening and control that are both economically and socially beneficial.
3. Methods
The Box & Jenkins model [an autoregressive integrated moving average (ARIMA)] was used to predict the incidence of diabetes in this longitudinal research conducted in 2021. The study's protocol was first accepted by Semnan University of Medical Sciences (IR.SEMUMS.REC.1398.172). All data were compiled using patients’ medical records from Semnan University of Medical Sciences and Shahroud University of Medical Sciences between 2015 and 2020.
Each month of the study period was used as a time variable in this investigation. The census method was used for sampling. It can be calculated based on population estimates (census statistics for the same year) (10). Every five years, the statistics of the population at risk are calculated by the statistical experts of the Semnan and Shahroud health centers.
From 2015 to 2020, the number of diabetic patients each month was estimated using a monthly time series. By charting the data time series and characterizing the frequency of diabetic patients, the structure of this time series was investigated.
Following data processing to generate stationary time series and a more comprehensive evaluation of this assumption using the Dickey-Fuller test, the model parameters were obtained using autocorrelation function (ACF) and partial autocorrelation function (PACF) graphs.
The time series were decomposed using the moving average method to study the time series parameters, such as trend, seasonal influence, and a random component. Using Akaike information criterion (AIC) statistics, ARIMA (3, 1, 1) and ARIMA (3, 1, 4) were chosen as the best fits for suggested models (the model with the lowest amount of AIC). Finally, ARIMA (3,1,4) was used to forecast the frequency of referrals of diabetic patients up to 2025.
4. Results
Table 1 demonstrates the overall T2DM patients in Semnan province, indicating the rise in new cases from 2015 to 2020.
| Year | Type 2 Diabetic | |
|---|---|---|
| Frequency | Annual Incidence Rate (per 100000 Persons) | |
| 2015 | 75203 | 11611.9 |
| 2016 | 107857 | 16208.2 |
| 2017 | 129726 | 18654.6 |
| 2018 | 143344 | 21754.6 |
| 2019 | 156817 | 23462.1 |
| 2020 | 165143 | 24027.3 |
As shown in Figure 1, the time series mean was almost stationary. The time series has an increasing trend, but there is no seasonal or periodic pattern (Figure 1). The average moving technique is used to more accurately assess time series components, such as trend, seasonal impact, and random component (Figure 1).

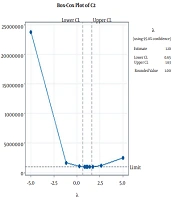
A, Time series graph of total cases with diabetes in Semnan province from 2015 – 2020; B, Decomposition of structural time series; C, A graph of parameter λ estimate in Cox-Box transformation; D, From 2015 through 2020, the transformed observations are shown as a time-series graph.
The time series indicates a modestly increasing trend when broken down structurally. It was shown that 11611.9 people in 2015 and 24027.3 people in 2020 in every 100000 people in Semnan province have T2DM for the first time. The stationarity of the mean of a time series may be affected by an upward trend. A first-order differential operator was employed to establish stationarity in the mean of a time series. The observations were transformed to get the Cox-Box transformation parameter, which was determined to be λ = 2 (Figure 1). The Cox-Box transformation in the λ = 2 orders must be used for variance stabilization, as shown in Figure 1.
In order to apply the required variance and mean stationary transformations, the requisite variance transformations must be done first, followed by the differential operator for mean stationary. Figure 1 shows the time-series graph for the transformed observations after using the noted transformations (Figure 1). The trend has been eliminated, and the converted observation's time series is stable in mean and variance (Figure 1). The Cox-Box transformation was used again for a more accurate assessment, giving λ = 1, indicating that variance has stabilized and that no further modification is required (Figure 2). Figure 2 illustrates the decomposition of the adjusted data into structural time series using Cox-Box and the first-order differential operator (Figure 2).

A, After the transformation, parameter λ estimation in the Cox-Box transformation; B, Decomposition of structural time series after transformations.
The data trend was removed after the Cox-Box transformation and the first-order differential operator, and the transformed data's time series became stationary. The Dickey-Fuller test was used to assess the modified data time series. The Dickey-Fuller test (-7.3337, P = 0.01), indicating that the converted data is stationary.
The moving average and autoregressive degrees were calculated using ACF and PACF graphs (Figure 3). Considering the ACF and PACF, we can see that the ACF is cutting off from the mean at lags one and four, and PACF is taking off in lag three; therefore, models MA (1) and MA (4) are suitable for data fitting.

The transformed data's ACF and PACF graphs.
4.1. Model Selection
The ARIMA (3,1,1) and (3,1,4) models appear to be adequate for fitting the data, based on the results shown in Figure 3. To choose the optimal model, the Akaike coefficients were compared [2149/22 for ARIMA (3,1,4) and 2150/61 for ARIMA (3,1,1)].
The ARIMA (3,1,4) model has the lowest AIC and is the best fit to the data, according to a comparison of the AICs of the suggested models for fit to the data. The model parameters were then estimated using the maximum likelihood method. Finally, the residuals were evaluated intuitively using the Ljung-Box test to assess the proposed model's degree of fit (Figure 4). Other residuals in the ACF graph do not exceed the mean value after the initial delay of the ACF value, as shown in Figure 4, and the correlation of zero for all delays, according to the PACF graph. Apart from these two figures, the Ljung-Box significance values are greater than 0.05, indicating that the residuals for all delays are uncorrelated. As a consequence, residuals may be checked using the suggested fitted model.

The following residual plots were generated from the transformed data.
4.2. Forecasting
The predicted number of T2DM patients in all months of 2020 to 2025 is predicted through the ARIMA model (3,1,4), and the estimated distance between the months of each year with a 95% and 80% confidence interval in each year has been shown in Table 2. In addition, the time series prediction of the ARIMA model (3,1,4) up to 2025 is shown in Figure 5.
| Year and Month | Forecast | 80% Confidence Interval | 95% Confidence Interval | ||
|---|---|---|---|---|---|
| Lower Bound | Higher Bound | Lower Bound | Higher Bound | ||
| 2021 | |||||
| April | 14005.53 | 13929.18 | 14081.47 | 13888.59 | 14121.50 |
| May | 14039.26 | 13919.36 | 14158.15 | 13855.47 | 14220.68 |
| June | 14066.61 | 13918.25 | 14213.42 | 13839.07 | 14290.53 |
| July | 14110.13 | 13910.03 | 14307.43 | 13802.93 | 14410.78 |
| August | 14158.46 | 13906.66 | 14405.86 | 13771.51 | 14535.12 |
| September | 14210.84 | 13907.69 | 14507.65 | 13744.51 | 14662.33 |
| October | 14265.25 | 13912.98 | 14609.03 | 13722.84 | 14787.78 |
| November | 14320.87 | 13921.70 | 14709.20 | 13705.69 | 14910.68 |
| December | 14377.07 | 13933.13 | 14807.71 | 13692.30 | 15030.68 |
| January | 14433.52 | 13946.66 | 14904.48 | 13681.92 | 15147.86 |
| February | 14489.99 | 13961.81 | 14999.58 | 13673.95 | 15262.46 |
| March | 14546.35 | 13978.20 | 15093.14 | 13667.88 | 15374.72 |
| Mean Total | 14251.99 | 12763.95417 | 14566.42667 | 13753.88833 | 14729.59333 |
| 2022 | |||||
| April | 14602.54 | 13995.54 | 15185.28 | 13663.31 | 15484.90 |
| May | 14658.49 | 14013.62 | 15276.16 | 13659.93 | 15593.23 |
| June | 14714.19 | 14032.26 | 15365.88 | 13657.49 | 15699.92 |
| July | 14769.61 | 14051.31 | 15454.56 | 13655.78 | 15805.14 |
| August | 14824.76 | 14070.67 | 15542.30 | 13654.63 | 15909.05 |
| September | 14879.62 | 14090.25 | 15629.18 | 13653.92 | 16011.77 |
| October | 14934.20 | 14109.97 | 15715.26 | 13653.52 | 16113.41 |
| November | 14988.49 | 14129.78 | 15800.61 | 13653.36 | 16214.06 |
| December | 15042.51 | 14149.62 | 15885.29 | 13653.34 | 16313.81 |
| January | 15096.24 | 14169.46 | 15969.33 | 13653.41 | 16412.73 |
| February | 15149.70 | 14189.26 | 16052.78 | 13653.51 | 16510.86 |
| March | 15202.89 | 14208.99 | 16135.68 | 13653.60 | 16608.27 |
| Mean Total | 14905.27 | 12916.81167 | 15667.6925 | 13655.48333 | 16056.42917 |
| 2023 | |||||
| April | 15255.80 | 14228.62 | 16218.05 | 13653.62 | 16705.01 |
| May | 15308.44 | 14248.14 | 16299.92 | 13653.56 | 16801.10 |
| June | 15360.82 | 14267.52 | 16381.31 | 13653.38 | 16896.59 |
| July | 15412.93 | 14286.76 | 16462.25 | 13653.05 | 16991.51 |
| August | 15464.79 | 14305.83 | 16542.75 | 13652.55 | 17085.88 |
| September | 15516.39 | 14324.73 | 16622.84 | 13651.86 | 17179.74 |
| October | 15567.73 | 14343.44 | 16702.52 | 13650.96 | 17273.09 |
| November | 15618.82 | 14361.95 | 16781.82 | 13649.84 | 17365.97 |
| December | 15669.66 | 14380.27 | 16860.74 | 13648.49 | 17458.39 |
| January | 15720.26 | 14398.38 | 16939.29 | 13646.89 | 17550.37 |
| February | 15770.61 | 14416.27 | 17017.49 | 13645.03 | 17641.92 |
| March | 15820.71 | 14433.95 | 17095.35 | 13642.90 | 17733.06 |
| Mean Total | 15540.58 | 13130.15917 | 16660.36083 | 13650.1775 | 17223.5525 |
| 2024 | |||||
| April | 15870.58 | 14451.40 | 17172.88 | 13640.50 | 17823.79 |
| May | 15920.21 | 14468.63 | 17250.07 | 13637.81 | 17914.14 |
| June | 15969.61 | 14485.63 | 17326.95 | 13634.83 | 18004.11 |
| July | 16018.77 | 14502.40 | 17403.52 | 13631.56 | 18093.72 |
| August | 16067.71 | 14518.93 | 17479.79 | 13627.99 | 18182.96 |
| September | 16116.41 | 14535.23 | 17555.76 | 13624.12 | 18271.86 |
| October | 16164.89 | 14551.29 | 17631.43 | 13619.93 | 18360.41 |
| November | 16213.15 | 14567.11 | 17706.82 | 13615.44 | 18448.64 |
| December | 16261.18 | 14582.70 | 17781.93 | 13610.63 | 18536.53 |
| January | 16309.00 | 14598.04 | 17856.76 | 13605.49 | 18624.10 |
| February | 16356.59 | 14613.14 | 17931.32 | 13600.04 | 18711.36 |
| March | 16403.98 | 14628.01 | 18005.62 | 13594.27 | 18798.32 |
| Mean Total | 16139.34 | 14541.87583 | 17591.90417 | 13620.2175 | 18314.16167 |
| 2025 | |||||
| April | 16451.14 | 14642.63 | 18079.65 | 13588.17 | 18884.97 |
| May | 16498.10 | 14657.01 | 18153.42 | 13581.74 | 18971.32 |
| June | 16544.85 | 14671.15 | 18226.94 | 13574.99 | 19057.38 |
| July | 16591.39 | 14685.05 | 18300.21 | 13567.90 | 19143.15 |
| August | 16637.72 | 14698.71 | 18373.23 | 13560.49 | 19228.65 |
| September | 16683.85 | 14712.13 | 18446.00 | 13552.74 | 19313.86 |
| October | 16729.78 | 14725.32 | 18518.54 | 13544.66 | 19398.79 |
| November | 16775.51 | 14738.26 | 18590.83 | 13536.25 | 19483.46 |
| December | 16821.04 | 14750.97 | 18662.90 | 13527.51 | 19567.86 |
| January | 16866.37 | 14763.43 | 18734.72 | 13518.43 | 19652.00 |
| February | 16911.51 | 14775.67 | 18806.32 | 13509.01 | 19735.87 |
| March | 16956.45 | 14787.67 | 18877.70 | 13499.26 | 19819.49 |
| Mean Total | 16705.6425 | 14717.33333 | 18480.87167 | 13546.7625 | 19354.73333 |

An insightful prediction of type 2 diabetes by 2025.
5. Discussion
This study reported present trends and forecasting of T2DM burden in Semnan, Iran. The time series indicates a modestly increasing trend when broken down structurally. Time series explains how the past affects the future or how two time series can "interact", and also forecast future values of the series. There might be increasing variation as we move across time; however, it is uncertain. These changes answer the question, "Is there a trend, meaning that, on average, the measurements tend to increase or decrease over time (11).
In our study, the number of people with all diabetes types increased from 2015 to 2020 in Semnan province. As the most common type of diabetes, T2DM increased from 75203 in 2015 to 165143 in 2020. In a previous cross-sectional study on the T2DM burden in Semnan province in 2009, the prevalence of T2DM and IFG was estimated to be 9% and 15.4%, respectively. In more than 47% of cases of diabetes, patients were unaware of their disease (9). In this research, they raised the alarm about rising T2DM incidence, citing the high prevalence of hypertension, abdominal obesity (definite as a waist-to-hip proportion of more than 0.9 for men and more than 0.8 for women), and abnormal waist circumference (defined as a waist circumference of more than 102 for men and more than 88 cm for women) which were reported to be 51.2%, 86.8%, and 58.8% respectively (9). Eventually, in a study on 28,321 Iranian adults aged between 28 to 48 years in 2016, the highest obesity prevalence was reported in Semnan (30.6%) (12). Thus, the high prevalence of these risk factors may explain the growing frequency of T2DM from 2009 to 2015.
Regarding the current study results until 2025, Semnan will witness a 17% increase in the number of people living with T2DM. The increase in T2DM incidence projected in this study was in line with a study on the projection of the diabetes population size through 2030 in Iran; by 2030, diabetic patients are projected to be 9.24 million in Iran (6.73 million diagnosed, 2.50 million undiagnosed) (13). Furthermore, in a study on the burden of non-communicable diseases in Iran, it is anticipated that diabetes will create a more considerable burden on the Iranian health system soon, given the rising frequency of overweightness and obesity amongst children and adolescents (14). Therefore, prevention of T2DM should be done at the national and governorate levels, using multi-sectoral and multi-level strategies. T2DM is a new social and economic danger requiring government and community assistance development. In addition, public awareness campaigns and interventions should be expanded to reduce modifiable risk factors for T2DM.
These trends and 5-year forecasts are a valuable resource for Iran's ministry of health and Semnan's health authorities, as they help them comprehend the scope of diabetes and its impact on residents. In addition, awareness can catalyze forming of local coalitions of interested parties to develop specific solutions to their community's most pressing diabetes issues. Also, this forecast estimates the future needs of the healthcare workforce and the expected cost growth for planning and budgeting purposes. When competing for limited financing, comprehensive projection helps make a coherent and compelling case (15). Numerous studies have shown that treating individuals at high risk of T2DM with lifestyle modifications, such as diet and exercise and pharmaceutical (metformin) treatments, may help reduce T2DM occurrence (16-18). Structured interventions aimed at obesity, smoking, and physical inactivity have also been demonstrated to have a favorable influence on the T2DM epidemic (18).
Additionally, such efforts include higher taxes on sugar-sweetened beverages (i.e., fiscal limitations) or subsidies for healthier meals (such as fruits and vegetables) (19). Part of the T2DM treatment strategy may be dedicated to clinics for diabetes mellitus at the primary care level, with full access to all T2DM medicines and clear pathways for a further and tertiary referral. Furthermore, every primary care clinic may keep a local DM registry as a surveillance and screening tool for DM complications and an annual screening tool for DM-related issues. In most primary health care institutions, obesity clinics have recently been established (20).
Overall, our results are helpful for community leaders and health professionals to build targeted initiatives for most in-need individuals. They are also critical in providing valuable information to persons concerned about diabetes in their families and communities. Awareness is a powerful force for change.
5.1. Limitations
One of the limitations of our study is the limited size of the examined community and the inability to record data from people with latent diabetes or the failure to register data by the city of residence.
5.2. Conclusions
Despite notable investments in clinical care, research, and public health interventions, T2DM is becoming a major source of human misery and mortality. Thus, this outbreak will require a significant national commitment to proactive remedies, including public policies and financial incentives for localities to begin diabetes preventive initiatives. In addition, to combat the DM epidemic, preventive plans concentrating on the control of modifiable risk factors, such as obesity, must be implemented.
