


1. Background
Learning is a complex process in which various factors can play influential roles (1). In adult learning theories, education means creating favorable conditions and atmosphere for learning, transferring knowledge, and engaging the learner in various skills (2). Learning should occur in an environment that provides new opportunities for each learner according to the person’s circumstances. Such an environment makes the learners discover their surroundings in their own special way (3, 4). Therefore, the educational environment is the main determining factor in creating motivation for learning because strengthening positive behaviors toward learning will lead to academic progress.
Moreover, the educational environment has a significant impact on the student’s satisfaction and achievement of goals (5-7). In this regard, the research emphasizes that the academic environment in universities plays an essential role in training skilled graduates (8). The most important dimensions of the environment are the teaching and learning activities and the interaction between the faculty members and the students in the everyday environment of the university (8). Therefore, understanding the issues of the educational environment and the factors related to it is essential for the transformation, adjustment, and management of educational programs (5-7). The students experience the environment from their perspectives, and it is their understanding of the environment that shapes their behaviors (9). Therefore, it is necessary to identify and strengthen the weak points of the learning environment. This requires that students’ perceptions be given more importance to improve the learning environment (10).
The evaluation of educational environments is the key to achieving a student-centered and qualified curriculum (11), and many faculties of medical sciences have investigated students’ views about the educational environment as they are the main stakeholders in the field of medical science education (12). Moreover, innovation in medical sciences education programs and increased diversity of students in different medical science courses have led to an increase in the need to evaluate the educational environment of medical science schools (13). Various methods are used to evaluate the educational environment, and one of these models is the Dundee Ready Educational Environment Measure (DREEM) presented at the University of Dundee, Scotland. This model is used to diagnose learning problems and the effectiveness of changes in education to identify the differences between the real and the ideal environment (14).
Studies have shown that the DREEM is a valuable tool for collecting feedback on the strengths and weaknesses of the educational environment (15). Quiroga-Maraboli et al. used the DREEM in a physical therapy undergraduate program to identify patterns in educational environment perceptions among the students. They showed that physical therapy students at the University of Chile positively perceived their educational environment (16). The perception of the educational environment in physiotherapy students was evaluated using the DREEM in India. The results showed that the students had a “more positive than negative” view of the academic environment (17).
Pashmdarfard et al. emphasized that the DREEM is a valuable model in evaluating occupational therapy (OT) environments in their scoping review study since this model can provide feedback on the strengths and weak points of the educational environment of institutions. Another distinguished purpose of the DREEM is that it allows for an efficient way to compare medical colleges and empowers them to assess their academic status (18). There is a paucity of research regarding the strengths and weaknesses of the educational environment in the rehabilitation field. The evaluation of the educational environment can be helpful in improving the educational conditions at universities. In addition, the study of the educational environment might widen our perspective on its strengths and weaknesses.
2. Objectives
It should be noted that, in this study, the academic environment was somewhat different for the two groups (due to the academic degree of professors, which mainly was a master’s degree for group 1 and a Ph.D. degree for group 2). One of the goals of this study was to compare these two groups’ academic environment perceptions. Therefore, it was decided to conduct this study to evaluate the educational environment in the School of Rehabilitation Sciences at Shiraz University of Medical Sciences (SUMS), Shiraz, Iran, focusing on OT students using the DREEM questionnaire.
3. Methods
This study was a cross-sectional, descriptive-analytical, and applied one. The statistical population of the research was all the students studying OT (using census sampling) at the School of Rehabilitation Sciences at the SUMS. The investigations were carried out on two occasions, including the years 2017 to 2021. In the study of the year 2017, the students’ perspectives of the four incomings between 2013 to 2016, and in the year 2020, the students’ perspectives of another four incomings between 2017 to 2020 were studied regarding the educational environment of OT. This study compared these two groups as most of the faculty members were on educational missions for a Ph.D. degree until 2017; however, after this year, the faculty members started to come back and worked full-time in the group, and their academic degrees improved. Another reason was that virtual education was experienced since February 2020 due to the coronavirus disease 2019 (COVID-19) pandemic, which was a completely different condition in OT education at SUMS.
The Persian version of the DREEM educational environment questionnaire was utilized, which consists of 50 items on a 5-point Likert scale to measure the dimensions of students’ perception of learning (SPL) (12 items), students’ perception of professors (SPP) (11 items), students’ perception of their academic ability (SPA) (8 items), students’ perception of the educational atmosphere (SPAt) (12 items), and students’ perception of social conditions (SPS) (7 items). In the study of Falah Khairi Langroudi et al., the validity and reliability of this questionnaire were validated in Iran, and Cronbach’s alpha was reported as 0.933. Some items in the questionnaire have a negative load, and their grading is reversed. The overall score of the study was reported as unfavorable (0 - 50), semi - favorable (51 - 100), favorable (101 - 150), and very favorable (151 - 200) educational environments (9).
In the first stage of the study, the Dundee questionnaire was presented to all first-to-fourth-year students of 2013 - 2016 admissions in May 2017 for completion. It was collected after responding. The researcher attended the students’ classes and distributed and collected the questionnaires before the professors started teaching. The students were given 30 minutes to complete the questionnaire. The number of OT students in 2017 was 92.
The second time, the Dundee questionnaire was presented to all first-to-fourth-year students of 2017-2020 incomings in May 2021 in the virtual form for completion. After responding, they were collected by sending a filled e-questionnaire (electronic questionnaire) to the researcher. The total number of OT students in 2021 at the time of completing the questionnaires was 102. If a questionnaire was not completely filled, it was removed from the study.
The inclusion and exclusion criteria in the study at the time of both studies were according to several items. The inclusion criteria were studying as an OT student in the second, fourth, sixth, and eighth semesters. The exclusion criterion was the unwillingness of the student to participate in the study.
After completing the questionnaires and scoring their items individually, the data were entered into SPSS software (version 23). Descriptive statistics, including frequency, mean, and standard deviation (SD), were used to describe and analyze the collected data. The Kolmogorov-Smirnov test was used to check the level of normality of the data. The Mann-Whitney and Kruskal-Wallis statistical tests were used to investigate and compare OT students’ perceptions of the university’s educational environment.
The Research Committee of SUMS affirmed this study (No. 11684) with an ethical code of ir.sums.rec.1396.s287. Additionally, written consent was obtained from the participants before carrying out the study. The participants were ensured anonymity and were guaranteed that the data would not be utilized for or against them. In addition, no data manipulation would occur.
4. Results
Of all 194 OT students from 2013 to 2020, 136 cases participated in this study. Additionally, 58 students did not participate or did not complete the questionnaires and were excluded from the study. In this study, 82 (58 female and 24 male) and 54 (41 female and 13 male) students were from the 2013 - 2016 and 2017 - 2020 groups, respectively. The mean age of the participants in the first and second groups was 21.42 ± 1.22 and 20.61 ± 1.85 years, respectively. Furthermore, the mean grade point average (GPA) in the first and second groups was 16.78 ± 1.20 and 17.23 ± 1.12, respectively.
The average total score of the educational environment questionnaire for all 136 students was 102.301 ± 20.607. Descriptive statistics of the DREEM for all the participants are presented in Table 1. The average total scores of the DREEM questionnaire for the first and second groups of students were 95.804 ± 13.79 and 112.166 ± 25, respectively.
| No. | Minimum | Maximum | Mean ± SD | |
|---|---|---|---|---|
| SPL | 136 | 14.00 | 80.00 | 37.852 ± 10.446 |
| SPP | 136 | 3.00 | 24.00 | 12.588 ± 3.352 |
| SPA | 136 | 4.00 | 28.00 | 16.316 ± 3.689 |
| SPAt | 136 | 4.00 | 28.00 | 17.125 ± 3.907 |
| SPS | 136 | 8.00 | 26.00 | 17.941 ± 3.429 |
| Total | 136 | 53.00 | 189.00 | 102.301 ± 20.607 |
Abbreviations: SPL, students’ perception of learning; SPP, students’ perception of professors; SPA, students’ perception of their academic ability; SPAt, students’ perception of the educational atmosphere; SPS, students’ perception of social conditions.
The results of the normality of the data in the two groups of the first four entries and the second four entries showed that the data distribution was normal in the total scores of perceptions of the educational environment. Therefore, a t-test was used to compare the means (P < 0.05). There was a statistically significant difference in the perception of students in these two groups. The students’ perception of the educational environment in the second group, including 4 years between 2017 to 2020, showed a better quality in the total score of the educational environment.
The mean and SD of scores for two groups in different years and different subgroups are shown in Table 2 and Table 3.
| First (2013) | Second (2014) | Third (2015) | Fourth (2016) | |
|---|---|---|---|---|
| Number | 24 | 21 | 24 | 25 |
| SPL | 31.20 (7.16) | 32.90 (7.99) | 37.38 (8.61) | 42.62 (3.09) |
| SPP | 11.62 (3.68) | 11.57 (2.87) | 12.33 (2.15) | 11.50 (1.50) |
| SPA | 14.70 (3.32) | 15.61 (3.04) | 16.61 (3.45) | 15.93 (2.26) |
| SPAt | 16.54 (3.29) | 15.14 (4.41) | 16.66 (3.35) | 14.93 (2.46) |
| SPS | 16.45 (3.21) | 16.38 (2.88) | 17.57 (2.76) | 17.93 (2.43) |
| Total | 90.54 (13.01) | 91.61 (14.69) | 100.57 (14.16) | 102.93 (7.58) |
Abbreviations: SPL, students’ perception of learning; SPP, students’ perception of professors; SPA, students’ perception of their academic ability; SPAt, students’ perception of the educational atmosphere; SPS, students’ perception of social conditions.
| First (2017) | Second (2018) | Third (2019) | Fourth (2020) | |
|---|---|---|---|---|
| Number | 26 | 27 | 25 | 22 |
| SPL | 37.00 (11.20) | 39.38 (8.89) | 42.88 (14.17) | 44.22 (13.55) |
| SPP | 13.20 (4.07) | 13.15 (3.13) | 14.22 (4.17) | 14.36 (4.03) |
| SPA | 15.70 (2.90) | 18.23 (3.60) | 17.11 (5.48) | 17.54 (4.58) |
| SPAt | 17.90 (3.38) | 18.30 (3.56) | 19.77 (5.11) | 19.54 (3.46) |
| SPS | 16.50 (3.34) | 18.92 (3.14) | 20.55 (3.32) | 20.40 (3.76) |
| Total | 100.30 (20.69) | 108.00 (17.53) | 121.44 (33.03) | 116.22 (25.96) |
Abbreviations: SPL, students’ perception of learning; SPP, students’ perception of professors; SPA, students’ perception of their academic ability; SPAt, students’ perception of the educational atmosphere; SPS, students’ perception of social conditions.
The result of the Mann-Whitney test in the distribution of non-normal data between the first and second groups in the subdomains related to the perception of the environment showed that in all five subdomains, including SPL, SPP, SPA, SPAt, and SPS, there was a statistically significant difference between the two groups. In all fields, the average scores obtained in the second 4 years were higher. These results are shown in Table 4.
| Mann-Whitney U Statistics | P-Value | |
|---|---|---|
| SPL | 1614.000 | 0.008 |
| SPP | 1378.000 | 0.000 |
| SPA | 1563.000 | 0.004 |
| SPAt | 1242.000 | 0.000 |
| SPS | 1346.500 | 0.000 |
Abbreviations: SPL, students’ perception of learning; SPP, students’ perception of professors; SPA, students’ perception of their academic ability; SPAt, students’ perception of the educational atmosphere; SPS, students’ perception of social conditions.
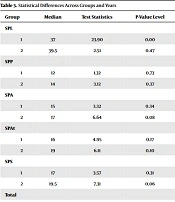
The Kruskal-Wallis non-parametric test was used to check the differences between subgroups in the two groups. In this way, the grades of the subgroups of the first and second groups were examined during different academic years. The obtained results are shown in Table 5.
| Group | Median | Test Statistics | P-Value Level |
|---|---|---|---|
| SPL | |||
| 1 | 37 | 23.90 | 0.00 |
| 2 | 39.5 | 2.51 | 0.47 |
| SPP | |||
| 1 | 12 | 1.32 | 0.73 |
| 2 | 14 | 3.12 | 0.37 |
| SPA | |||
| 1 | 15 | 3.32 | 0.34 |
| 2 | 17 | 6.64 | 0.08 |
| SPAt | |||
| 1 | 16 | 4.95 | 0.17 |
| 2 | 19 | 6.11 | 0.10 |
| SPS | |||
| 1 | 17 | 3.57 | 0.31 |
| 2 | 19.5 | 7.31 | 0.06 |
| Total | |||
| 1 | 96.5 | 11.27 | 0.01 |
| 2 | 112 | 6.24 | 0.10 |
Abbreviations: SPL, students’ perception of learning; SPP, students’ perception of professors; SPA, students’ perception of their academic ability; SPAt, students’ perception of the educational atmosphere; SPS, students’ perception of social conditions.
5. Discussion
This study was conducted to investigate OT students’ perception of the educational environment in the School of Rehabilitation Sciences of SUMS. The results of the study revealed that the average perception score of the eight incoming students regarding the educational environment is slightly above 100 with an SD of 20, which indicates a semi-favorable to favorable educational environment score, and its range is from 53 which is not favorable to 189, which shows very favorable scores. In detail, the scores related to students’ perception of the educational environment in the first group, including the entries of 2013, 2014, 2015, and 2016, showed semi-favorable to favorable conditions. Furthermore, the scores related to students’ perception of the educational environment in the second group, including the 2017 and 2018 entries, showed a semi-favorable to favorable circumstances. In this second group, the scores of incoming students in 2019 and 2020 showed a semi-favorable to very favorable status.
There are limited studies in other universities about the perception of OT students regarding the educational environment. Orakifar et al. represented that the overall score of the questionnaire for the majors in Ahvaz Faculty of Rehabilitation Sciences, Ahvaz, Iran (i.e., OT, physiotherapy, audiology, and speech therapy) was above 130. The educational environment of this faculty was in good condition, and the attitude of students was positive. The total score of OT student perception was 144 ± 13.03, which indicates favorable to very favorable conditions at that school in the academic year of 2018 - 2019 (19).
In a study related to the perception of OT students about academic learning environment by Stigen et al., it was argued that the students perceived that they were less independent from the first to second and third years, and a perceived decline in the quality of teaching from first to second and third years was emphasized which must be considered in teaching for OT students. In this study, the Course Experience Questionnaire (CEQ) was utilized (20). Brown et al. mentioned that students’ perception of the educational environment at Monash University in Australia was positive (137.3 ± 18.3) and that, in OT students, the total score was 140 ± 19.0 (21). In general, it seems that the scores obtained in this study were lower than the aforementioned studies.
Maayah et al. evaluated the perceptions of undergraduate applied medical sciences students at the Saudi Arabia University of Medical Sciences using the DREEM. The perceptions of the students about their educational environment were better than the current study (22). In 2019, the perception of the learning environment among nursing students in Nepal was evaluated. The results of this study are in conjunction with the results of the present study regarding varied perceptions of the learning environment according to the year of incoming (23). Stormon et al. evaluated dentistry students’ perception of the academic learning environment in Australia. Australian dentistry students showed a more positive inclination toward the learning environment than the present study’s students (24).
The results of this study showed that the grades of the students of the second group (4 years of 1996 to 1999) were higher than those of the students of the first group (4 years of 1996 to 1999). In addition, the difference in the scores of these two groups was statistically significant in the scores of all subcategories and the total scores. This important issue could be due to the fact that the second group had a better education than the first group, as most of the present study’s faculty members were on educational missions for a Ph.D. degree from 2010 to 2017. Still, after this year, the current study’s faculty members started to come back and work full-time in the group, and their academic degrees were improved. This issue can also be looked at in the grades obtained from the SPP. In this way, the scores of this subcategory were higher on average in the second group. During the years that the second group studied, the number of OT faculty members was higher, and these professors had a relatively higher academic degree of Ph.D.
It seems that there is an apparent difference between the scores of students in different years (i.e., freshman, sophomore, junior, and senior). The present study’s students have shown a more negative perception of the educational environment with the increase in their years of study at the university. This issue is especially evident in the first group of students. Concerning the students of the second group, it seems that the newest students in 2020 have shown a decline in their perception scores, which might be due to the problems in virtual education due to the conditions that COVID-19 imposed on individuals.
The COVID-19 pandemic has doubtlessly disrupted the traditional structure of medical education (25). The biggest challenge we are facing in the third and fourth years of the current students’ studying is that these two years are precisely the time of clinical education. Unfortunately, there are many limitations in the facilities. The most important limitations are the lack of trained and experienced instructors for clinical teaching, the limited number of clinical fields (i.e., clinics and hospitals), the limited facilities for proper assessment and intervention in the clinical field, the large number of students in a small clinical environment, and the lack of up-to-date clinical facilities which can cause many problems for the third- and fourth-year education.
The present study’s results are in line with some results obtained from other studies. In Koli and Dhaliwal’s study, it was also represented that the score of the DREEM questionnaire decreases with the increase of the academic year (26). On the other side, some researchers have considered the university year of students unrelated to students’ satisfaction with their academic conditions. Demiroren et al.’s study claimed that the academic year could impact the level of students’ satisfaction. They reported that students’ grades reached the maximum in the third year, and this increase was maintained in the fourth year (27).
Among the problems encountered in the current study were the lack of cooperation of all the students and the unavailability of a number of students to complete the questionnaire. In addition, two different methods have been used to collect data in two different groups, which might cause interference in the comparison of data. This was the major limitation of this study.
It is highly suggested that all OT departments in the country evaluate their educational environment as an effective item for improving educational quality. Moreover, it is possible to have some sessions between different universities regarding solving the common problems in this regard, which can result in high-quality education in the studied major.
Regardless of the unique situation of every educational environment, it seems that the number of OT faculty members and their academic degrees might affect the students’ perception of education. In addition, the COVID-19 pandemic might have affected educational environments. This might be the case in other educational environments. For future studies, it is recommended to study COVID-19’s impact on educational environments and investigate the reasons behind students’ satisfaction and dissatisfaction regarding the educational environment.
Research into education might pave the way for an improved educational environment, which can lead to higher-quality medical education. A higher quality of medical education can improve medical services for patients.
5.1. Conclusions
Program evaluation is an effective way to improve educational services. As the present study considered the DREEM for the evaluation of the educational environment according to students’ perception, it was perceived that there are some weak points in this important issue that need to be noticed by educational managers. Moreover, the students’ satisfaction decreased with the promotion of the students’ year. This important issue must be considered in strategic planning for the studied department.
